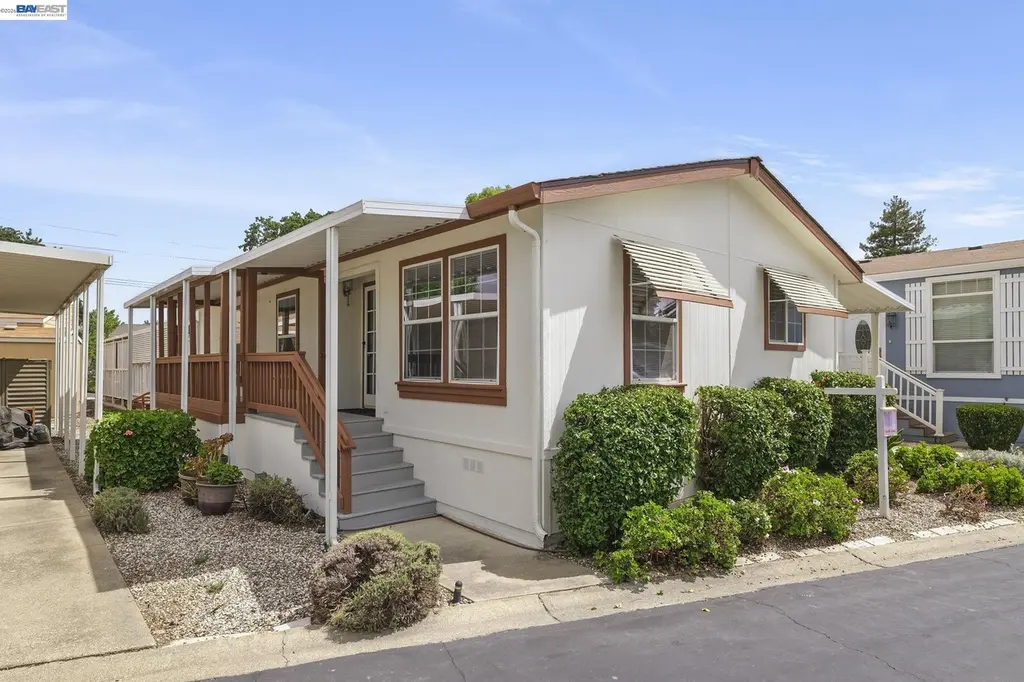
3263 Vineyard Ave., #187 #187 · Pleasanton, CA
Flood risk 1/10 · Minimal
- FEMA flood zone
- X (unshaded)
- Chance of flooding over 30 yrs
- 0.0%
- Est. flood insurance / yr
- $507 – $1,088
Fire risk 6/10 · Moderate
- Est. fire insurance / yr
- $659 – $1,223
Heat risk 4/10 · Minor
- Hot days now (above 97°F)
- 7 days/yr
- Hot days in 30 yrs
- 14 days/yr
Wind risk 1/10 · Minimal
- Chance of severe wind over 30 yrs
- —
Air-quality risk 9/10 · Severe
- Unhealthy air days now
- 19 days/yr
- Unhealthy air days in 30 yrs
- 21 days/yr
Risk factors via First Street. Map © Google.
Why this score? — see what drove the B grade
The composite is a weighted blend of 9 inputs, each scored 0–100. Each bar is that input's sub-score; the figure is the points it added to the 100-point composite (weight × sub-score).
- Cash flow +30.0/30.0
- DSCR +10.0/10.0
- ARV discount +7.5/15.0
- 1% rule +7.3/10.0
- Schools +7.3/10.0
- Livability +4.2/5.0
- Rent growth +4.0/5.0
- Condition / age +2.5/5.0
- Appreciation +0.0/10.0
$255,000
🖨 Deal sheet 📄 Offer letter ✓ Due diligence
Listing remarks MLS
Vineyard Estates is a lovely senior mobile home park. Buyer must get approved by Manager. 2 bedrooms plus a den, 2 bath, 2 car tandem carport. Seller prefers "as is" sale. Escrow with Bay Area Escrow #1312314AL.
Key facts
- Open floor plan
- One story living
- Inviting front porch
Tags
Property features AI
Finance
- Other: Community in-ground fenced pool (heated spa); Community amenities include sauna and spa
- HOA & community: Vineyard Estates park; Senior community; Clubhouse, fitness center, pool, sauna and spa; BBQ and picnic areas; Game room and activities available; Dog park and car wash area; Guest parking; Park interview required; Pet restrictions with cats and dogs allowed (approval/number limit); Gas metered
Exterior
- Parking: Covered carport for 2 or more vehicles
- Utilities: Public water; Public sewer
- Home design: Manufactured in park (mobile home); Double-wide model (Waterford); Level lot
- Construction: Masonite exterior siding; Composition shingle roof; Crawl space foundation
- Exterior features: Covered deck / porch
Interior
- Kitchen: Dishwasher; Garbage disposal; Gas range / cooktop; Free-standing range / oven; Microwave; Refrigerator; Laminate counters; Updated kitchen
- Bedrooms: 2 bedrooms (street level)
- Flooring: Laminate flooring; Linoleum flooring
- Bathrooms: 2 full bathrooms; Showers over tubs
- Heating & cooling: Forced air heating; Central air conditioning; Ceiling fans
- Interior features: Updated kitchen; Dining area; Eat-in kitchen; Updated baths; Skylight(s); Window in baths; Window coverings; Double-pane windows; Screens
- Laundry & utility: Laundry room with washer and dryer; Laundry room cabinets; Gas water heater
Neighborhood map
What this means for you Summary
Snapshot
- This is a 2-bed/2.0-bath manufactured listed at $255k.
Deal economics
- At list price, monthly cash flow is $988 ($12k/yr) — positive.
- The deal already cash-flows at list — no discount required.
- Meets the 1% rule at list price ($3k rent vs $255k).
- Recommended offer: $251k (1.5% below list) — sets the bar for market timing.
- Cap rate 10.9% vs local median 1.3% in Pleasanton — top-decile yield for the area; either an underpriced asset or a hidden risk that comps aren't pricing in. Stress-test before assuming the spread holds.
Location & tenants
- Location reads 84/100 on livability (#17 in CA, #655 nationally) — a professional / high-income tenant draw. Strengths: schools A+, amenities A+, commute A+; Watch: cost of living F.
- Pleasanton Unified (urban): math 75% / reading 79% proficiency, ranked #43 of 1,400 in CA (top 3%) — strong family-tenant draw, lease renewals of 3-5y typical; only 6% free/reduced lunch — higher-income household profile.
- Market conditions: Rents rising fast (+6.0%/yr); 152 active listings in the ZIP; 12 comparable units currently listed for rent nearby; rentals at typical pace (median 17d on market — plan ~3-4 weeks tenant-placement turnaround); high-income renter base; 1,742 units permitted in Alameda County in 2024 (856 in 5+ unit buildings).
Forward outlook
- Local home prices are declining (-3.0%/yr); year-one equity from $2k of loan paydown is wiped out by about $8k of value loss. Plan a longer hold.
- Alameda County population projected at +34% by 2050 — long-run rental-demand tailwind backs the buy-and-hold thesis.
- At projected returns (-3.0% appreciation + 6.0% rent growth), your $71k cash investment doubles in ~7 years — after that, you're playing with house money.
Negotiation context
- It's been on market 20 days — a 2% lower offer ($251k) is reasonable based on typical stale-listing flexibility.
- 8 sale attempts since 21y ago with the ask held roughly flat each time — persistent listings suggest the price (not the market) is what's stuck; bring a comps-based counter.
- Current owner paid $130k; list at $255k implies a 96% gain — meaningful room to come down on a strong offer.
Risks & watch-outs
- Climate carrying-cost: major wildfire risk — expect insurance premiums to compound above CPI over the hold.
Questions for the listing agent
- Is there a deadline driving the sale (1031 exchange, divorce, estate, relocation)? That informs how much negotiation room exists.
- Schools are A-rated — typically a magnet for longer-tenancy family renters. What's the average tenant stay here, and is there a school-zone premium baked into asking?
- What's the average days-on-market for RENTAL listings here right now (not sales)? A rising rental-DOM trend means longer vacancies and softer asking-rent achievability than the comps imply.
- What's the recent tenant-quality profile in this submarket — average credit score on applications, eviction rate, late-payment / NSF rate, and stable-employment percentage? A property-management company in the area should have these aggregated.
- How much new for-sale + rental construction is in the pipeline within 1–3 miles? Heavy new supply typically softens prices + rents 12–24 months out; constrained supply supports both.
Investment metrics
- 1% rule
- 1.23% ✓
- Cap rate
- 10.94%
- Cash-on-cash
- 16.60%
- DSCR
- 1.74
- GRM
- 6.8
CMA / ARV
- ARV (on-the-fly)
- $164,736
- Comps found
- 6
Show comp detail 6 sales within ~0.75 mi
| Address | Dist | Beds/Ba | Sqft | Sold | Price | $/sf | Match |
|---|---|---|---|---|---|---|---|
| 3231 Vineyard #33 #33 | 0.06mi | 2/2.0 | 1,040 (-2%) | 2mo | $159,000 | $153 | 93 |
| 3263 Vineyard Ave #192 | 0.01mi | 2/2.0 | 1,050 (-1%) | 23mo | $160,000 | $152 | 80 |
| 3231 Vineyard Ave. #20 #20 | 0.10mi | 2/2.0 | 1,040 (-2%) | 22mo | $195,000 | $188 | 74 |
| 3231 Vineyard Ave #141 #141 | 0.23mi | 2/2.0 | 1,180 (+12%) | 3mo | $236,000 | $200 | 68 |
| 3231 Vineyard Ave #24 | 0.15mi | 2/2.0 | 1,120 (+6%) | 21mo | $175,000 | $156 | 66 |
| 3231 Vineyard Ave., #83 #83 | 0.20mi | 2/2.0 | 960 (-9%) | 24mo | $88,000 | $92 | 56 |
Match score weights: distance 35% · size 25% · config 20% · recency 20%. Top-matched comps best support the ARV.
Projected returns pro-forma
-3.0% appreciation · 6.04% rent growth · sell at horizon
- IRR
- 10.8%
- Equity multiple
- 1.44×
- Total profit
- $31,393
- Equity at exit
- $38,021
- IRR
- 22.0%
- Equity multiple
- 3.12×
- Total profit
- $151,195
- Equity at exit
- $22,048
Cash invested: $71,400 (down + closing). Projections, not guarantees.
Landlord ↔ Tenant lean methodology
- Overall (STATE)
- 18 Strongly Tenant-Friendly
- State California
- 18 Strongly Tenant-Friendly · D+13
- County
- — inherits STATE
- City
- — inherits STATE
ZIP-level market 94566
- Rents YoY
- 6.0%
- Active inventory
- 152
- Price-to-rent
- 6.8×
Monthly cashflow live
- Estimated rent
- $3,146 high interval (Pro) →
- Mortgage (P&I)
- −$1,337
- Tax from tax record
- −$54 /mo · $653/yr
- Insurance
- −$106
- HOA
- −$0
- Vacancy / Maint / Mgmt
- −$661
- Net cashflow
- $988
Break-even live
UW: 25.0% down · 7.5% · 30yr · 1.5% tax · 5.0% vac · 8.0% maint · 8.0% mgmt
Financing live
Cash to close
- Down payment
- $63,750
- Closing costs
- $7,650
- Reserves months
- —
- Total cash needed
- —
Loan-product check · same deal, 3 products live
Conventional
25% down · 7.5% · 30yr
- Down + closing
- —
- Monthly P&I
- —
- Monthly cashflow
- —
- DSCR
- —
- Eligible?
- —
Personal DTI + credit; lowest rate.
DSCR
20% down · 8.5% · 30yr
- Down + closing
- —
- Monthly P&I
- —
- Monthly cashflow
- —
- DSCR
- —
- Eligible?
- —
No personal income docs; deal must DSCR.
Hard money
10% down · 12.0% · 12mo
- Down + closing
- —
- Monthly P&I
- —
- Monthly cashflow
- —
- DSCR
- —
- Eligible?
- —
Short-term bridge; refi at stabilization.
Rent comps 12 comps
| Address | Beds | Baths | Sqft | Rent | $/sqft | DOM | Units | Dist |
|---|---|---|---|---|---|---|---|---|
| 749 Palomino Dr Unit C Pleasanton, CA | 2.0 | 1.5 | 1130 | $3,250 | $2.88 | 43d | 1 | 0.61mi |
| 3819 Vineyard Ave Pleasanton, CA | 1.0–3.0 | 1.0–1.5 | 863 | $2,940 | $3.40 | 1d | 14 | 0.63mi |
| 835 Palomino Dr Unit 2 Pleasanton, CA | 2.0 | 1.5 | 1080 | $2,850 | $2.64 | 20d | 1 | 0.64mi |
| 3847 Vineyard Ave Pleasanton, CA | 2.0 | 2.0 | 900 | $2,700 | $3.00 | 16d | 1 | 0.67mi |
| 242 Birch Creek Dr Pleasanton, CA | 2.0 | 2.5 | 1221 | $3,100 | $2.54 | 43d | 1 | 0.68mi |
| 3955 Vineyard Ave Pleasanton, CA | 1.0–2.0 | 1.0–1.5 | 829 | $3,436 | $4.14 | 1d | 5 | 0.77mi |
| 4059 Vineyard Ave Pleasanton, CA | 3.0 | 2.0 | 1300 | $3,850 | $2.96 | 24d | 1 | 0.85mi |
| 1539 Trimingham Dr Pleasanton, CA | 2.0 | 2.0 | 1369 | $3,600 | $2.63 | 2d | 1 | 1.07mi |
| 4320 Valley Ave Pleasanton, CA | 2.0 | 2.0 | 1073 | $3,474 | $3.24 | 3d | 2 | 1.39mi |
| 4468 Del Valle Pkwy Unit 1 Pleasanton, CA | 2.0 | 2.0 | 1280 | $3,100 | $2.42 | 16d | 1 | 1.42mi |
| 198 Peters Ave Unit C Pleasanton, CA | 2.0 | 2.0 | 878 | $2,950 | $3.36 | 43d | 1 | 1.48mi |
| 4411 Valley Ave Pleasanton, CA | 1.0 | 1.0 | 783 | $2,672 | $3.41 | 12d | 2 | 1.49mi |
Listing history 14 events
-
2026-06-18days on market $255,000 Active 20 DOM
-
2026-06-17days on market $255,000 Active 19 DOM
-
2026-06-16days on market $255,000 Active 18 DOM
-
2026-06-15days on market $255,000 Active 17 DOM
-
2026-06-13days on market $255,000 Active 15 DOM
-
2026-06-13days on market $255,000 Active 14 DOM
-
2026-06-09days on market $255,000 Active 11 DOM
-
2026-06-08days on market $255,000 Active 10 DOM
-
2026-06-07days on market $255,000 Active 9 DOM
-
2026-06-04days on market $255,000 Active 6 DOM
-
2026-06-03days on market $255,000 Active 5 DOM
-
2026-06-02days on market $255,000 Active 4 DOM
-
2026-06-01days on market $255,000 Active 3 DOM
-
2026-05-31days on market $255,000 Active 2 DOM
ⓘ Source: listings_history table (triggers on properties + properties_extension) + one-shot
backfill from property_details.listing_events for pre-trigger history.
Tax reassessment forecast CA · Resets to sale price
- Current annual tax
- $653 · $54/mo
- Projected year-2 tax
- $1,938 · $162/mo
- Expected delta
- +$1,285/yr (+$107/mo · 196.9%)
ⓘ Screening estimate from a state-policy table — verify with the county assessor before closing.
Climate risk First Street
- Flood 1/10 Low FEMA zone X (unshaded) · 0% chance over 30 yrs
- Wildfire 6/10 Major
- Heat 4/10 Moderate 7 d/yr ≥97°F today · 14 d/yr by 30 yrs out
- Wind 1/10 Low
- Air quality 9/10 Extreme 19 unhealthy d/yr today · 21 by 30 yrs out
Nearby sold comps map
Loading sold comps map…
Walkable amenities ~0.75 mi
Loading nearby amenities…
Taxation est. · year 1
- Rental income
- $37,757
- − Mortgage interest
- −$14,284
- − Property taxes
- −$653
- − Insurance
- −$1,275
- − Repairs & maintenance
- −$3,021
- − Management
- −$3,021
- − Depreciation
- −$7,418
- Taxable income
- $8,086
- Est. tax owed @ 24.0%
- −$1,941
- After-tax cash flow
- $9,913/yr
For passive investors: Depreciation is non-cash, so a rental often shows a tax loss while cash-flowing — sheltering income. Rental losses are passive: they offset passive income freely, and up to $25,000/yr can offset ordinary (W-2) income if you actively participate and your MAGI is under $100k (phasing out to $0 by $150k); unused losses carry forward. On sale, claimed depreciation is recaptured at up to 25%, and gains may owe capital-gains tax (a 1031 exchange can defer both). Figures are a year-1 estimate at your 24.0% rate — not tax advice; consult a CPA.
Schools (NCES district)
- District
- Pleasanton Unified
- NCES district ID
- 0600020
- Math proficiency
- 75% ▼ -1.00%
- Reading proficiency
- 79% ▼ -1.00%
- Median HH income
- $123,770
- Composite
- 73.12/100
- National rank
- #351
- State rank
- #43 of 1400 in CA
Livability — Pleasanton
- Score
- 84/100
- State rank
- #17
- US rank
- #655
Category grades
Schools grade is shown separately in the Schools card above.
Census & demographics
- Census place
- Pleasanton, CA
- County
- Alameda County · 1,614,355 people
- City population
- 78,550
- Metro
- San Francisco-Oakland-Berkeley, CA
- Population (ZIP)
- 44,222
- Household income
- $191,155
- Rent vs Own
- Severe rent burden
- 1190.0
Population outlook (Alameda County) Hauer SSP2
- Today (2025)
- 1,928,884 people
- By 2030
- 2,069,146 · +7.3%
- By 2040
- 2,338,405 · +21.2%
- By 2050
- 2,586,608 · +34.1%
- By 2075
- 3,061,911 · +58.7%
- By 2100
- 3,234,133 · +67.7%
Race, ethnicity, and origin ACS 2023
- Neighborhood character
- Diverse neighborhood (Simpson 0.66)
- Race & ethnicity
- White 42% Asian 38% Hispanic / Latino 13% Two or more races 10%
- Hispanic origin (detail)
- Mexican 9%
- Common ancestry
- Italian 3% Russian 3% Romanian 2%
- Foreign-born
- 33% · China, Canada, South Korea
- Languages at home
- 59% English-only · Other Indo-European 10% Chinese 10% Spanish 8%
Political lean MEDSL · Alameda
- 2024 margin
- Solid D (+53.6) · D 74.6% · R 21.0% · Other 4.4%
- 2008→2024 swing
- -5.9pp toward R · 2008: 59.5pp · 2024: 53.6pp
- All cycles
- 2024: D+53.6 2020: D+62.5 2016: D+64.4 2012: D+59.8 2008: D+59.5
Not yet ingested
- Civics
- —
Market trends
- HPI YoY
- ▼ -841.68%
- Current HPI
- 308.8324
- Rent YoY
- ▲ 6.04%
- Metro
- San Francisco-Oakland-Berkeley, CA
- State GDP YoY
- ▲ 3.21%
- F500 in state
- 116
Industry mix (Fortune 500 HQ in CA)
| Industry | F500 HQs | Revenue |
|---|---|---|
| Technology | 27 | $1,492B |
|
||
| Financial Services | 3 | $174B |
|
||
| Retail | 3 | $44B |
|
||
| Insurance | 3 | $26B |
|
||
| Media / Entertainment | 2 | $115B |
|
||
| Pharmaceuticals / Biotech | 2 | $62B |
|
||
Price history
+31.1% since first listed21 events — show timeline
- 2026-05-29 Listed $255,000 bridgeMLS, Bay East AOR, or Contra Costa AOR
- 2014-03-28 Sold (MLS) $130,000 bridgeMLS, Bay East AOR, or Contra Costa AOR
- 2014-03-25 Pending — bridgeMLS, Bay East AOR, or Contra Costa AOR
- 2014-03-17 Pending — bridgeMLS, Bay East AOR, or Contra Costa AOR
- 2014-02-15 Price Changed $139,500 bridgeMLS, Bay East AOR, or Contra Costa AOR
- 2013-11-18 Listed $150,000 bridgeMLS, Bay East AOR, or Contra Costa AOR
- 2009-07-10 Listing Removed — bridgeMLS, Bay East AOR, or Contra Costa AOR
- 2009-06-11 Listed — bridgeMLS, Bay East AOR, or Contra Costa AOR
- 2009-03-01 Listing Removed — bridgeMLS, Bay East AOR, or Contra Costa AOR
- 2009-02-05 Price Changed — bridgeMLS, Bay East AOR, or Contra Costa AOR
- 2009-01-05 Price Changed — bridgeMLS, Bay East AOR, or Contra Costa AOR
- 2008-12-14 Listing Removed — bridgeMLS, Bay East AOR, or Contra Costa AOR
- 2008-12-14 Listed — bridgeMLS, Bay East AOR, or Contra Costa AOR
- 2008-12-02 Listing Removed — bridgeMLS, Bay East AOR, or Contra Costa AOR
- 2008-11-20 Listed — bridgeMLS, Bay East AOR, or Contra Costa AOR
- 2008-11-20 Listed — bridgeMLS, Bay East AOR, or Contra Costa AOR
- 2008-11-17 Listing Removed — bridgeMLS, Bay East AOR, or Contra Costa AOR
- 2008-07-23 Listed — bridgeMLS, Bay East AOR, or Contra Costa AOR
- 2005-12-15 Sold (MLS) $180,000 bridgeMLS, Bay East AOR, or Contra Costa AOR
- 2005-10-30 Listing Removed — bridgeMLS, Bay East AOR, or Contra Costa AOR
- 2005-10-10 Listed $194,500 bridgeMLS, Bay East AOR, or Contra Costa AOR
Property tax history
-0.5%/yrLatest (2025): $653 · -0.4% YoY. Source: county tax records.
Cash-flow waterfall
monthlySold comps — $/sqft
last 12 mo · ≤1 miLoading sold comps…