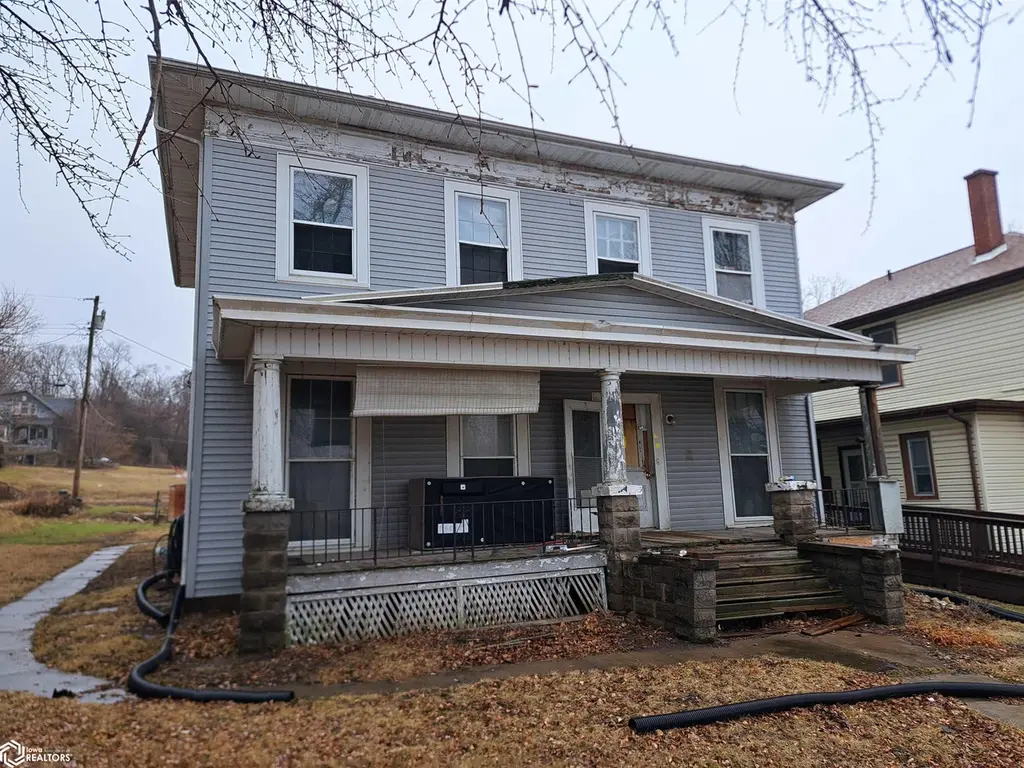
105 S 6th St · Burlington, IA
Flood risk 1/10 · Minimal
- FEMA flood zone
- X (unshaded)
- Chance of flooding over 30 yrs
- 0.0%
- Est. flood insurance / yr
- $473 – $860
Fire risk 1/10 · Minimal
- Est. fire insurance / yr
- $902 – $1,676
Heat risk 3/10 · Minor
- Hot days now (above 106°F)
- 7 days/yr
- Hot days in 30 yrs
- 16 days/yr
Wind risk 2/10 · Minimal
- Chance of severe wind over 30 yrs
- —
Air-quality risk 2/10 · Minimal
- Unhealthy air days now
- 0 days/yr
- Unhealthy air days in 30 yrs
- 1 days/yr
Risk factors via First Street. Map © Google.
Why this score? — see what drove the D+ grade
The composite is a weighted blend of 9 inputs, each scored 0–100. Each bar is that input's sub-score; the figure is the points it added to the 100-point composite (weight × sub-score).
- Cash flow +15.0/30.0
- ARV discount +7.5/15.0
- 1% rule +5.0/10.0
- DSCR +5.0/10.0
- Schools +4.0/10.0
- Livability +3.7/5.0
- Rent growth +2.5/5.0
- Condition / age +2.5/5.0
- Appreciation +0.0/10.0
$29,500
🖨 Deal sheet 📄 Offer letter ✓ Due diligence
Listing remarks
Contractor/Developer Special, sold as-is! Great Location! This property is not livable, and requires a full rehab. Would make a great home, rental property, or office (contingent on zoning). Very large historic building with tons of character and original trim. Main level has foyer with a grand wrap-around staircase and curved walls, library/living room, parlor/dining room, kitchen, study, and rear mud room. Second story features 4 large private rooms, and a bathroom. Large unfinished basement accessible from inside the house.
Key facts
- Great location
- Historic building
- 6,970 sq ft lot
Tags
Property features AI
Exterior
- Parking: No parking listed
- Utilities: Public water; Public sewer
- Home design: Single-family residence; Two-story
- Construction: Wood siding exterior
- Exterior features: Shingle roof; Lot dimensions approximately 59 x 127 x 57 x 127; Lot size about 0.16 acres
Interior
- Flooring: Wood
- Bathrooms: Two full bathrooms
- Heating & cooling: No central heating listed; No cooling listed
- Interior features: Wood flooring throughout; Has one fireplace; Finished basement
Neighborhood map
What this means for you Summary
Snapshot
- This is a 5-bed/1.5-bath single-family listed at $30k.
Deal economics
- At list price, monthly cash flow is $894 ($11k/yr) — positive.
- The deal already cash-flows at list — no discount required.
- Meets the 1% rule at list price ($1k rent vs $30k).
- Recommended offer: $29k (3.0% below list) — sets the bar for market timing.
- Cap rate 42.7% vs local median 6.0% in Burlington — top-decile yield for the area; either an underpriced asset or a hidden risk that comps aren't pricing in. Stress-test before assuming the spread holds.
Location & tenants
- Location reads 73/100 on livability (#287 in IA) — a middle-class / working-renter tenant base. Strengths: cost of living A+, housing A+, health & safety A+; Watch: crime D+, employment D, amenities F.
- Burlington Community School District (town): math 42% / reading 54% proficiency, ranked #286 of 289 in IA (top 99%) — families likely to look elsewhere, expect single-tenant / working-renter base with shorter leases.
- Market conditions: 184 active listings in the ZIP; 53 units permitted in Des Moines County in 2024 (40 in 5+ unit buildings).
Forward outlook
- Local home prices are declining (-3.0%/yr); year-one equity from $204 of loan paydown is wiped out by about $885 of value loss. Plan a longer hold.
- Des Moines County population projected to shrink 6% by 2050 — rents likely to lag national; underwrite the cash flow, not the appreciation.
- At projected returns (-3.0% appreciation + 3.0% rent growth), your $8k cash investment doubles in ~1 year — after that, you're playing with house money.
Negotiation context
- It's been on market 33 days — a 3% lower offer ($29k) is reasonable based on typical stale-listing flexibility.
Risks & watch-outs
- Watch-outs: property tax is 3.6% of price; built in 1859 — expect roof / HVAC / electrical / plumbing capex.
Questions for the listing agent
- It's been on market 33 days. Have you received any prior offers? Is the seller open to a 3% concession, seller financing, or rate buy-down credit?
- Built in 1859 — when were the roof, HVAC, electrical panel, plumbing, and water heater last replaced?
- Property tax is high relative to price — has the assessment been appealed recently, and will the sale trigger a re-assessment?
- Is there a deadline driving the sale (1031 exchange, divorce, estate, relocation)? That informs how much negotiation room exists.
- Crime grade is D in this area — have there been break-ins, vandalism, or insurance claims at this property in the last 3 years? What carrier currently insures it and at what premium?
- The area grade is low — what's the realistic commute time and amenity access for the typical tenant pool here? Any planned neighborhood developments (good or bad) we should know about?
- What's the average days-on-market for RENTAL listings here right now (not sales)? A rising rental-DOM trend means longer vacancies and softer asking-rent achievability than the comps imply.
- What's the recent tenant-quality profile in this submarket — average credit score on applications, eviction rate, late-payment / NSF rate, and stable-employment percentage? A property-management company in the area should have these aggregated.
- How much new for-sale + rental construction is in the pipeline within 1–3 miles? Heavy new supply typically softens prices + rents 12–24 months out; constrained supply supports both.
Investment metrics
- 1% rule
- 4.94% ✓
- Cap rate
- 42.66%
- Cash-on-cash
- 129.88%
- DSCR
- 6.78
- GRM
- 1.7
CMA / ARV
- ARV (on-the-fly)
- $71,544
- Comps found
- 8
Show comp detail 8 sales within ~0.75 mi
| Address | Dist | Beds/Ba | Sqft | Sold | Price | $/sf | Match |
|---|---|---|---|---|---|---|---|
| 205 Marietta St | 0.38mi | 4/3.0 (-1) | 3,172 (-2%) | 1mo | $159,000 | $50 | 66 |
| 401 Cedar St | 0.58mi | 4/1.5 (-1) | 3,280 (+1%) | 9mo | $225,000 | $69 | 59 |
| 537 Summer St | 0.61mi | 5/2.0 | 3,580 (+10%) | 1mo | $19,000 | $5 | 52 |
| 548 S 10th St | 0.49mi | 5/2.5 | 3,016 (-7%) | 14mo | $97,500 | $32 | 50 |
| 1228 Smith St | 0.41mi | 4/1.5 (-1) | 2,964 (-9%) | 14mo | $64,900 | $22 | 49 |
| 717 S 4th St | 0.55mi | 5/2.0 | 3,076 (-5%) | 19mo | $4,000 | $1 | 48 |
| 800 Cedar St | 0.61mi | 5/1.5 | 2,916 (-10%) | 20mo | $60,000 | $21 | 38 |
| 603 S 12th St | 0.63mi | 5/2.0 | 2,780 (-14%) | 10mo | $60,000 | $22 | 36 |
Match score weights: distance 35% · size 25% · config 20% · recency 20%. Top-matched comps best support the ARV.
Projected returns pro-forma
-3.0% appreciation · 3.0% rent growth · sell at horizon
- IRR
- —
- Equity multiple
- 7.32×
- Total profit
- $52,213
- Equity at exit
- $4,399
- IRR
- —
- Equity multiple
- 15.41×
- Total profit
- $119,004
- Equity at exit
- $2,551
Cash invested: $8,260 (down + closing). Projections, not guarantees.
Landlord ↔ Tenant lean methodology
- Overall (STATE)
- 83 Strongly Landlord-Friendly
- State Iowa
- 83 Strongly Landlord-Friendly · R+6
- County
- — inherits STATE
- City
- — inherits STATE
ZIP-level market 52601
- Active inventory
- 184
- Price-to-rent
- 1.7×
Monthly cashflow live
- Estimated rent
- $1,456 medium interval (Pro) →
- Mortgage (P&I)
- −$155
- Tax from tax record
- −$89 /mo · $1,072/yr
- Insurance
- −$12
- HOA
- −$0
- Vacancy / Maint / Mgmt
- −$306
- Net cashflow
- $894
Break-even live
UW: 25.0% down · 7.5% · 30yr · 1.5% tax · 5.0% vac · 8.0% maint · 8.0% mgmt
Financing live
Cash to close
- Down payment
- $7,375
- Closing costs
- $885
- Reserves months
- —
- Total cash needed
- —
Loan-product check · same deal, 3 products live
Conventional
25% down · 7.5% · 30yr
- Down + closing
- —
- Monthly P&I
- —
- Monthly cashflow
- —
- DSCR
- —
- Eligible?
- —
Personal DTI + credit; lowest rate.
DSCR
20% down · 8.5% · 30yr
- Down + closing
- —
- Monthly P&I
- —
- Monthly cashflow
- —
- DSCR
- —
- Eligible?
- —
No personal income docs; deal must DSCR.
Hard money
10% down · 12.0% · 12mo
- Down + closing
- —
- Monthly P&I
- —
- Monthly cashflow
- —
- DSCR
- —
- Eligible?
- —
Short-term bridge; refi at stabilization.
Listing history 19 events
-
2026-06-19days on market $29,500 Active 33 DOM
-
2026-06-18days on market $29,500 Active 32 DOM
-
2026-06-17days on market $29,500 Active 31 DOM
-
2026-06-17price $29,500 Active 30 DOM
-
2026-06-16days on market $31,500 Active 30 DOM
-
2026-06-15days on market $31,500 Active 29 DOM
-
2026-06-14days on market $31,500 Active 27 DOM
-
2026-06-12days on market $31,500 Active 26 DOM
-
2026-06-09days on market $31,500 Active 23 DOM
-
2026-06-09price $31,500 Active 22 DOM
-
2026-06-08days on market $33,500 Active 22 DOM
-
2026-06-07days on market $33,500 Active 21 DOM
-
2026-06-07days on market $33,500 Active 20 DOM
-
2026-06-03days on market $33,500 Active 17 DOM
-
2026-06-02days on market $33,500 Active 16 DOM
-
2026-06-01days on market $33,500 Active 15 DOM
-
2026-05-31days on market $33,500 Active 14 DOM
-
2026-05-30days on market $33,500 Active 13 DOM
-
2026-05-17$33,500 Active
ⓘ Source: listings_history table (triggers on properties + properties_extension) + one-shot
backfill from property_details.listing_events for pre-trigger history.
Tax reassessment forecast IA · Partial reset (capped growth)
- Current annual tax
- $1,072 · $89/mo
- Projected year-2 tax
- $1,072 · $89/mo
- Expected delta
- $0/yr ($0/mo · 0.0%)
ⓘ Screening estimate from a state-policy table — verify with the county assessor before closing.
Climate risk First Street
- Flood 1/10 Low FEMA zone X (unshaded) · 0% chance over 30 yrs
- Wildfire 1/10 Low
- Heat 3/10 Moderate 7 d/yr ≥106°F today · 16 d/yr by 30 yrs out
- Wind 2/10 Low
- Air quality 2/10 Low 0 unhealthy d/yr today · 1 by 30 yrs out
Nearby sold comps map
Loading sold comps map…
Walkable amenities ~0.75 mi
Loading nearby amenities…
Taxation est. · year 1
- Rental income
- $17,473
- − Mortgage interest
- −$1,652
- − Property taxes
- −$1,072
- − Insurance
- −$148
- − Repairs & maintenance
- −$1,398
- − Management
- −$1,398
- − Depreciation
- −$858
- Taxable income
- $10,947
- Est. tax owed @ 24.0%
- −$2,627
- After-tax cash flow
- $8,101/yr
For passive investors: Depreciation is non-cash, so a rental often shows a tax loss while cash-flowing — sheltering income. Rental losses are passive: they offset passive income freely, and up to $25,000/yr can offset ordinary (W-2) income if you actively participate and your MAGI is under $100k (phasing out to $0 by $150k); unused losses carry forward. On sale, claimed depreciation is recaptured at up to 25%, and gains may owe capital-gains tax (a 1031 exchange can defer both). Figures are a year-1 estimate at your 24.0% rate — not tax advice; consult a CPA.
Schools (NCES district)
- District
- Burlington Community School District
- NCES district ID
- 1905790
- Math proficiency
- 42% ▼ -4.00%
- Reading proficiency
- 54% ▼ -1.00%
- Median HH income
- $41,833
- Composite
- 40.3/100
- National rank
- #3753
- State rank
- #286 of 289 in IA
Livability — Burlington
- Score
- 73/100
- State rank
- #287
- US rank
- #5540
Category grades
Schools grade is shown separately in the Schools card above.
Census & demographics
- Census place
- Burlington, IA
- County
- Des Moines County · 27,341 people
- City population
- 27,341
- Metro
- Burlington, IA-IL
- Population (ZIP)
- 27,341
- Household income
- $60,983
- Rent vs Own
- Severe rent burden
- 963.0
Population outlook (Des Moines County) Hauer SSP2
- Today (2025)
- 39,735 people
- By 2030
- 39,257 · -1.2%
- By 2040
- 38,090 · -4.1%
- By 2050
- 37,156 · -6.5%
- By 2075
- 36,905 · -7.1%
- By 2100
- 37,222 · -6.3%
Race, ethnicity, and origin ACS 2023
- Neighborhood character
- Predominantly White (83%)
- Race & ethnicity
- White 83% Two or more races 8% Black 5% Hispanic / Latino 4% Asian 1%
- Common ancestry
- Iranian 2% Lithuanian 2% Slovak 2%
- Foreign-born
- 3% · Canada
- Languages at home
- 95% English-only · Spanish 3% Other Asian/Pacific 1%
Political lean MEDSL · Des Moines
- 2024 margin
- R (+15.1) · D 41.8% · R 56.8% · Other 1.4%
- 2008→2024 swing
- -38.1pp toward R · 2008: 23.0pp · 2024: -15.1pp
- All cycles
- 2024: R+15.1 2020: R+8.5 2016: R+7.0 2012: D+18.5 2008: D+23.0
Not yet ingested
- Civics
- —
Market trends
- HPI YoY
- ▼ -83.48%
- Current HPI
- 149.7662
- Rent YoY
- —
- Metro
- Burlington, IA-IL
- State GDP YoY
- ▲ 2.48%
- F500 in state
- 4
Industry mix (Fortune 500 HQ in IA)
| Industry | F500 HQs | Revenue |
|---|---|---|
| Financial Services | 1 | $16B |
|
||
| Retail / Convenience | 1 | $15B |
|
||
Price history
1 event — show timeline
- 2026-05-17 Listed $33,500 IAR
Property tax history
+3.1%/yrLatest (2025): $1,072 · +15.0% YoY. Source: county tax records.
Cash-flow waterfall
monthlySold comps — $/sqft
last 12 mo · ≤1 miLoading sold comps…