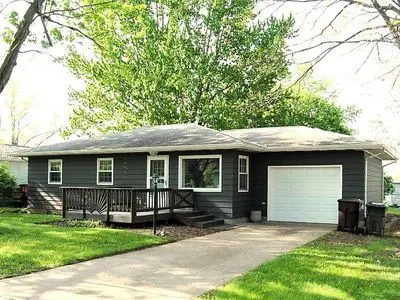
213 E Elm St · Bluffton, OH
Flood risk 1/10 · Minimal
- FEMA flood zone
- X (unshaded)
- Chance of flooding over 30 yrs
- 0.0%
- Est. flood insurance / yr
- $473 – $860
Fire risk 1/10 · Minimal
- Est. fire insurance / yr
- $713 – $1,323
Heat risk 3/10 · Minor
- Hot days now (above 99°F)
- 7 days/yr
- Hot days in 30 yrs
- 17 days/yr
Wind risk 2/10 · Minimal
- Chance of severe wind over 30 yrs
- —
Air-quality risk 2/10 · Minimal
- Unhealthy air days now
- 1 days/yr
- Unhealthy air days in 30 yrs
- 2 days/yr
Risk factors via First Street. Map © Google.
Why this score? — see what drove the D+ grade
The composite is a weighted blend of 9 inputs, each scored 0–100. Each bar is that input's sub-score; the figure is the points it added to the 100-point composite (weight × sub-score).
- Cash flow +17.9/30.0
- Schools +6.7/10.0
- ARV discount +6.0/15.0
- DSCR +5.6/10.0
- Livability +4.5/5.0
- 1% rule +4.0/10.0
- Rent growth +2.5/5.0
- Condition / age +2.5/5.0
- Appreciation +0.0/10.0
$178,000
🖨 Deal sheet (PDF) 📄 Offer letter ✓ Due diligence
Listing remarks MLS
Nice 3 bedroom ranch home with large back yard. Nice deck out front, perfect place to sit and relax!, Under 1 Acre
Key facts
- New appliances
- Central air
- Dehumidifier
Tags
Neighborhood map
What this means for you Summary
Snapshot
- This is a 3-bed/1.0-bath single-family listed at $178k.
Deal economics
- At list price, monthly cash flow is $151 ($2k/yr) — positive.
- The deal already cash-flows at list — no discount required.
- To meet the 1% rule (rent ≥ 1% of price), the offer needs to be $160k (10.2% below list).
- Recommended offer: $160k (10.2% below list) — sets the bar for 1% rule.
Location & tenants
- Location reads 91/100 on livability (#7 in OH, #68 nationally) — a professional / high-income tenant draw. Strengths: schools A+, amenities A+, cost of living A+; Watch: commute F.
- Bluffton Exempted Village (town): math 79% / reading 77% proficiency, ranked #63 of 656 in OH (top 10%) — strong family-tenant draw, lease renewals of 3-5y typical.
- Market conditions: 23 active listings in the ZIP; solid renter incomes; 88 units permitted in Allen County in 2024 (0 in 5+ unit buildings).
Forward outlook
- Local home prices are declining (-3.0%/yr); year-one equity from $1k of loan paydown is wiped out by about $5k of value loss. Plan a longer hold.
- Allen County population projected at -14% by 2050 — secular population decline; favor cash flow + early exit over multi-decade hold.
Negotiation context
- It's been on market 39 days — a 3% lower offer ($173k) is reasonable based on typical stale-listing flexibility.
- 4 sale attempts since 13y ago with the ask held roughly flat each time — persistent listings suggest the price (not the market) is what's stuck; bring a comps-based counter.
- Current owner paid $120k; 48% above their basis — modest negotiation headroom, anchor on the comps not their cost.
Questions for the listing agent
- It's been on market 39 days. Have you received any prior offers? Is the seller open to a 10% concession, seller financing, or rate buy-down credit?
- Built in 1973 — when were the roof, HVAC, electrical panel, plumbing, and water heater last replaced?
- Is there a deadline driving the sale (1031 exchange, divorce, estate, relocation)? That informs how much negotiation room exists.
- Schools are A-rated — typically a magnet for longer-tenancy family renters. What's the average tenant stay here, and is there a school-zone premium baked into asking?
- The area grade is low — what's the realistic commute time and amenity access for the typical tenant pool here? Any planned neighborhood developments (good or bad) we should know about?
- What's the average days-on-market for RENTAL listings here right now (not sales)? A rising rental-DOM trend means longer vacancies and softer asking-rent achievability than the comps imply.
- What's the recent tenant-quality profile in this submarket — average credit score on applications, eviction rate, late-payment / NSF rate, and stable-employment percentage? A property-management company in the area should have these aggregated.
- How much new for-sale + rental construction is in the pipeline within 1–3 miles? Heavy new supply typically softens prices + rents 12–24 months out; constrained supply supports both.
Investment metrics
- 1% rule
- 0.90% ✗
- Cap rate
- 7.31%
- Cash-on-cash
- 3.64%
- DSCR
- 1.16
- GRM
- 9.3
CMA / ARV
- ARV (on-the-fly)
- $172,224
- Comps found
- 6
Show comp detail 6 sales within ~0.75 mi
| Address | Dist | Beds/Ba | Sqft | Sold | Price | $/sf | Match |
|---|---|---|---|---|---|---|---|
| 227 E Elm St | 0.06mi | 3/1.0 | 875 (-6%) | 21mo | $180,000 | $206 | 69 |
| 150 Geiger St | 0.35mi | 2/1.0 (-1) | 1,002 (+7%) | 1mo | $174,000 | $174 | 66 |
| 180 Huber St | 0.13mi | 2/1.0 (-1) | 1,014 (+8%) | 11mo | $110,000 | $108 | 66 |
| 307 S Main St Unit back | 0.61mi | 2/1.0 (-1) | 952 (+2%) | 1mo | $174,900 | $184 | 62 |
| 165 Thurman St | 0.38mi | 2/1.0 (-1) | 850 (-9%) | 1mo | $182,000 | $214 | 61 |
| 131 N Spring St | 0.68mi | 2/1.0 (-1) | 936 (0%) | 13mo | $165,000 | $176 | 52 |
Match score weights: distance 35% · size 25% · config 20% · recency 20%. Top-matched comps best support the ARV.
Projected returns pro-forma
-3.0% appreciation · 3.0% rent growth · sell at horizon
- IRR
- -10.6%
- Equity multiple
- 0.61×
- Total profit
- $-19,266
- Equity at exit
- $26,540
- IRR
- -1.3%
- Equity multiple
- 0.91×
- Total profit
- $-4,579
- Equity at exit
- $15,390
Cash invested: $49,840 (down + closing). Projections, not guarantees.
Landlord ↔ Tenant lean methodology
- Overall (STATE)
- 73 Landlord-Friendly
- State Ohio
- 73 Landlord-Friendly · R+6
- County
- — inherits STATE
- City
- — inherits STATE
ZIP-level market 45817
- Home prices YoY
- -33.5%
- Active inventory
- 23
- Price-to-rent
- 9.3×
Monthly cashflow live
- Estimated rent
- $1,598 medium interval (Pro) →
- Mortgage (P&I)
- −$933
- Tax from tax record
- −$103 /mo · $1,240/yr
- Insurance
- −$74
- HOA
- −$0
- Vacancy / Maint / Mgmt
- −$336
- Net cashflow
- $151
Break-even live
Sensitivity live
| Price | -10% $252 | -5% $202 | +0% $151 | +5% $101 | +10% $50 |
|---|---|---|---|---|---|
| Rent | -10% $25 | -5% $88 | +0% $151 | +5% $214 | +10% $277 |
| Rate | -1.0pp $241 | -0.5pp $196 | base $151 | +0.5pp $105 | +1.0pp $58 |
UW: 25.0% down · 7.5% · 30yr · 1.5% tax · 5.0% vac · 8.0% maint · 8.0% mgmt
Financing live
Cash to close
- Down payment
- $44,500
- Closing costs
- $5,340
- Reserves months
- —
- Total cash needed
- —
Loan-product check · same deal, 3 products live
Conventional
25% down · 7.5% · 30yr
- Down + closing
- —
- Monthly P&I
- —
- Monthly cashflow
- —
- DSCR
- —
- Eligible?
- —
Personal DTI + credit; lowest rate.
DSCR
20% down · 8.5% · 30yr
- Down + closing
- —
- Monthly P&I
- —
- Monthly cashflow
- —
- DSCR
- —
- Eligible?
- —
No personal income docs; deal must DSCR.
Hard money
10% down · 12.0% · 12mo
- Down + closing
- —
- Monthly P&I
- —
- Monthly cashflow
- —
- DSCR
- —
- Eligible?
- —
Short-term bridge; refi at stabilization.
Listing history 27 events
-
2026-06-19days on market $178,000 Active 39 DOM
-
2026-06-18days on market $178,000 Active 38 DOM
-
2026-06-17days on market $178,000 Active 37 DOM
-
2026-06-16days on market $178,000 Active 36 DOM
-
2026-06-15days on market $178,000 Active 35 DOM
-
2026-06-14days on market $178,000 Active 33 DOM
-
2026-06-12days on market $178,000 Active 32 DOM
-
2026-06-09days on market $178,000 Active 29 DOM
-
2026-06-08days on market $178,000 Active 28 DOM
-
2026-06-07days on market $178,000 Active 27 DOM
-
2026-06-07days on market $178,000 Active 26 DOM
-
2026-06-04days on market $178,000 Active 23 DOM
-
2026-06-02days on market $178,000 Active 22 DOM
-
2026-06-01days on market $178,000 Active 21 DOM
-
2026-05-31days on market $178,000 Active 20 DOM
-
2026-05-31days on market $178,000 Active 19 DOM
-
2026-05-12$178,000 Active 388-char remark
-
2022-07-22soldstatus $120,000
-
2022-07-15soldstatus $120,000 114-char remark
Show marketing remark (114 chars)
Nice 3 bedroom ranch home with large back yard. Nice deck out front, perfect place to sit and relax!, Under 1 Acre
-
2022-06-10$120,000 114-char remark
Show marketing remark (114 chars)
Nice 3 bedroom ranch home with large back yard. Nice deck out front, perfect place to sit and relax!, Under 1 Acre
-
2013-09-30historical
-
2013-09-30historical
-
2013-02-25$87,500
-
2013-02-25$87,500
-
2006-09-28soldstatus $85,000
-
2005-09-22soldstatus $70,000
-
1997-08-05soldstatus $72,500
ⓘ Source: listings_history table (triggers on properties + properties_extension) + one-shot
backfill from property_details.listing_events for pre-trigger history.
Tax reassessment forecast OH · Partial reset (capped growth)
- Current annual tax
- $1,240 · $103/mo
- Projected year-2 tax
- $2,009 · $167/mo
- Expected delta
- +$768/yr (+$64/mo · 61.9%)
ⓘ Screening estimate from a state-policy table — verify with the county assessor before closing.
Climate risk First Street
- Flood 1/10 Low FEMA zone X (unshaded) · 0% chance over 30 yrs
- Wildfire 1/10 Low
- Heat 3/10 Moderate 7 d/yr ≥99°F today · 17 d/yr by 30 yrs out
- Wind 2/10 Low
- Air quality 2/10 Low 1 unhealthy d/yr today · 2 by 30 yrs out
Nearby sold comps map
Loading sold comps map…
Walkable amenities ~0.75 mi
Loading nearby amenities…
Taxation est. · year 1
- Rental income
- $19,172
- − Mortgage interest
- −$9,971
- − Property taxes
- −$1,240
- − Insurance
- −$890
- − Repairs & maintenance
- −$1,534
- − Management
- −$1,534
- − Depreciation
- −$5,178
- Taxable loss
- −$1,175
- Est. tax savings @ 24.0%
- +$282
- After-tax cash flow
- $2,096/yr
For passive investors: Depreciation is non-cash, so a rental often shows a tax loss while cash-flowing — sheltering income. Rental losses are passive: they offset passive income freely, and up to $25,000/yr can offset ordinary (W-2) income if you actively participate and your MAGI is under $100k (phasing out to $0 by $150k); unused losses carry forward. On sale, claimed depreciation is recaptured at up to 25%, and gains may owe capital-gains tax (a 1031 exchange can defer both). Figures are a year-1 estimate at your 24.0% rate — not tax advice; consult a CPA.
Schools (NCES district)
- District
- Bluffton Exempted Village
- NCES district ID
- 3904521
- Math proficiency
- 79% ▼ -8.00%
- Reading proficiency
- 77% ▼ -6.00%
- Median HH income
- $59,825
- Composite
- 66.95/100
- National rank
- #398
- State rank
- #63 of 656 in OH
Livability — Bluffton
- Score
- 91/100
- State rank
- #7
- US rank
- #68
Category grades
Schools grade is shown separately in the Schools card above.
Census & demographics
- Census place
- Bluffton, OH
- County
- Allen · 98,169 people
- Metro
- Lima, OH
- Population (ZIP)
- 5,820
- Household income
- $82,784
- Rent vs Own
Population outlook (Allen County) Hauer SSP2
- Today (2025)
- 100,321 people
- By 2030
- 97,693 · -2.6%
- By 2040
- 91,802 · -8.5%
- By 2050
- 86,152 · -14.1%
- By 2075
- 73,659 · -26.6%
- By 2100
- 58,716 · -41.5%
Race, ethnicity, and origin ACS 2023
- Neighborhood character
- Predominantly White (92%)
- Race & ethnicity
- White 92% Two or more races 3% Asian 2% Black 2% Hispanic / Latino 1%
- Common ancestry
- Romanian 3% Slovak 3% Lithuanian 2%
- Foreign-born
- 3% · Canada
- Languages at home
- 97% English-only · Spanish 1% Other Indo-European 1%
Political lean MEDSL · Allen
- 2024 margin
- Solid R (+44.1) · D 27.5% · R 71.6%
- 2008→2024 swing
- -23.4pp toward R · 2008: -20.7pp · 2024: -44.1pp
- All cycles
- 2024: R+44.1 2020: R+39.5 2016: R+38.2 2012: R+25.7 2008: R+20.7
Not yet ingested
- Civics
- —
Market trends
- HPI YoY
- ▼ -104.21%
- Current HPI
- 206.5891
- Rent YoY
- —
- Metro
- —
- State GDP YoY
- ▲ 1.98%
- F500 in state
- 48
Industry mix (Fortune 500 HQ in OH)
| Industry | F500 HQs | Revenue |
|---|---|---|
| Insurance | 3 | $145B |
|
||
| Industrial Machinery | 3 | $49B |
|
||
| Financial Services | 3 | $24B |
|
||
| Consumer Goods | 2 | $93B |
|
||
| Aerospace / Defense | 2 | $47B |
|
||
| Utilities | 2 | $33B |
|
||
Price history
+145.5% since first listed11 events — show timeline
- 2026-05-12 Listed $178,000 FSBO.com
- 2022-07-22 Sold (Public Records) $120,000 Public Records
- 2022-07-15 Sold (MLS) $120,000 WCARE
- 2022-06-10 Listed $120,000 WCARE
- 2013-09-30 Listing Removed — NORIS
- 2013-09-30 Listing Removed — NORIS
- 2013-02-25 Listed $87,500 NORIS
- 2013-02-25 Listed $87,500 NORIS
- 2006-09-28 Sold (Public Records) $85,000 Public Records
- 2005-09-22 Sold (Public Records) $70,000 Public Records
- 1997-08-05 Sold (Public Records) $72,500 Public Records
Property tax history
+1.2%/yrLatest (2025): $1,240 · +0.0% YoY. Source: county tax records.
Cash-flow waterfall
monthlySold comps — $/sqft
last 12 mo · ≤1 miLoading sold comps…