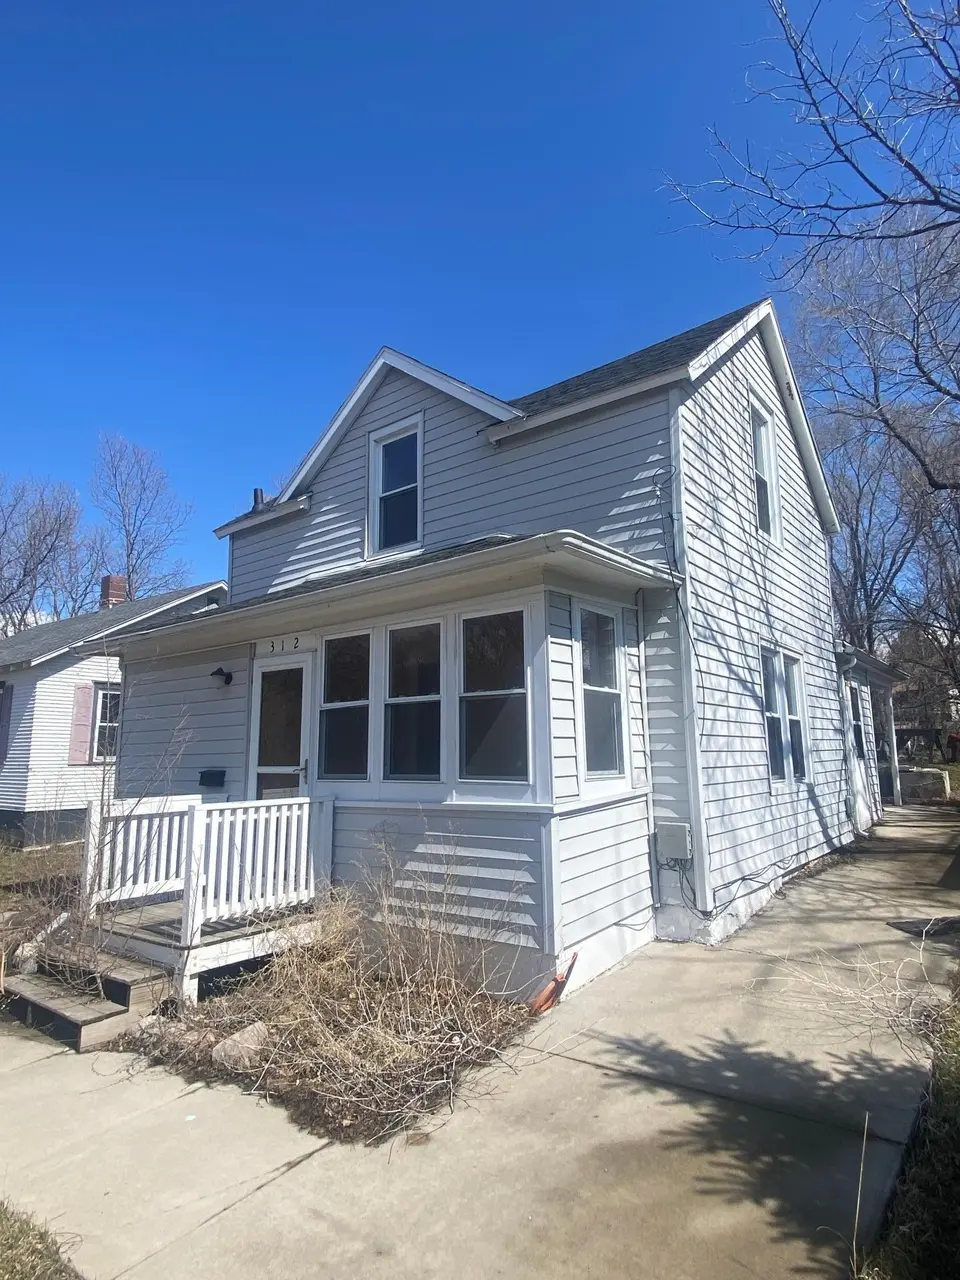
312 5th St NW · Ortonville, MN
Flood risk 1/10 · Minimal
- FEMA flood zone
- X (unshaded)
- Chance of flooding over 30 yrs
- 0.0%
- Est. flood insurance / yr
- $473 – $860
Fire risk 5/10 · Moderate
- Est. fire insurance / yr
- $888 – $1,650
Heat risk 2/10 · Minimal
- Hot days now (above 99°F)
- 7 days/yr
- Hot days in 30 yrs
- 13 days/yr
Wind risk 2/10 · Minimal
- Chance of severe wind over 30 yrs
- —
Air-quality risk 3/10 · Minor
- Unhealthy air days now
- 3 days/yr
- Unhealthy air days in 30 yrs
- 3 days/yr
Risk factors via First Street. Map © Google.
Why this score? — see what drove the D+ grade
The composite is a weighted blend of 9 inputs, each scored 0–100. Each bar is that input's sub-score; the figure is the points it added to the 100-point composite (weight × sub-score).
- ARV discount +13.4/15.0
- Cash flow +12.7/30.0
- Schools +5.0/10.0
- 1% rule +4.1/10.0
- DSCR +3.8/10.0
- Livability +3.6/5.0
- Rent growth +2.5/5.0
- Condition / age +2.5/5.0
- Appreciation +0.0/10.0
$85,000
🖨 Deal sheet 📄 Offer letter ✓ Due diligence
Listing remarks
This home is just one block from downtown Ortonville and several scenic city parks! The main floor welcomes you with a spacious kitchen perfect for entertaining, a bright dining room, and a convenient entryway with laundry. Retreat to the main-floor bedroom featuring a walk-in closet and a private en-suite bath for your own personal haven. Upstairs, you'll find two more cozy bedrooms and a full bath—ideal for family, guests, or a home office setup. This home is the perfect blend of comfort, location, and small-town charm!
Key facts
- Main-floor bedroom
- Walk-in closet
- Spacious kitchen
Tags
Neighborhood map
What this means for you Summary
Snapshot
- This is a 1-bed/1.0-bath single-family listed at $85k.
Deal economics
- At list price, monthly cash flow is $-10 ($-121/yr) — negative.
- To cash-flow at today's rent, offer at most $83k (2.1% below list).
- To meet the 1% rule (rent ≥ 1% of price), the offer needs to be $78k (8.8% below list).
- Recommended offer: $78k (8.8% below list) — sets the bar for 1% rule.
Location & tenants
- Location reads 72/100 on livability (#278 in MN) — a middle-class / working-renter tenant base. Strengths: crime A+, cost of living A+, housing A+; Watch: employment C-, amenities F, commute F.
- Market conditions: 16 active listings in the ZIP; 1 comparable units currently listed for rent nearby; 3 units permitted in Big Stone County in 2024 (0 in 5+ unit buildings).
Forward outlook
- Local home prices are declining (-3.0%/yr); year-one equity from $588 of loan paydown is wiped out by about $3k of value loss. Plan a longer hold.
- Big Stone County population projected at -23% by 2050 — secular population decline; favor cash flow + early exit over multi-decade hold.
Negotiation context
- It's been on market 50 days — a 3% lower offer ($82k) is reasonable based on typical stale-listing flexibility.
- 5 sale attempts since 15y ago with the ask held roughly flat each time — persistent listings suggest the price (not the market) is what's stuck; bring a comps-based counter.
Risks & watch-outs
- Watch-outs: built in 1900 — expect roof / HVAC / electrical / plumbing capex.
- Climate carrying-cost: moderate wildfire risk — expect insurance premiums to compound above CPI over the hold.
Questions for the listing agent
- What do current leases actually rent for vs. the listed asking? Can we see a recent rent roll and the last 12 months of T-12 income?
- It's been on market 50 days. Have you received any prior offers? Is the seller open to a 9% concession, seller financing, or rate buy-down credit?
- Built in 1900 — when were the roof, HVAC, electrical panel, plumbing, and water heater last replaced?
- Is there a deadline driving the sale (1031 exchange, divorce, estate, relocation)? That informs how much negotiation room exists.
- Schools are B-rated — typically a magnet for longer-tenancy family renters. What's the average tenant stay here, and is there a school-zone premium baked into asking?
- The area grade is low — what's the realistic commute time and amenity access for the typical tenant pool here? Any planned neighborhood developments (good or bad) we should know about?
- What's the average days-on-market for RENTAL listings here right now (not sales)? A rising rental-DOM trend means longer vacancies and softer asking-rent achievability than the comps imply.
- What's the recent tenant-quality profile in this submarket — average credit score on applications, eviction rate, late-payment / NSF rate, and stable-employment percentage? A property-management company in the area should have these aggregated.
- How much new for-sale + rental construction is in the pipeline within 1–3 miles? Heavy new supply typically softens prices + rents 12–24 months out; constrained supply supports both.
Investment metrics
- 1% rule
- 0.91% ✗
- Cap rate
- 6.15%
- Cash-on-cash
- -0.51%
- DSCR
- 0.98
- GRM
- 9.1
CMA / ARV
- ARV (median comp)
- $97,843
- List price
- $85,000
- Delta
- -13.13%
- Verdict
- UNDERPRICED
- Comps
- 4 within 2.0 mi
Projected returns pro-forma
-3.0% appreciation · 3.0% rent growth · sell at horizon
- IRR
- -17.1%
- Equity multiple
- 0.40×
- Total profit
- $-14,383
- Equity at exit
- $12,674
- IRR
- -8.9%
- Equity multiple
- 0.44×
- Total profit
- $-13,216
- Equity at exit
- $7,349
Cash invested: $23,800 (down + closing). Projections, not guarantees.
Landlord ↔ Tenant lean methodology
- Overall (STATE)
- 46 Balanced
- State Minnesota
- 46 Balanced · D+2
- County
- — inherits STATE
- City
- — inherits STATE
ZIP-level market 56278
- Home prices YoY
- -17.4%
- Active inventory
- 16
- Price-to-rent
- 9.1×
Monthly cashflow live
- Estimated rent
- $775 medium interval (Pro) →
- Mortgage (P&I)
- −$446
- Tax from tax record
- −$141 /mo · $1,694/yr
- Insurance
- −$35
- HOA
- −$0
- Vacancy / Maint / Mgmt
- −$163
- Net cashflow
- $-10
Break-even live
UW: 25.0% down · 7.5% · 30yr · 1.5% tax · 5.0% vac · 8.0% maint · 8.0% mgmt
Financing live
Cash to close
- Down payment
- $21,250
- Closing costs
- $2,550
- Reserves months
- —
- Total cash needed
- —
Loan-product check · same deal, 3 products live
Conventional
25% down · 7.5% · 30yr
- Down + closing
- —
- Monthly P&I
- —
- Monthly cashflow
- —
- DSCR
- —
- Eligible?
- —
Personal DTI + credit; lowest rate.
DSCR
20% down · 8.5% · 30yr
- Down + closing
- —
- Monthly P&I
- —
- Monthly cashflow
- —
- DSCR
- —
- Eligible?
- —
No personal income docs; deal must DSCR.
Hard money
10% down · 12.0% · 12mo
- Down + closing
- —
- Monthly P&I
- —
- Monthly cashflow
- —
- DSCR
- —
- Eligible?
- —
Short-term bridge; refi at stabilization.
Rent comps 1 comps
| Address | Beds | Baths | Sqft | Rent | $/sqft | DOM | Units | Dist |
|---|---|---|---|---|---|---|---|---|
| 611 Lake Ave Apt 8 Ortonville, MN | 2.0 | 1.0 | 650 | $775 | $1.19 | 43d | 1 | 0.16mi |
Listing history 32 events
-
2026-06-18days on market $85,000 Active 50 DOM
-
2026-06-17days on market $85,000 Active 49 DOM
-
2026-06-16days on market $85,000 Active 48 DOM
-
2026-06-15days on market $85,000 Active 47 DOM
-
2026-06-13days on market $85,000 Active 45 DOM
-
2026-06-12days on market $85,000 Active 44 DOM
-
2026-06-09days on market $85,000 Active 41 DOM
-
2026-06-08days on market $85,000 Active 40 DOM
-
2026-06-07days on market $85,000 Active 39 DOM
-
2026-06-05days on market $85,000 Active 37 DOM
-
2026-06-04days on market $85,000 Active 35 DOM
-
2026-06-02days on market $85,000 Active 34 DOM
-
2026-06-01days on market $85,000 Active 33 DOM
-
2026-05-31days on market $85,000 Active 32 DOM
-
2026-05-31days on market $85,000 Active 31 DOM
-
2026-02-01historical
-
2025-07-28$89,000 Active
-
2025-07-01historical
-
2024-12-02$110,000 Active
-
2022-05-09soldstatus $75,000 Sold
-
2022-05-09soldstatus $75,000
-
2022-04-27status Pending
-
2022-04-27historical Contingent - Inspection
-
2022-04-08$79,000 Active
-
2019-02-02historical
-
2013-04-03soldstatus $29,000
-
2013-04-03soldstatus $21,500
-
2013-04-03soldstatus $29,000
-
2011-01-05$35,000
-
2011-01-05$35,000
-
2004-08-04soldstatus $22,000
-
2004-08-01soldstatus $22,000
ⓘ Source: listings_history table (triggers on properties + properties_extension) + one-shot
backfill from property_details.listing_events for pre-trigger history.
Tax reassessment forecast MN · Partial reset (capped growth)
- Current annual tax
- $1,694 · $141/mo
- Projected year-2 tax
- $1,694 · $141/mo
- Expected delta
- $0/yr ($0/mo · 0.0%)
ⓘ Screening estimate from a state-policy table — verify with the county assessor before closing.
Climate risk First Street
- Flood 1/10 Low FEMA zone X (unshaded) · 0% chance over 30 yrs
- Wildfire 5/10 Major
- Heat 2/10 Low 7 d/yr ≥99°F today · 13 d/yr by 30 yrs out
- Wind 2/10 Low
- Air quality 3/10 Moderate 3 unhealthy d/yr today · 3 by 30 yrs out
Nearby sold comps map
Loading sold comps map…
Walkable amenities ~0.75 mi
Loading nearby amenities…
Taxation est. · year 1
- Rental income
- $9,300
- − Mortgage interest
- −$4,761
- − Property taxes
- −$1,694
- − Insurance
- −$425
- − Repairs & maintenance
- −$744
- − Management
- −$744
- − Depreciation
- −$2,473
- Taxable loss
- −$1,541
- Est. tax savings @ 24.0%
- +$370
- After-tax cash flow
- $249/yr
For passive investors: Depreciation is non-cash, so a rental often shows a tax loss while cash-flowing — sheltering income. Rental losses are passive: they offset passive income freely, and up to $25,000/yr can offset ordinary (W-2) income if you actively participate and your MAGI is under $100k (phasing out to $0 by $150k); unused losses carry forward. On sale, claimed depreciation is recaptured at up to 25%, and gains may owe capital-gains tax (a 1031 exchange can defer both). Figures are a year-1 estimate at your 24.0% rate — not tax advice; consult a CPA.
Schools (NCES district)
No district data.
Livability — Ortonville
- Score
- 72/100
- State rank
- #278
- US rank
- #6074
Category grades
Schools grade is shown separately in the Schools card above.
Census & demographics
- Census place
- Ortonville, MN
- Population (ZIP)
- 2,685
Population outlook (Big Stone County) Hauer SSP2
- Today (2025)
- 4,608 people
- By 2030
- 4,380 · -4.9%
- By 2040
- 3,941 · -14.5%
- By 2050
- 3,551 · -22.9%
- By 2075
- 2,917 · -36.7%
- By 2100
- 2,284 · -50.4%
Race, ethnicity, and origin ACS 2023
- Neighborhood character
- Predominantly White (96%)
- Race & ethnicity
- White 96% Two or more races 2% Hispanic / Latino 1%
- Common ancestry
- Portuguese 22% Romanian 4% Scottish 3%
- Foreign-born
- 2% · Canada
- Languages at home
- 99% English-only · Spanish 1%
Political lean MEDSL · Big Stone
- 2024 margin
- Strong R (+29.6) · D 34.2% · R 63.8% · Other 2.0%
- 2008→2024 swing
- -35.9pp toward R · 2008: 6.4pp · 2024: -29.6pp
- All cycles
- 2024: R+29.6 2020: R+27.2 2016: R+25.1 2012: R+1.4 2008: D+6.4
Not yet ingested
- Civics
- —
Market trends
- HPI YoY
- ▼ -43.28%
- Current HPI
- 205.2834
- Rent YoY
- —
- Metro
- —
- State GDP YoY
- ▲ 2.41%
- F500 in state
- 34
Industry mix (Fortune 500 HQ in MN)
| Industry | F500 HQs | Revenue |
|---|---|---|
| Healthcare | 2 | $407B |
|
||
| Retail | 2 | $150B |
|
||
| Consumer Goods | 2 | $32B |
|
||
| Industrial Machinery | 2 | $6B |
|
||
| Agriculture | 1 | $40B |
|
||
| Healthcare / Medical Devices | 1 | $32B |
|
||
Price history
+304.5% since first listed17 events — show timeline
- 2026-02-01 Listing Removed — NORTHSTARMLS as Distributed by MLS Grid
- 2025-07-28 Listed $89,000 NORTHSTARMLS as Distributed by MLS Grid
- 2025-07-01 Listing Removed — NORTHSTARMLS as Distributed by MLS Grid
- 2024-12-02 Listed $110,000 NORTHSTARMLS as Distributed by MLS Grid
- 2022-05-09 Sold (Public Records) $75,000 Public Records
- 2022-05-09 Sold (MLS) $75,000 NORTHSTARMLS as Distributed by MLS Grid
- 2022-04-27 Pending — NORTHSTARMLS as Distributed by MLS Grid
- 2022-04-27 Contingent — NORTHSTARMLS as Distributed by MLS Grid
- 2022-04-08 Listed $79,000 NORTHSTARMLS as Distributed by MLS Grid
- 2019-02-02 Listing Removed — NORTHSTARMLS as Distributed by MLS Grid
- 2013-04-03 Sold (Public Records) $21,500 Public Records
- 2013-04-03 Sold (MLS) $29,000 NORTHSTARMLS as Distributed by MLS Grid
- 2013-04-03 Sold (MLS) $29,000 NORTHSTARMLS as Distributed by MLS Grid
- 2011-01-05 Listed $35,000 NORTHSTARMLS as Distributed by MLS Grid
- 2011-01-05 Listed $35,000 NORTHSTARMLS as Distributed by MLS Grid
- 2004-08-04 Sold (Public Records) $22,000 Public Records
- 2004-08-01 Sold (Public Records) $22,000 Public Records
Property tax history
+13.7%/yrLatest (2026): $1,694 · +30.3% YoY. Source: county tax records.
Cash-flow waterfall
monthlySold comps — $/sqft
last 12 mo · ≤1 miLoading sold comps…