 Duplex
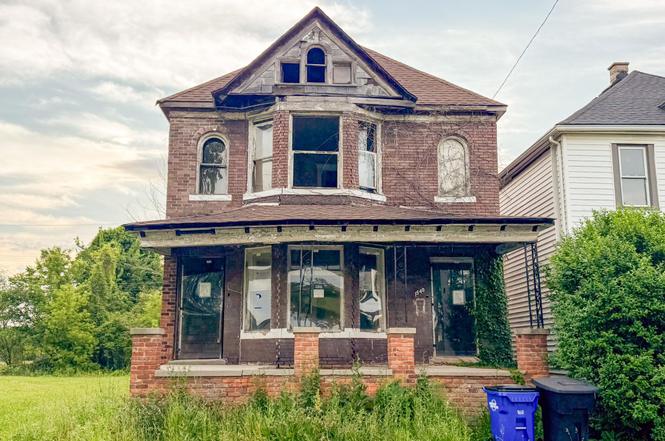
1540 Saint Clair St · Detroit, MI
Flood risk 1/10 · Minimal
- FEMA flood zone
- X (unshaded)
- Chance of flooding over 30 yrs
- 0.0%
- Est. flood insurance / yr
- $507 – $1,088
Fire risk 1/10 · Minimal
- Est. fire insurance / yr
- $784 – $1,456
Heat risk 3/10 · Minor
- Hot days now (above 96°F)
- 7 days/yr
- Hot days in 30 yrs
- 15 days/yr
Wind risk 2/10 · Minimal
- Chance of severe wind over 30 yrs
- —
Air-quality risk 3/10 · Minor
- Unhealthy air days now
- 2 days/yr
- Unhealthy air days in 30 yrs
- 5 days/yr
Risk factors via First Street. Map © Google.
Why this score? — see what drove the D+ grade
The composite is a weighted blend of 9 inputs, each scored 0–100. Each bar is that input's sub-score; the figure is the points it added to the 100-point composite (weight × sub-score).
- Cash flow +15.0/30.0
- ARV discount +15.0/15.0
- 1% rule +5.0/10.0
- DSCR +5.0/10.0
- Livability +3.7/5.0
- Rent growth +2.5/5.0
- Condition / age +2.5/5.0
- Schools +1.3/10.0
- Appreciation +0.0/10.0
$30,000
🖨 Deal sheet 📄 Offer letter ✓ Due diligence
Multi-family units
County records classify this as Multi-Family (2-4 Unit). Listing-text estimate: 2 units. confirmed
Listing remarks MLS
Rare opportunity to restore and reimagine this historic brick two-family property in Detroit's vibrant East Village neighborhood. Built in 1911, this approximately 2,382-square-foot structure offers substantial space and character for investors, developers, or owner-occupants seeking a renovation project. Located just minutes from Detroit's riverfront, the Belle Isle Park area, and the growing retail and dining destinations along Kercheval Avenue, East Village continues to attract investment and revitalization. The neighborhood features a mix of historic architecture, community development initiatives, convenient access to downtown Detroit, and proximity to major transportation corridors. Property is being sold as-is. Purchaser to verify all measurements, zoning, and development requirements. DLBA Disclosure: DLBA is entitled to a tax capture for the 5 tax years subsequent to transferring ownership of the property. The tax capture may be incompatible with tax abatements that are otherwise available to the selected purchaser. DLBA will review requests to waive its tax capture rights and may require a payment in lieu of taxes to approve such requests. The payment will be determined upon reviewing the development proforma and effect of any tax abatement on the purchase and development financing.
Key facts
- 3,049 sq ft lot
- Built 1911
Property features AI
Finance
- Other: Approximately 2,382 square feet above grade; Lot roughly 0.07 acres (30 x 101.9)
Exterior
- Utilities: Public water; Public sewer
- Home design: Two-story multi-family residential building
- Construction: Brick construction; Block foundation
- Exterior features: Paved road access; Pets allowed; Zoned for multi-family residential
Interior
- Bathrooms: 2 full bathrooms
- Heating & cooling: Forced air heating (natural gas); No central cooling
- Interior features: Full unfinished basement
Neighborhood map
What this means for you Summary
Snapshot
- This is a 2 × 2-bed/1.0-bath units multifamily listed at $30k.
Deal economics
- At list price, monthly cash flow is $2k ($23k/yr) — positive. Per door: $952/mo.
- The deal already cash-flows at list — no discount required.
- Meets the 1% rule at list price ($3k rent vs $30k).
- Cap rate 82.5% vs local median 10.2% in Detroit — top-decile yield for the area; either an underpriced asset or a hidden risk that comps aren't pricing in. Stress-test before assuming the spread holds.
Location & tenants
- Location reads 73/100 on livability (#218 in MI) — a middle-class / working-renter tenant base. Strengths: amenities A+, commute A+, cost of living A+; Watch: schools F, crime F, employment F.
- Detroit Public Schools Community District (urban): math 10% / reading 24% proficiency, ranked #499 of 540 in MI (top 92%) — low school quality limits family demand, transient renter base, plan for 1-2y turnover; 90% free/reduced lunch — lower-income household profile, screen leases tightly.
- Market conditions: 298 active listings in the ZIP; 3 comparable units currently listed for rent nearby; rentals at typical pace (median 17d on market — plan ~3-4 weeks tenant-placement turnaround); lower-income renter base — watch delinquency; 2,639 units permitted in Wayne County in 2024 (1,216 in 5+ unit buildings).
- At $2,673/mo this rent would consume 96% of the median local household income ($34k/yr) (locally 1364% of renters already pay >50% of income on rent) — very limited rent-growth headroom before tenants either downsize or default.
Forward outlook
- Local home prices are declining (-3.0%/yr); year-one equity from $207 of loan paydown is wiped out by about $900 of value loss. Plan a longer hold.
- Wayne County population projected at -17% by 2050 — secular population decline; favor cash flow + early exit over multi-decade hold.
- At projected returns (-3.0% appreciation + 3.0% rent growth), your $8k cash investment doubles in ~1 year — after that, you're playing with house money.
Negotiation context
- Only 1 days on market — expect competitive offers; lowballing is unlikely to land.
- 2 sale attempts with the ask held roughly flat each time — persistent listings suggest the price (not the market) is what's stuck; bring a comps-based counter.
Risks & watch-outs
- Watch-outs: built in 1911 — expect roof / HVAC / electrical / plumbing capex.
Questions for the listing agent
- Can we see the unit-by-unit rent roll, current vacancy, and any below-market leases? What's the average tenancy length?
- What capital expenditures (roof, boiler, parking lot, exteriors) have been made in the last 5 years, and what's planned in the next 2?
- Built in 1911 — when were the roof, HVAC, electrical panel, plumbing, and water heater last replaced?
- Is there a deadline driving the sale (1031 exchange, divorce, estate, relocation)? That informs how much negotiation room exists.
- Schools are F-rated, which usually means shorter tenancies and higher turnover. Who's the typical renter profile here, and what's been the actual vacancy rate?
- Crime grade is F in this area — have there been break-ins, vandalism, or insurance claims at this property in the last 3 years? What carrier currently insures it and at what premium?
- The area grade is low — what's the realistic commute time and amenity access for the typical tenant pool here? Any planned neighborhood developments (good or bad) we should know about?
- What's the average days-on-market for RENTAL listings here right now (not sales)? A rising rental-DOM trend means longer vacancies and softer asking-rent achievability than the comps imply.
- What's the recent tenant-quality profile in this submarket — average credit score on applications, eviction rate, late-payment / NSF rate, and stable-employment percentage? A property-management company in the area should have these aggregated.
- How much new apartment / multifamily construction is in the pipeline within 1–3 miles? Heavy new supply (>2% of stock underway) typically softens rents 12–24 months out; light construction supports rent growth.
Investment metrics
- 1% rule
- 8.91% ✓
- Cap rate
- 82.47%
- Cash-on-cash
- 272.05%
- DSCR
- 13.10
- GRM
- 0.9
CMA / ARV
- ARV (on-the-fly)
- $42,876
- Comps found
- 4
Show comp detail 4 sales within ~0.75 mi
| Address | Dist | Beds/Ba | Sqft | Sold | Price | $/sf | Match |
|---|---|---|---|---|---|---|---|
| 2257 Cadillac Blvd | 0.36mi | 4/2.5 | 2,569 (+8%) | 6mo | $45,000 | $18 | 63 |
| 3068 Bewick St | 0.59mi | 4/2.5 | 2,440 (+2%) | 7mo | $5,000 | $2 | 60 |
| 3469 Montclair St | 0.69mi | 4/2.5 | 2,169 (-9%) | 12mo | $25,000 | $12 | 41 |
| 2947 Bewick St | 0.49mi | 5/2.0 (+1) | 2,190 (-8%) | 22mo | $50,000 | $23 | 40 |
Match score weights: distance 35% · size 25% · config 20% · recency 20%. Top-matched comps best support the ARV.
Projected returns pro-forma
-3.0% appreciation · 3.0% rent growth · sell at horizon
- IRR
- —
- Equity multiple
- 14.87×
- Total profit
- $116,468
- Equity at exit
- $4,473
- IRR
- —
- Equity multiple
- 31.69×
- Total profit
- $257,761
- Equity at exit
- $2,594
Cash invested: $8,400 (down + closing). Projections, not guarantees.
Landlord ↔ Tenant lean methodology
- Overall (STATE)
- 62 Landlord-Friendly
- State Michigan
- 62 Landlord-Friendly · EVEN
- County
- — inherits STATE
- City
- — inherits STATE
ZIP-level market 48214
- Active inventory
- 298
- Price-to-rent
- 1.9×
Monthly cashflow live
- Estimated rent
- $2,673 high interval (Pro) →
- Mortgage (P&I)
- −$157
- Tax est. 1.5%
- −$38 /mo · $450/yr
- Insurance
- −$12
- HOA
- −$0
- Vacancy / Maint / Mgmt
- −$561
- Net cashflow
- $1,904
Break-even live
2-unit breakdown (identical units grouped — click to expand)
| Units | Beds | Baths | Est. rent |
|---|---|---|---|
| 2× units | 2 | 1 | $2,674 |
| #1 | 2 | 1 | $1,337 |
| #2 | 2 | 1 | $1,337 |
| Total (2 units) | $2,673 | ||
UW: 25.0% down · 7.5% · 30yr · 1.5% tax · 5.0% vac · 8.0% maint · 8.0% mgmt
Financing live
Cash to close
- Down payment
- $7,500
- Closing costs
- $900
- Reserves months
- —
- Total cash needed
- —
Loan-product check · same deal, 3 products live
Conventional
25% down · 7.5% · 30yr
- Down + closing
- —
- Monthly P&I
- —
- Monthly cashflow
- —
- DSCR
- —
- Eligible?
- —
Personal DTI + credit; lowest rate.
DSCR
20% down · 8.5% · 30yr
- Down + closing
- —
- Monthly P&I
- —
- Monthly cashflow
- —
- DSCR
- —
- Eligible?
- —
No personal income docs; deal must DSCR.
Hard money
10% down · 12.0% · 12mo
- Down + closing
- —
- Monthly P&I
- —
- Monthly cashflow
- —
- DSCR
- —
- Eligible?
- —
Short-term bridge; refi at stabilization.
Rent comps 3 comps
| Address | Beds | Baths | Sqft | Rent | $/sqft | DOM | Units | Dist |
|---|---|---|---|---|---|---|---|---|
| 8100 E Jefferson Ave Detroit, MI | 3.0 | 1.0–3.0 | 1089 | $2,210 | $2.03 | 19d | 20 | 1.20mi |
| 4510 Harding St Detroit, MI | 3.0 | 1.0 | 2394 | $1,500 | $0.63 | 17d | 1 | 1.27mi |
| 2174 Springle St Detroit, MI | 3.0 | 1.0 | 2256 | $1,150 | $0.51 | 1d | 1 | 1.29mi |
Listing history 2 events
-
2026-06-17remarks 699-char remark
Show marketing remark (1313 chars)
Rare opportunity to restore and reimagine this historic brick two-family property in Detroit's vibrant East Village neighborhood. Built in 1911, this approximately 2,382-square-foot structure offers substantial space and character for investors, developers, or owner-occupants seeking a renovation project. Located just minutes from Detroit's riverfront, the Belle Isle Park area, and the growing retail and dining destinations along Kercheval Avenue, East Village continues to attract investment and revitalization. The neighborhood features a mix of historic architecture, community development initiatives, convenient access to downtown Detroit, and proximity to major transportation corridors. Property is being sold as-is. Purchaser to verify all measurements, zoning, and development requirements. DLBA Disclosure: DLBA is entitled to a tax capture for the 5 tax years subsequent to transferring ownership of the property. The tax capture may be incompatible with tax abatements that are otherwise available to the selected purchaser. DLBA will review requests to waive its tax capture rights and may require a payment in lieu of taxes to approve such requests. The payment will be determined upon reviewing the development proforma and effect of any tax abatement on the purchase and development financing.
-
2026-06-17$30,000 Active 1 DOM
Show marketing remark (1313 chars)
Rare opportunity to restore and reimagine this historic brick two-family property in Detroit's vibrant East Village neighborhood. Built in 1911, this approximately 2,382-square-foot structure offers substantial space and character for investors, developers, or owner-occupants seeking a renovation project. Located just minutes from Detroit's riverfront, the Belle Isle Park area, and the growing retail and dining destinations along Kercheval Avenue, East Village continues to attract investment and revitalization. The neighborhood features a mix of historic architecture, community development initiatives, convenient access to downtown Detroit, and proximity to major transportation corridors. Property is being sold as-is. Purchaser to verify all measurements, zoning, and development requirements. DLBA Disclosure: DLBA is entitled to a tax capture for the 5 tax years subsequent to transferring ownership of the property. The tax capture may be incompatible with tax abatements that are otherwise available to the selected purchaser. DLBA will review requests to waive its tax capture rights and may require a payment in lieu of taxes to approve such requests. The payment will be determined upon reviewing the development proforma and effect of any tax abatement on the purchase and development financing.
ⓘ Source: listings_history table (triggers on properties + properties_extension) + one-shot
backfill from property_details.listing_events for pre-trigger history.
Climate risk First Street
- Flood 1/10 Low FEMA zone X (unshaded) · 0% chance over 30 yrs
- Wildfire 1/10 Low
- Heat 3/10 Moderate 7 d/yr ≥96°F today · 15 d/yr by 30 yrs out
- Wind 2/10 Low
- Air quality 3/10 Moderate 2 unhealthy d/yr today · 5 by 30 yrs out
Nearby sold comps map
Loading sold comps map…
Walkable amenities ~0.75 mi
Loading nearby amenities…
Taxation est. · year 1
- Rental income
- $32,076
- − Mortgage interest
- −$1,680
- − Property taxes
- −$450
- − Insurance
- −$150
- − Repairs & maintenance
- −$2,566
- − Management
- −$2,566
- − Depreciation
- −$873
- Taxable income
- $23,791
- Est. tax owed @ 24.0%
- −$5,710
- After-tax cash flow
- $17,142/yr
For passive investors: Depreciation is non-cash, so a rental often shows a tax loss while cash-flowing — sheltering income. Rental losses are passive: they offset passive income freely, and up to $25,000/yr can offset ordinary (W-2) income if you actively participate and your MAGI is under $100k (phasing out to $0 by $150k); unused losses carry forward. On sale, claimed depreciation is recaptured at up to 25%, and gains may owe capital-gains tax (a 1031 exchange can defer both). Figures are a year-1 estimate at your 24.0% rate — not tax advice; consult a CPA.
Schools (NCES district)
- District
- Detroit Public Schools Community District
- NCES district ID
- 2601103
- Math proficiency
- 10% ▼ -2.00%
- Reading proficiency
- 24% ▲ 6.00%
- Median HH income
- $25,815
- Composite
- 13.06/100
- National rank
- #9564
- State rank
- #499 of 540 in MI
Livability — Detroit
- Score
- 73/100
- State rank
- #218
- US rank
- #5427
Category grades
Schools grade is shown separately in the Schools card above.
Census & demographics
- Census place
- Detroit, MI
- County
- Wayne County · 1,562,939 people
- City population
- 572,865
- Metro
- Detroit-Warren-Dearborn, MI
- Population (ZIP)
- 18,595
- Household income
- $33,544
- Rent vs Own
- Severe rent burden
- 1364.0
Population outlook (Wayne County) Hauer SSP2
- Today (2025)
- 1,675,273 people
- By 2030
- 1,620,300 · -3.3%
- By 2040
- 1,502,341 · -10.3%
- By 2050
- 1,384,039 · -17.4%
- By 2075
- 1,124,592 · -32.9%
- By 2100
- 881,193 · -47.4%
Race, ethnicity, and origin ACS 2023
- Neighborhood character
- Predominantly Black (79%)
- Race & ethnicity
- Black 79% White 16% Two or more races 4%
- Common ancestry
- Romanian 1% Iranian 1% Lithuanian 1%
- Foreign-born
- 3% · Canada, Jamaica
- Languages at home
- 98% English-only · Spanish 1%
Political lean MEDSL · Wayne
- 2024 margin
- Strong D (+29.0) · D 62.7% · R 33.7% · Other 3.6%
- 2008→2024 swing
- -20.5pp toward R · 2008: 49.5pp · 2024: 29.0pp
- All cycles
- 2024: D+29.0 2020: D+38.1 2016: D+37.3 2012: D+46.9 2008: D+49.5
Not yet ingested
- Civics
- —
Market trends
- HPI YoY
- ▼ -367.43%
- Current HPI
- 102.0969
- Rent YoY
- —
- Metro
- Detroit-Warren-Dearborn, MI
- State GDP YoY
- ▲ 1.37%
- F500 in state
- 28
Industry mix (Fortune 500 HQ in MI)
| Industry | F500 HQs | Revenue |
|---|---|---|
| Automotive Parts | 3 | $48B |
|
||
| Automotive | 2 | $372B |
|
||
| Chemicals | 1 | $45B |
|
||
| Automotive Retail | 1 | $29B |
|
||
| Healthcare / Medical Devices | 1 | $23B |
|
||
| Automotive Technology | 1 | $20B |
|
||
Price history
+0.0% since first listed2 events — show timeline
- 2026-06-17 Listed $30,000 REALCOMP
- 2026-06-17 Listed $30,000 MiRealSource-MiMLS
Property tax history
-18.5%/yrLatest (2025): $39 · +0.0% YoY. Source: county tax records.
Cash-flow waterfall
monthlySold comps — $/sqft
last 12 mo · ≤1 miLoading sold comps…