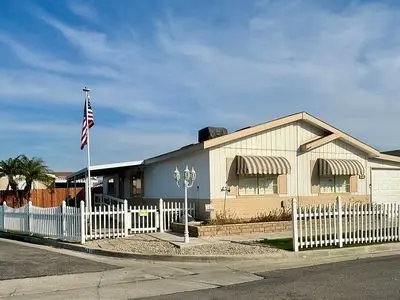
4216 Kingman Ln · Bakersfield, CA
Flood risk 1/10 · Minimal
- FEMA flood zone
- X
- Chance of flooding over 30 yrs
- 0.0%
- Est. flood insurance / yr
- $507 – $1,088
Fire risk 6/10 · Moderate
- Est. fire insurance / yr
- $659 – $1,223
Heat risk 8/10 · Major
- Hot days now (above 105°F)
- 7 days/yr
- Hot days in 30 yrs
- 17 days/yr
Wind risk 1/10 · Minimal
- Chance of severe wind over 30 yrs
- —
Air-quality risk 10/10 · Severe
- Unhealthy air days now
- 39 days/yr
- Unhealthy air days in 30 yrs
- 45 days/yr
Risk factors via First Street. Map © Google.
Why this score? — see what drove the C+ grade
The composite is a weighted blend of 9 inputs, each scored 0–100. Each bar is that input's sub-score; the figure is the points it added to the 100-point composite (weight × sub-score).
- Cash flow +28.1/30.0
- DSCR +10.0/10.0
- ARV discount +7.5/15.0
- 1% rule +6.6/10.0
- Schools +3.4/10.0
- Livability +2.9/5.0
- Condition / age +2.5/5.0
- Rent growth +1.2/5.0
- Appreciation +0.0/10.0
$139,900
🖨 Deal sheet 📄 Offer letter ✓ Due diligence
Listing remarks
Why wait for the weekend to relax? Step into a home that feels like a year-round vacation. Nestled in the highly coveted Royal Palms 55+ active community, this isn& apos; t just a place to live, it& apos; s a place to thrive. THE CROWN JEWEL: While most community living means sharing the pool, this home features your very own private hot tub/spa in the backyard. It is in pristine condition and fully included, offering a secluded spot for morning soaks or evening relaxation under the Bakersfield stars. This home is truly turn-key with high-ticket updates: BRAND NEW AC: Only 1 year old - stay icy cool with maximum efficiency. STORAGE GALORE: Not one, but two spacious Tuff Sheds are i
Key facts
- Plantation shutters
- Private hot tub spa
- Vaulted ceilings
Tags
Property features AI
Exterior
- Home design: Built in 1996
- Construction: 1996 construction
- Exterior features: Located in the Homaker Park subdivision
Neighborhood map
What this means for you Summary
Snapshot
- This is a 3-bed/2.0-bath manufactured listed at $140k.
Deal economics
- At list price, monthly cash flow is $441 ($5k/yr) — positive.
- The deal already cash-flows at list — no discount required.
- Meets the 1% rule at list price ($2k rent vs $140k).
- Recommended offer: $138k (1.5% below list) — sets the bar for market timing.
- Cap rate 10.1% vs local median 3.6% in Bakersfield — top-decile yield for the area; either an underpriced asset or a hidden risk that comps aren't pricing in. Stress-test before assuming the spread holds.
Location & tenants
- Location reads 58/100 on livability (#716 in CA) — a working-class tenant base; expect higher turnover. Strengths: housing A+; Watch: health & safety D, schools D-, crime F.
- Kern High (urban): math 21% / reading 51% proficiency, ranked #860 of 1,400 in CA (top 61%) — families likely to look elsewhere, expect single-tenant / working-renter base with shorter leases.
- Market conditions: Rents falling (-5.1%/yr); 70 active listings in the ZIP; 27 comparable units currently listed for rent nearby; rentals leasing fast (median 3d on market — plan ~1-2 weeks tenant-placement turnaround); lower-income renter base — watch delinquency; 3,244 units permitted in Kern County in 2024 (73 in 5+ unit buildings).
- This rent runs 45% of the median local income ($44k/yr) — at the standard rent-burdened threshold; future hikes will face affordability resistance.
Forward outlook
- Local home prices are declining (-3.0%/yr); year-one equity from $967 of loan paydown is wiped out by about $4k of value loss. Plan a longer hold.
- Kern County population projected at +17% by 2050 — long-run rental-demand tailwind backs the buy-and-hold thesis.
Negotiation context
- It's been on market 23 days — a 2% lower offer ($138k) is reasonable based on typical stale-listing flexibility.
Risks & watch-outs
- Climate carrying-cost: major wildfire risk; extreme-heat days projected 7→17/yr by 2055 (HVAC capex compounding) — expect insurance premiums to compound above CPI over the hold.
Questions for the listing agent
- Is there a deadline driving the sale (1031 exchange, divorce, estate, relocation)? That informs how much negotiation room exists.
- Schools are D-rated, which usually means shorter tenancies and higher turnover. Who's the typical renter profile here, and what's been the actual vacancy rate?
- Crime grade is F in this area — have there been break-ins, vandalism, or insurance claims at this property in the last 3 years? What carrier currently insures it and at what premium?
- What's the average days-on-market for RENTAL listings here right now (not sales)? A rising rental-DOM trend means longer vacancies and softer asking-rent achievability than the comps imply.
- What's the recent tenant-quality profile in this submarket — average credit score on applications, eviction rate, late-payment / NSF rate, and stable-employment percentage? A property-management company in the area should have these aggregated.
- How much new for-sale + rental construction is in the pipeline within 1–3 miles? Heavy new supply typically softens prices + rents 12–24 months out; constrained supply supports both.
Investment metrics
- 1% rule
- 1.16% ✓
- Cap rate
- 10.08%
- Cash-on-cash
- 13.52%
- DSCR
- 1.60
- GRM
- 7.2
CMA / ARV
- ARV (on-the-fly)
- $83,520
- Comps found
- 12
Show comp detail 12 sales within ~0.75 mi
| Address | Dist | Beds/Ba | Sqft | Sold | Price | $/sf | Match |
|---|---|---|---|---|---|---|---|
| 701 Underwood Ct | 0.26mi | 3/2.0 | 1,440 (0%) | 4mo | $85,000 | $59 | 85 |
| 1012 Coconut Way | 0.12mi | 2/2.0 (-1) | 1,440 (0%) | 11mo | $75,000 | $52 | 80 |
| 4401 Prince St | 0.19mi | 2/1.8 (-1) | 1,440 (0%) | 8mo | $54,000 | $38 | 79 |
| 4217 Kingman Ln | 0.02mi | 2/2.0 (-1) | 1,392 (-3%) | 13mo | $89,000 | $64 | 77 |
| 4204 Prince St | 0.21mi | 2/2.0 (-1) | 1,368 (-5%) | 1mo | $80,000 | $58 | 76 |
| 609 42nd St | 0.35mi | 2/2.0 (-1) | 1,440 (0%) | 8mo | $37,500 | $26 | 72 |
| 612 44th St | 0.32mi | 3/2.0 | 1,336 (-7%) | 6mo | $95,000 | $71 | 68 |
| 4605 Q St | 0.32mi | 2/2.0 (-1) | 1,536 (+7%) | 6mo | $85,000 | $55 | 64 |
| 4300 Prince St | 0.20mi | 2/2.0 (-1) | 1,248 (-13%) | 7mo | $45,000 | $36 | 58 |
| 400 E Roberts Ln #131 | 0.72mi | 2/2.0 (-1) | 1,460 (+1%) | 6mo | $84,000 | $58 | 54 |
| 400 E Roberts Ln #56 | 0.72mi | 3/1.8 | 1,440 (0%) | 14mo | $90,000 | $63 | 54 |
| 400 E Roberts Ln #30 | 0.72mi | 2/2.0 (-1) | 1,344 (-7%) | 10mo | $105,000 | $78 | 42 |
Match score weights: distance 35% · size 25% · config 20% · recency 20%. Top-matched comps best support the ARV.
Projected returns pro-forma
-3.0% appreciation · 0.0% rent growth · sell at horizon
- IRR
- 0.4%
- Equity multiple
- 1.02×
- Total profit
- $638
- Equity at exit
- $20,860
- IRR
- 7.0%
- Equity multiple
- 1.46×
- Total profit
- $18,168
- Equity at exit
- $12,096
Cash invested: $39,172 (down + closing). Projections, not guarantees.
Landlord ↔ Tenant lean methodology
- Overall (STATE)
- 18 Strongly Tenant-Friendly
- State California
- 18 Strongly Tenant-Friendly · D+13
- County
- — inherits STATE
- City
- — inherits STATE
ZIP-level market 93301
- Home prices YoY
- -9.4%
- Rents YoY
- -5.1%
- Active inventory
- 70
- Price-to-rent
- 7.2×
Monthly cashflow live
- Estimated rent
- $1,622 high interval (Pro) →
- Mortgage (P&I)
- −$734
- Tax from tax record
- −$48 /mo · $580/yr
- Insurance
- −$58
- HOA
- −$0
- Vacancy / Maint / Mgmt
- −$341
- Net cashflow
- $441
Break-even live
UW: 25.0% down · 7.5% · 30yr · 1.5% tax · 5.0% vac · 8.0% maint · 8.0% mgmt
Financing live
Cash to close
- Down payment
- $34,975
- Closing costs
- $4,197
- Reserves months
- —
- Total cash needed
- —
Loan-product check · same deal, 3 products live
Conventional
25% down · 7.5% · 30yr
- Down + closing
- —
- Monthly P&I
- —
- Monthly cashflow
- —
- DSCR
- —
- Eligible?
- —
Personal DTI + credit; lowest rate.
DSCR
20% down · 8.5% · 30yr
- Down + closing
- —
- Monthly P&I
- —
- Monthly cashflow
- —
- DSCR
- —
- Eligible?
- —
No personal income docs; deal must DSCR.
Hard money
10% down · 12.0% · 12mo
- Down + closing
- —
- Monthly P&I
- —
- Monthly cashflow
- —
- DSCR
- —
- Eligible?
- —
Short-term bridge; refi at stabilization.
Rent comps 27 comps
| Address | Beds | Baths | Sqft | Rent | $/sqft | DOM | Units | Dist |
|---|---|---|---|---|---|---|---|---|
| 1201 40th St Bakersfield, CA | 2.0–3.0 | 1.0–2.0 | 870 | $1,219 | $1.40 | 2d | 1 | 0.23mi |
| 3700 Q St Bakersfield, CA | 3.0 | 2.0 | 1088 | $1,600 | $1.47 | 3d | 1 | 0.51mi |
| 4504 Tierra Verde St Unit C Bakersfield, CA | 2.0 | 1.5 | 925 | $1,595 | $1.72 | 2d | 1 | 0.62mi |
| 223 McCord Ave Bakersfield, CA | 3.0 | 2.0 | 1536 | $1,795 | $1.17 | 2d | 1 | 0.73mi |
| 448 S Oildale Dr Bakersfield, CA | 3.0 | 2.0 | 1080 | $1,500 | $1.39 | 2d | 1 | 0.80mi |
| 1951 Golden State Ave Bakersfield, CA | 1.0–3.0 | 1.0–2.5 | 1017 | $1,695 | $1.67 | 2d | 2 | 0.82mi |
| 3333 El Encanto Ct Bakersfield, CA | 2.0 | 2.0 | 990 | $1,595 | $1.61 | 14d | 1 | 0.84mi |
| 3333 El Encanto Ct Bakersfield, CA | 2.0 | 1.5 | 990 | $1,495 | $1.51 | 2d | 1 | 0.84mi |
| 327 McCord Ave Unit 6 Bakersfield, CA | 3.0 | 1.0 | 1000 | $1,500 | $1.50 | 2d | 1 | 0.84mi |
| 222 Moneta Ave Unit 222 Bakersfield, CA | 3.0 | 2.0 | 1040 | $1,700 | $1.63 | 2d | 1 | 0.92mi |
| 715 30th St Bakersfield, CA | 3.0 | 1.0 | 1000 | $1,500 | $1.50 | 21d | 1 | 0.94mi |
| 130 El Cerrito Dr Bakersfield, CA | 3.0 | 2.0 | 1767 | $2,750 | $1.56 | 43d | 1 | 0.95mi |
| 617 30th St Apt B Bakersfield, CA | 2.0 | 1.0 | 918 | $1,225 | $1.33 | 10d | 1 | 0.96mi |
| 106 E Warren Ave Bakersfield, CA | 3.0 | 2.0 | 1169 | $1,400 | $1.20 | 10d | 1 | 0.97mi |
| 2520 Loma Linda Dr Bakersfield, CA | 3.0 | 2.0 | 1200 | $2,075 | $1.73 | 10d | 1 | 1.02mi |
| 222 Harding Ave Unit B Bakersfield, CA | 3.0 | 2.0 | 1100 | $1,750 | $1.59 | 2d | 1 | 1.02mi |
| 213 Oildale Dr Unit A Bakersfield, CA | 2.0 | 2.0 | 928 | $1,195 | $1.29 | 2d | 1 | 1.03mi |
| 516 28th St Unit 4 Bakersfield, CA | 2.0 | 1.0 | 900 | $1,075 | $1.19 | 2d | 1 | 1.03mi |
| 627 Hood Dr Bakersfield, CA | 3.0 | 1.0 | 1140 | $1,795 | $1.57 | 2d | 1 | 1.04mi |
| 631 28th St Unit 5 Bakersfield, CA | 2.0 | 1.0 | 1040 | $1,075 | $1.03 | 2d | 1 | 1.05mi |
| 631 28th St Unit 3 Bakersfield, CA | 2.0 | 1.0 | 1040 | $1,075 | $1.03 | 21d | 1 | 1.05mi |
| 115 Irene St Bakersfield, CA | 3.0 | 1.0 | 1620 | $1,900 | $1.17 | 2d | 1 | 1.06mi |
| 627 Beardsley Ave Bakersfield, CA | 3.0 | 1.0 | 967 | $1,575 | $1.63 | 43d | 1 | 1.08mi |
| 114 Flower St Bakersfield, CA | 3.0 | 1.5 | 1771 | $2,000 | $1.13 | 2d | 1 | 1.19mi |
| 217 Jefferson St Bakersfield, CA | 3.0 | 2.0 | 980 | $1,550 | $1.58 | 21d | 1 | 1.22mi |
| 419 Washington Ave Unit 417 Bakersfield, CA | 3.0 | 2.0 | 975 | $1,500 | $1.54 | 2d | 1 | 1.35mi |
| 415 Jeffrey St Bakersfield, CA | 2.0 | 1.0 | 1000 | $1,400 | $1.40 | 2d | 1 | 1.41mi |
Listing history 15 events
-
2026-06-18days on market $139,900 Active 23 DOM
-
2026-06-17days on market $139,900 Active 22 DOM
-
2026-06-16days on market $139,900 Active 21 DOM
-
2026-06-15days on market $139,900 Active 20 DOM
-
2026-06-14days on market $139,900 Active 18 DOM
-
2026-06-10days on market $139,900 Active 15 DOM
-
2026-06-09days on market $139,900 Active 14 DOM
-
2026-06-08days on market $139,900 Active 13 DOM
-
2026-06-07days on market $139,900 Active 12 DOM
-
2026-06-05days on market $139,900 Active 9 DOM
-
2026-06-03days on market $139,900 Active 8 DOM
-
2026-06-03days on market $139,900 Active 7 DOM
-
2026-06-01days on market $139,900 Active 6 DOM
-
2026-05-31days on market $139,900 Active 5 DOM
-
2026-05-26$139,900 Active
ⓘ Source: listings_history table (triggers on properties + properties_extension) + one-shot
backfill from property_details.listing_events for pre-trigger history.
Tax reassessment forecast CA · Resets to sale price
- Current annual tax
- $580 · $48/mo
- Projected year-2 tax
- $1,063 · $89/mo
- Expected delta
- +$483/yr (+$40/mo · 83.3%)
ⓘ Screening estimate from a state-policy table — verify with the county assessor before closing.
Climate risk First Street
- Flood 1/10 Low FEMA zone X · 0% chance over 30 yrs
- Wildfire 6/10 Major
- Heat 8/10 Severe 7 d/yr ≥105°F today · 17 d/yr by 30 yrs out
- Wind 1/10 Low
- Air quality 10/10 Extreme 39 unhealthy d/yr today · 45 by 30 yrs out
Nearby sold comps map
Loading sold comps map…
Walkable amenities ~0.75 mi
Loading nearby amenities…
Taxation est. · year 1
- Rental income
- $19,469
- − Mortgage interest
- −$7,837
- − Property taxes
- −$580
- − Insurance
- −$700
- − Repairs & maintenance
- −$1,558
- − Management
- −$1,558
- − Depreciation
- −$4,070
- Taxable income
- $3,168
- Est. tax owed @ 24.0%
- −$760
- After-tax cash flow
- $4,537/yr
For passive investors: Depreciation is non-cash, so a rental often shows a tax loss while cash-flowing — sheltering income. Rental losses are passive: they offset passive income freely, and up to $25,000/yr can offset ordinary (W-2) income if you actively participate and your MAGI is under $100k (phasing out to $0 by $150k); unused losses carry forward. On sale, claimed depreciation is recaptured at up to 25%, and gains may owe capital-gains tax (a 1031 exchange can defer both). Figures are a year-1 estimate at your 24.0% rate — not tax advice; consult a CPA.
Schools (NCES district)
- District
- Kern High
- NCES district ID
- 0619540
- Math proficiency
- 21% ▬ 0.00%
- Reading proficiency
- 51% ▲ 2.00%
- Median HH income
- $49,686
- Composite
- 33.68/100
- National rank
- #10443
- State rank
- #860 of 1400 in CA
Livability — Bakersfield
- Score
- 58/100
- State rank
- #716
- US rank
- #21355
Category grades
Schools grade is shown separately in the Schools card above.
Census & demographics
- Census place
- Bakersfield, CA
- County
- Kern County · 710,371 people
- City population
- 499,124
- Metro
- Bakersfield, CA
- Population (ZIP)
- 13,620
- Household income
- $43,561
- Rent vs Own
- Severe rent burden
- 1296.0
Population outlook (Kern County) Hauer SSP2
- Today (2025)
- 947,286 people
- By 2030
- 978,984 · +3.3%
- By 2040
- 1,045,018 · +10.3%
- By 2050
- 1,105,232 · +16.7%
- By 2075
- 1,229,538 · +29.8%
- By 2100
- 1,238,059 · +30.7%
Race, ethnicity, and origin ACS 2023
- Neighborhood character
- Diverse neighborhood (Simpson 0.63)
- Race & ethnicity
- Hispanic / Latino 45% White 41% Two or more races 16% Black 5% Native American 2% Asian 2%
- Hispanic origin (detail)
- Mexican 37% Puerto Rican 5%
- Common ancestry
- Slovak 2% Scotch-Irish 2% Subsaharan African 2%
- Foreign-born
- 10% · Canada, South Korea
- Languages at home
- 68% English-only · Spanish 29% Russian/Polish/Slavic 2%
Political lean MEDSL · Kern
- 2024 margin
- Strong R (+21.1) · D 38.2% · R 59.3% · Other 2.5%
- 2008→2024 swing
- -3.3pp toward R · 2008: -17.8pp · 2024: -21.1pp
- All cycles
- 2024: R+21.1 2020: R+10.2 2016: R+15.0 2012: R+20.9 2008: R+17.8
Not yet ingested
- Civics
- —
Market trends
- HPI YoY
- ▼ -38.38%
- Current HPI
- 370.1318
- Rent YoY
- ▼ -5.12%
- Metro
- Bakersfield, CA
- State GDP YoY
- ▲ 3.21%
- F500 in state
- 116
Industry mix (Fortune 500 HQ in CA)
| Industry | F500 HQs | Revenue |
|---|---|---|
| Technology | 27 | $1,492B |
|
||
| Financial Services | 3 | $174B |
|
||
| Retail | 3 | $44B |
|
||
| Insurance | 3 | $26B |
|
||
| Media / Entertainment | 2 | $115B |
|
||
| Pharmaceuticals / Biotech | 2 | $62B |
|
||
Price history
1 event — show timeline
- 2026-05-26 Listed $139,900 FSBO.com
Property tax history
+11.8%/yrLatest (2025): $580 · +5.0% YoY. Source: county tax records.
Cash-flow waterfall
monthlySold comps — $/sqft
last 12 mo · ≤1 miLoading sold comps…