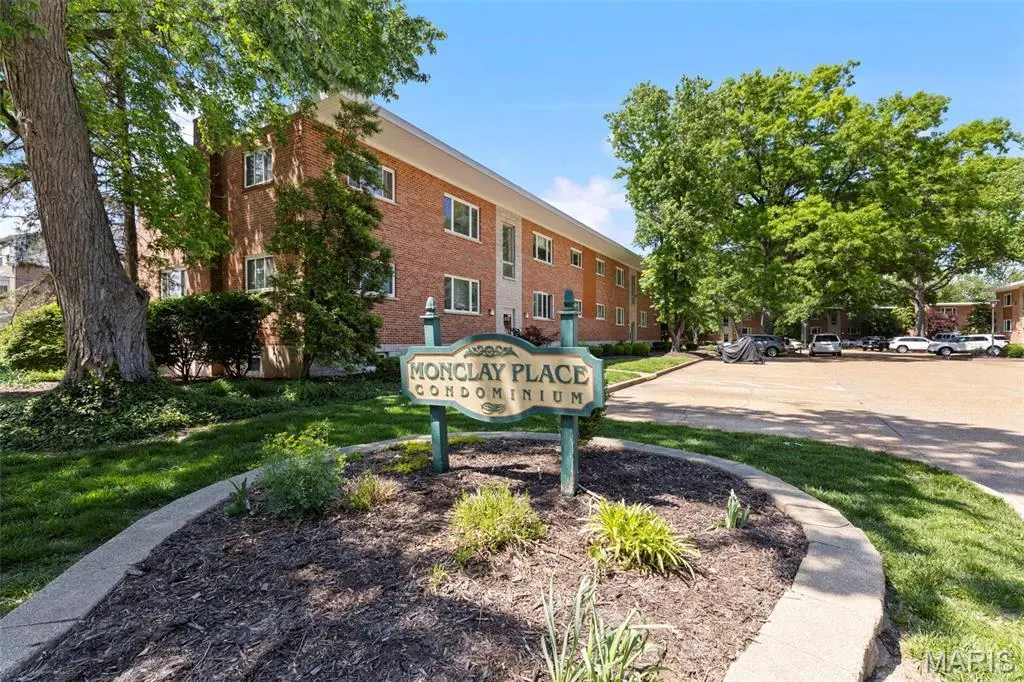
221 Monclay Ct Unit 2N · Kirkwood, MO
Flood risk 1/10 · Minimal
- FEMA flood zone
- X (unshaded)
- Chance of flooding over 30 yrs
- 0.0%
- Est. flood insurance / yr
- $473 – $860
Fire risk 1/10 · Minimal
- Est. fire insurance / yr
- $1,054 – $1,958
Heat risk 4/10 · Minor
- Hot days now (above 106°F)
- 7 days/yr
- Hot days in 30 yrs
- 21 days/yr
Wind risk 2/10 · Minimal
- Chance of severe wind over 30 yrs
- 1.0%
Air-quality risk 3/10 · Minor
- Unhealthy air days now
- 2 days/yr
- Unhealthy air days in 30 yrs
- 4 days/yr
Risk factors via First Street. Map © Google.
Why this score? — see what drove the D+ grade
The composite is a weighted blend of 9 inputs, each scored 0–100. Each bar is that input's sub-score; the figure is the points it added to the 100-point composite (weight × sub-score).
- Cash flow +15.4/30.0
- ARV discount +7.5/15.0
- 1% rule +5.9/10.0
- Schools +5.7/10.0
- DSCR +4.7/10.0
- Rent growth +4.2/5.0
- Livability +3.9/5.0
- Condition / age +2.5/5.0
- Appreciation +0.0/10.0
$165,000
🖨 Deal sheet 📄 Offer letter ✓ Due diligence
Listing remarks
Enjoy Kirkwood living without the Kirkwood price! Located in the sought-after, award-winning Kirkwood School District, this well-maintained second-floor condo is just a 3-minute walk to Teleo Coffee, Station Plaza, and everything vibrant downtown Kirkwood has to offer. Inside, you’ll find 2 bedrooms, 1 full bath, a living room with beautiful hardwood floors, and a spacious kitchen with neutral cabinetry. Recent updates include a newer washer/dryer (included) and an upgraded electrical panel, plus both the HVAC system and hot water heater were replaced in 2025, offering added value and peace of mind. Additional perks include an in-unit washer and dryer, hallway storage, and a large pri
Key facts
- $299 HOA
- Built 1960
- Listed 6 days
Property features AI
Finance
- Other: Lease not considered
- HOA & community: Monclay Place Condominiums (monthly HOA dues); HOA fee: $299 per month; HOA covers water, sewer and trash; Community of 64 units; No listed association amenities
Exterior
- Parking: Assigned parking in a paved parking lot
- Utilities: Community water; Public sewer; Cable available; Electric: other; Water available
- Home design: Residential condominium; Private ownership; Two levels; Entry level: main-level bedrooms
- Construction: Brick construction; Architectural shingle roof; Concrete perimeter foundation; Basement with concrete floor and storage
- Exterior features: Patio; Adjoins common ground; No fencing
Interior
- Kitchen: Dishwasher; Microwave; Gas range; Free-standing refrigerator; Gas water heater
- Bedrooms: 2 bedrooms (both on the main level)
- Flooring: Tile flooring; Wood flooring
- Bathrooms: 1 full bathroom (on the main level)
- Heating & cooling: Natural gas heating; Central air conditioning; Ceiling fans
- Interior features: Blinds on windows; Insulated windows; Wi-Fi available; Storage space
- Laundry & utility: In-unit laundry (stacked washer/dryer)
Neighborhood map
What this means for you Summary
Snapshot
- This is a 2-bed/1.0-bath condo listed at $165k.
Deal economics
- At list price, monthly cash flow is $63 ($756/yr) — positive.
- The deal already cash-flows at list — no discount required.
- Meets the 1% rule at list price ($2k rent vs $165k).
- Cap rate 6.8% vs local median 2.4% in Kirkwood — top-decile yield for the area; either an underpriced asset or a hidden risk that comps aren't pricing in. Stress-test before assuming the spread holds.
Location & tenants
- Location reads 78/100 on livability (#27 in MO, #2,478 nationally) — a middle-class / working-renter tenant base. Strengths: employment A+, housing A+, crime B; Watch: cost of living C-, commute F.
- Kirkwood R-VII (suburban): math 57% / reading 68% proficiency, ranked #5 of 324 in MO (top 2%) — acceptable for families but not a draw, mixed tenant base, ~2y average lease; only 11% free/reduced lunch — higher-income household profile.
- Zoned schools: F. P. Tillman Elem. (math 55% / reading 72%, grade B, #88 of 1,115 statewide, top 8%, 474 students, 6% FRL); Kirkwood Sr. High (math 72% / reading 79%, grade A-, #3 of 521 statewide, top 0%, 1,775 students, 11% FRL) — zoned schools at 8% FRL track the district average.
- Market conditions: Rents rising fast (+6.6%/yr); 211 active listings in the ZIP; 4 comparable units currently listed for rent nearby; rentals at typical pace (median 24d on market — plan ~3-4 weeks tenant-placement turnaround); high-income renter base; 920 units permitted in St. Louis County in 2024 (250 in 5+ unit buildings).
- This rent is only 16% of the median local income ($136k/yr) — well below the 30% rent-burden line; pricing power to push rent on renewal without tenant pushback.
Forward outlook
- Local home prices are declining (-3.0%/yr); year-one equity from $1k of loan paydown is wiped out by about $5k of value loss. Plan a longer hold.
Negotiation context
- Only 6 days on market — expect competitive offers; lowballing is unlikely to land.
Questions for the listing agent
- Built in 1960 — when were the roof, HVAC, electrical panel, plumbing, and water heater last replaced?
- What does the HOA fee cover, when was the last increase, and are there any pending special assessments or reserve-fund shortfalls?
- Any open or pending special assessments — roof, HVAC, plumbing, elevator, façade? What's the per-unit balance and payoff schedule, and is the seller paying it off at close or rolling it to the buyer?
- Is there a deadline driving the sale (1031 exchange, divorce, estate, relocation)? That informs how much negotiation room exists.
- Schools are A-rated — typically a magnet for longer-tenancy family renters. What's the average tenant stay here, and is there a school-zone premium baked into asking?
- The area grade is low — what's the realistic commute time and amenity access for the typical tenant pool here? Any planned neighborhood developments (good or bad) we should know about?
- What's the average days-on-market for RENTAL listings here right now (not sales)? A rising rental-DOM trend means longer vacancies and softer asking-rent achievability than the comps imply.
- What's the recent tenant-quality profile in this submarket — average credit score on applications, eviction rate, late-payment / NSF rate, and stable-employment percentage? A property-management company in the area should have these aggregated.
- How much new apartment / multifamily construction is in the pipeline within 1–3 miles? Heavy new supply (>2% of stock underway) typically softens rents 12–24 months out; light construction supports rent growth.
Investment metrics
- 1% rule
- 1.09% ✓
- Cap rate
- 6.75%
- Cash-on-cash
- 1.64%
- DSCR
- 1.07
- GRM
- 7.6
CMA / ARV
No comps found within radius.
Projected returns pro-forma
-3.0% appreciation · 6.63% rent growth · sell at horizon
- IRR
- -8.9%
- Equity multiple
- 0.66×
- Total profit
- $-15,731
- Equity at exit
- $24,602
- IRR
- 5.5%
- Equity multiple
- 1.48×
- Total profit
- $22,334
- Equity at exit
- $14,266
Cash invested: $46,200 (down + closing). Projections, not guarantees.
Landlord ↔ Tenant lean methodology
- Overall (STATE)
- 81 Strongly Landlord-Friendly
- State Missouri
- 81 Strongly Landlord-Friendly · R+10
- County
- — inherits STATE
- City
- — inherits STATE
ZIP-level market 63122
- Rents YoY
- 6.6%
- Active inventory
- 211
- Price-to-rent
- 7.6×
Monthly cashflow live
- Estimated rent
- $1,804 medium interval (Pro) →
- Mortgage (P&I)
- −$865
- Tax from tax record
- −$129 /mo · $1,550/yr
- Insurance
- −$69
- HOA
- −$299
- Vacancy / Maint / Mgmt
- −$379
- Net cashflow
- $63
Break-even live
UW: 25.0% down · 7.5% · 30yr · 1.5% tax · 5.0% vac · 8.0% maint · 8.0% mgmt
Financing live
Cash to close
- Down payment
- $41,250
- Closing costs
- $4,950
- Reserves months
- —
- Total cash needed
- —
Loan-product check · same deal, 3 products live
Conventional
25% down · 7.5% · 30yr
- Down + closing
- —
- Monthly P&I
- —
- Monthly cashflow
- —
- DSCR
- —
- Eligible?
- —
Personal DTI + credit; lowest rate.
DSCR
20% down · 8.5% · 30yr
- Down + closing
- —
- Monthly P&I
- —
- Monthly cashflow
- —
- DSCR
- —
- Eligible?
- —
No personal income docs; deal must DSCR.
Hard money
10% down · 12.0% · 12mo
- Down + closing
- —
- Monthly P&I
- —
- Monthly cashflow
- —
- DSCR
- —
- Eligible?
- —
Short-term bridge; refi at stabilization.
Rent comps 4 comps
| Address | Beds | Baths | Sqft | Rent | $/sqft | DOM | Units | Dist |
|---|---|---|---|---|---|---|---|---|
| 203 Monclay Ct Unit 2E Saint Louis, MO | 1.0 | 1.0 | 555 | $1,125 | $2.03 | 23d | 1 | 0.06mi |
| 141 E Madison Ave Kirkwood, MO | 1.0–2.0 | 1.0–2.0 | 1017 | $2,765 | $2.72 | 1d | 9 | 0.30mi |
| 416 N Kirkwood Rd St. Louis, MO | 2.0 | 1.0–2.0 | 890 | $3,751 | $4.21 | 1d | 6 | 0.47mi |
| 467 S Holmes Ave Unit B Kirkwood, MO | 2.0 | 1.0 | 700 | $1,099 | $1.57 | 23d | 1 | 1.00mi |
HOA detail condo
- Monthly dues
- $299 · $3,588/yr
- Likely covers
- waterelectric
- Assessments
- None detected in remarks — confirm with the listing agent.
Listing history 5 events
-
2026-05-08status Pending 832-char remark
-
2026-05-02$165,000 Active 832-char remark
-
2026-05-01historical $165,000 832-char remark
-
2007-08-15soldstatus
-
2005-09-16soldstatus $5,120,000
ⓘ Source: listings_history table (triggers on properties + properties_extension) + one-shot
backfill from property_details.listing_events for pre-trigger history.
Tax reassessment forecast MO · Resets to sale price
- Current annual tax
- $1,550 · $129/mo
- Projected year-2 tax
- $1,600 · $133/mo
- Expected delta
- +$50/yr (+$4/mo · 3.2%)
ⓘ Screening estimate from a state-policy table — verify with the county assessor before closing.
Climate risk First Street
- Flood 1/10 Low FEMA zone X (unshaded) · 0% chance over 30 yrs
- Wildfire 1/10 Low
- Heat 4/10 Moderate 7 d/yr ≥106°F today · 21 d/yr by 30 yrs out
- Wind 2/10 Low 100% chance of damaging wind over 30 yrs
- Air quality 3/10 Moderate 2 unhealthy d/yr today · 4 by 30 yrs out
Nearby sold comps map
Loading sold comps map…
Walkable amenities ~0.75 mi
Loading nearby amenities…
Taxation est. · year 1
- Rental income
- $21,649
- − Mortgage interest
- −$9,243
- − Property taxes
- −$1,550
- − Insurance
- −$825
- − Repairs & maintenance
- −$1,732
- − Management
- −$1,732
- − HOA
- −$3,588
- − Depreciation
- −$4,800
- Taxable loss
- −$1,821
- Est. tax savings @ 24.0%
- +$437
- After-tax cash flow
- $1,193/yr
For passive investors: Depreciation is non-cash, so a rental often shows a tax loss while cash-flowing — sheltering income. Rental losses are passive: they offset passive income freely, and up to $25,000/yr can offset ordinary (W-2) income if you actively participate and your MAGI is under $100k (phasing out to $0 by $150k); unused losses carry forward. On sale, claimed depreciation is recaptured at up to 25%, and gains may owe capital-gains tax (a 1031 exchange can defer both). Figures are a year-1 estimate at your 24.0% rate — not tax advice; consult a CPA.
Schools (NCES district)
- District
- Kirkwood R-VII
- NCES district ID
- 2916770
- Math proficiency
- 57% ▼ -9.00%
- Reading proficiency
- 68% ▼ -5.00%
- Median HH income
- $85,581
- Composite
- 56.51/100
- National rank
- #1153
- State rank
- #5 of 324 in MO
Livability — Kirkwood
- Score
- 78/100
- State rank
- #27
- US rank
- #2478
Category grades
Schools grade is shown separately in the Schools card above.
Census & demographics
- Census place
- Kirkwood, MO
- County
- Saint Louis County · 888,823 people
- City population
- 41,634
- Metro
- St. Louis, MO-IL
- Population (ZIP)
- 41,634
- Household income
- $136,385
- Rent vs Own
- Severe rent burden
- 738.0
Population outlook (St. Louis County) Hauer SSP2
- Today (2025)
- 1,025,227 people
- By 2030
- 1,028,023 · +0.3%
- By 2040
- 1,020,940 · -0.4%
- By 2050
- 1,007,280 · -1.8%
- By 2075
- 987,277 · -3.7%
- By 2100
- 921,984 · -10.1%
Race, ethnicity, and origin ACS 2023
- Neighborhood character
- Predominantly White (84%)
- Race & ethnicity
- White 84% Two or more races 8% Black 4% Hispanic / Latino 2% Asian 2%
- Common ancestry
- Lithuanian 3% Italian 3% Slovak 3%
- Foreign-born
- 3% · Canada, China
- Languages at home
- 96% English-only · Spanish 1% Other Indo-European 1% Chinese 1%
Political lean MEDSL · St. Louis
- 2024 margin
- Strong D (+23.4) · D 60.8% · R 37.4% · Other 1.7%
- 2008→2024 swing
- +3.5pp toward D · 2008: 19.9pp · 2024: 23.4pp
- All cycles
- 2024: D+23.4 2020: D+24.0 2016: D+16.2 2012: D+13.7 2008: D+19.9
Not yet ingested
- Civics
- —
Market trends
- HPI YoY
- ▼ -413.98%
- Current HPI
- 242.2782
- Rent YoY
- ▲ 6.63%
- Metro
- St. Louis, MO-IL
- State GDP YoY
- ▲ 1.84%
- F500 in state
- 20
Industry mix (Fortune 500 HQ in MO)
| Industry | F500 HQs | Revenue |
|---|---|---|
| Healthcare | 1 | $163B |
|
||
| Insurance | 1 | $21B |
|
||
| Industrial Technology | 1 | $17B |
|
||
| Retail | 1 | $16B |
|
||
| Industrial Distribution | 1 | $10B |
|
||
| Utilities | 1 | $9B |
|
||
Price history
-96.8% since first listed6 events — show timeline
- 2026-06-04 Sold (MLS) — MARIS as Distributed by MLS Grid
- 2026-05-08 Pending — MARIS as Distributed by MLS Grid
- 2026-05-02 Listed $165,000 MARIS as Distributed by MLS Grid
- 2026-05-01 Coming Soon $165,000 MARIS as Distributed by MLS Grid
- 2007-08-15 Sold (Public Records) — Public Records
- 2005-09-16 Sold (Public Records) $5,120,000 Public Records
Property tax history
+4.1%/yrLatest (2022): $1,550 · +10.4% YoY. Source: county tax records.
Cash-flow waterfall
monthlySold comps — $/sqft
last 12 mo · ≤1 miLoading sold comps…