45049 Pipevine Cir · North Fort Myers, FL
Flood risk 1/10 · Minimal
- FEMA flood zone
- X (unshaded)
- Chance of flooding over 30 yrs
- 0.0%
- Est. flood insurance / yr
- $507 – $1,088
Fire risk 8/10 · Major
- Est. fire insurance / yr
- $947 – $1,759
Heat risk 9/10 · Severe
- Hot days now (above 107°F)
- 7 days/yr
- Hot days in 30 yrs
- 27 days/yr
Wind risk 10/10 · Severe
- Chance of severe wind over 30 yrs
- 99.0%
Air-quality risk 2/10 · Minimal
- Unhealthy air days now
- 0 days/yr
- Unhealthy air days in 30 yrs
- 3 days/yr
Risk factors via First Street. Map © Google.
Why this score? — see what drove the D- grade
The composite is a weighted blend of 9 inputs, each scored 0–100. Each bar is that input's sub-score; the figure is the points it added to the 100-point composite (weight × sub-score).
- Cash flow +10.1/30.0
- ARV discount +7.5/15.0
- Schools +4.6/10.0
- Livability +3.7/5.0
- Rent growth +3.5/5.0
- 1% rule +3.0/10.0
- DSCR +2.9/10.0
- Appreciation +2.4/10.0
- Condition / age +1.0/5.0
$349,098
🖨 Deal sheet (PDF) 📄 Offer letter ✓ Due diligence
Listing remarks
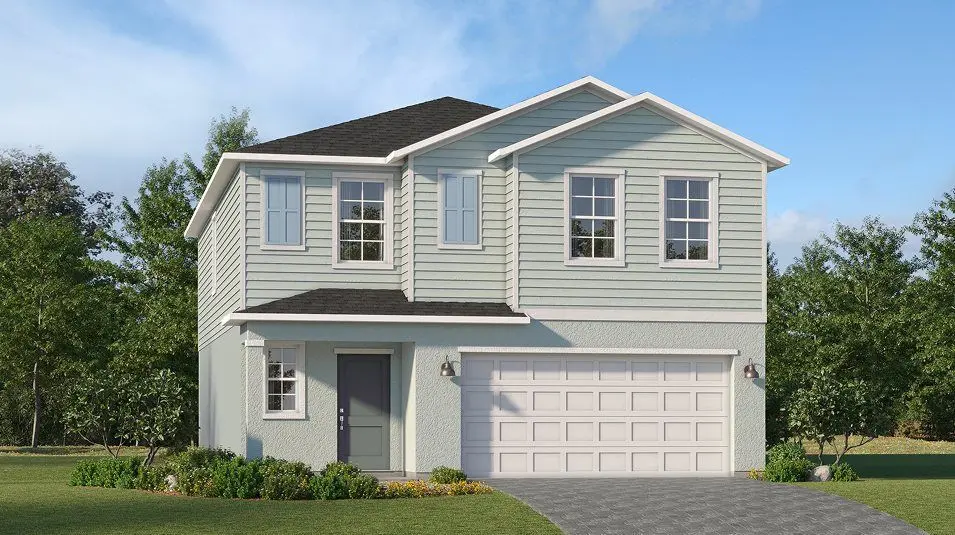
Step inside this spacious 2,112 square foot home and discover an open-concept first floor where the kitchen, living and dining areas flow seamlessly together. The kitchen is a chef's dream, featuring Shaker-style cabinetry with designer hardware, durable quartz countertops, a center island and a full suite of stainless steel appliances. Just off the main living space, an inviting outdoor patio awaits for relaxing or entertaining. Upstairs, five bedrooms encircle a versatile loft, offering plenty of space for family and guests. The owner's suite boasts a generous walk-in closet and a luxurious en-suite bathroom with a quartz-topped vanity and full-width mirror. Throughout the home, you'll fi
Key facts
- Walk-in closet
- En-suite bathroom
- Outdoor patio
Tags
Property features AI
Finance
- Other: Located at 45049 Pipevine Cir, Punta Gorda FL 33982; Listing status: Active; Last modified: 2026-05-20
- Financial info: List price $348,098
Exterior
- Parking: 2 total parking spaces; 2-car garage
- Home design: Single-family new construction (Spec), Edison plan
- Exterior features: Living area of 2,112
Interior
- Bedrooms: 5 bedrooms
- Bathrooms: 2 full bathrooms and 1 half bathroom (2.5 total)
- Interior features: Spec home (Edison plan)
Neighborhood map
What this means for you Summary
Snapshot
- This is a 5-bed/2.5-bath single-family listed at $349k. Condition is rated poor.
Deal economics
- At list price, monthly cash flow is $-203 ($-2k/yr) — negative.
- To cash-flow at today's rent, offer at most $320k (8.4% below list).
- To meet the 1% rule (rent ≥ 1% of price), the offer needs to be $280k (19.9% below list).
- Recommended offer: $280k (19.9% below list) — sets the bar for 1% rule.
- Cap rate 5.6% vs local median 3.6% in North Fort Myers — top-decile yield for the area; either an underpriced asset or a hidden risk that comps aren't pricing in. Stress-test before assuming the spread holds.
Location & tenants
- Location reads 74/100 on livability (#269 in FL, #4,409 nationally) — a middle-class / working-renter tenant base. Strengths: cost of living A+, housing A+, health & safety A+; Watch: employment C-, amenities F, commute F.
- Charlotte (suburban): math 54% / reading 54% proficiency, ranked #22 of 73 in FL (top 30%) — acceptable for families but not a draw, mixed tenant base, ~2y average lease.
- Zoned schools: East Elementary School (math 67% / reading 68%, grade B+, #435 of 2,144 statewide, top 21%, 761 students, 52% FRL); Punta Gorda Middle School (math 54% / reading 52%, grade C+, #209 of 571 statewide, top 37%, 1,120 students, 41% FRL); Charlotte High School (math 44% / reading 46%, grade D-, #228 of 667 statewide, top 35%, 1,994 students, 41% FRL).
- Market conditions: Rents rising fast (+4.1%/yr); 1044 active listings in the ZIP; 4,585 units permitted in Charlotte County in 2024 (703 in 5+ unit buildings).
- At $2,796/mo this rent would consume 46% of the median local household income ($72k/yr) (locally 43% of renters already pay >50% of income on rent) — very limited rent-growth headroom before tenants either downsize or default.
Forward outlook
- Local home prices are declining (-3.0%/yr); year-one equity from $2k of loan paydown is wiped out by about $10k of value loss. Plan a longer hold.
- Charlotte County population projected at +24% by 2050 — long-run rental-demand tailwind backs the buy-and-hold thesis.
Negotiation context
- It's been on market 96 days — a 9% lower offer ($318k) is reasonable based on typical stale-listing flexibility.
Risks & watch-outs
- Climate carrying-cost: severe wind risk, 99% chance of damaging wind over 30y; severe wildfire risk; extreme-heat days projected 7→27/yr by 2055 (HVAC capex compounding) — expect insurance premiums to compound above CPI over the hold.
Questions for the listing agent
- What do current leases actually rent for vs. the listed asking? Can we see a recent rent roll and the last 12 months of T-12 income?
- It's been on market 96 days. Have you received any prior offers? Is the seller open to a 20% concession, seller financing, or rate buy-down credit?
- Have any recent inspections been done? Can we get a copy of the seller's disclosures and any deferred-maintenance estimates?
- Why hasn't it sold? Are there any deal-killer items the seller is aware of (foundation, flood, title, zoning, code violations)?
- Is there a deadline driving the sale (1031 exchange, divorce, estate, relocation)? That informs how much negotiation room exists.
- The area grade is low — what's the realistic commute time and amenity access for the typical tenant pool here? Any planned neighborhood developments (good or bad) we should know about?
- What's the average days-on-market for RENTAL listings here right now (not sales)? A rising rental-DOM trend means longer vacancies and softer asking-rent achievability than the comps imply.
- What's the recent tenant-quality profile in this submarket — average credit score on applications, eviction rate, late-payment / NSF rate, and stable-employment percentage? A property-management company in the area should have these aggregated.
- How much new for-sale + rental construction is in the pipeline within 1–3 miles? Heavy new supply typically softens prices + rents 12–24 months out; constrained supply supports both.
Investment metrics
- 1% rule
- 0.80% ✗
- Cap rate
- 5.59%
- Cash-on-cash
- -2.50%
- DSCR
- 0.89
- GRM
- 10.4
CMA / ARV
No comps found within radius.
Projected returns pro-forma
-3.0% appreciation · 4.13% rent growth · sell at horizon
- IRR
- -19.2%
- Equity multiple
- 0.32×
- Total profit
- $-66,263
- Equity at exit
- $52,052
- IRR
- -9.6%
- Equity multiple
- 0.38×
- Total profit
- $-60,705
- Equity at exit
- $30,184
Cash invested: $97,747 (down + closing). Projections, not guarantees.
Landlord ↔ Tenant lean methodology
- Overall (STATE)
- 87 Strongly Landlord-Friendly
- State Florida
- 87 Strongly Landlord-Friendly · R+3
- County
- — inherits STATE
- City
- — inherits STATE
ZIP-level market 33982
- Home prices YoY
- -1.2%
- Rents YoY
- 4.1%
- Active inventory
- 1044
- Price-to-rent
- 10.4×
Monthly cashflow live
- Estimated rent
- $2,796 medium interval (Pro) →
- Mortgage (P&I)
- −$1,831
- Tax est. 1.5%
- −$436 /mo · $5,236/yr
- Insurance
- −$145
- HOA
- −$0
- Vacancy / Maint / Mgmt
- −$587
- Net cashflow
- $-203
Break-even live
Sensitivity live
| Price | -10% $38 | -5% $-83 | +0% $-203 | +5% $-324 | +10% $-445 |
|---|---|---|---|---|---|
| Rent | -10% $-424 | -5% $-314 | +0% $-203 | +5% $-93 | +10% $18 |
| Rate | -1.0pp $-28 | -0.5pp $-115 | base $-203 | +0.5pp $-294 | +1.0pp $-386 |
UW: 25.0% down · 7.5% · 30yr · 1.5% tax · 5.0% vac · 8.0% maint · 8.0% mgmt
Financing live
Cash to close
- Down payment
- $87,274
- Closing costs
- $10,473
- Reserves months
- —
- Total cash needed
- —
Loan-product check · same deal, 3 products live
Conventional
25% down · 7.5% · 30yr
- Down + closing
- —
- Monthly P&I
- —
- Monthly cashflow
- —
- DSCR
- —
- Eligible?
- —
Personal DTI + credit; lowest rate.
DSCR
20% down · 8.5% · 30yr
- Down + closing
- —
- Monthly P&I
- —
- Monthly cashflow
- —
- DSCR
- —
- Eligible?
- —
No personal income docs; deal must DSCR.
Hard money
10% down · 12.0% · 12mo
- Down + closing
- —
- Monthly P&I
- —
- Monthly cashflow
- —
- DSCR
- —
- Eligible?
- —
Short-term bridge; refi at stabilization.
Listing history 16 events
-
2026-06-22days on market $349,098 Active 96 DOM
-
2026-06-18days on market $349,098 Active 93 DOM
-
2026-06-18remarks 699-char remark
-
2026-06-17days on market $349,098 Active 92 DOM
-
2026-06-16days on market $349,098 Active 91 DOM
-
2026-06-15days on market $349,098 Active 90 DOM
-
2026-06-14days on market $349,098 Active 88 DOM
-
2026-06-13days on market $349,098 Active 87 DOM
-
2026-06-10days on market $349,098 Active 85 DOM
-
2026-06-09days on market $349,098 Active 84 DOM
-
2026-06-08pricedays on market $349,098 Active 83 DOM
-
2026-06-05days on market $348,098 Active 79 DOM
-
2026-06-02days on market $348,098 Active 77 DOM
-
2026-06-01days on market $348,098 Active 76 DOM
-
2026-05-31days on market $348,098 Active 75 DOM
-
2026-05-30days on market $348,098 Active 74 DOM
ⓘ Source: listings_history table (triggers on properties + properties_extension) + one-shot
backfill from property_details.listing_events for pre-trigger history.
Climate risk First Street
- Flood 1/10 Low FEMA zone X (unshaded) · 0% chance over 30 yrs
- Wildfire 8/10 Severe
- Heat 9/10 Extreme 7 d/yr ≥107°F today · 27 d/yr by 30 yrs out
- Wind 10/10 Extreme 99% chance of damaging wind over 30 yrs
- Air quality 2/10 Low 0 unhealthy d/yr today · 3 by 30 yrs out
Nearby sold comps map
Loading sold comps map…
Walkable amenities ~0.75 mi
Loading nearby amenities…
Taxation est. · year 1
- Rental income
- $33,557
- − Mortgage interest
- −$19,555
- − Property taxes
- −$5,236
- − Insurance
- −$1,745
- − Repairs & maintenance
- −$2,685
- − Management
- −$2,685
- − Depreciation
- −$10,156
- Taxable loss
- −$8,504
- Est. tax savings @ 24.0%
- +$2,041
- After-tax cash flow
- $-399/yr
For passive investors: Depreciation is non-cash, so a rental often shows a tax loss while cash-flowing — sheltering income. Rental losses are passive: they offset passive income freely, and up to $25,000/yr can offset ordinary (W-2) income if you actively participate and your MAGI is under $100k (phasing out to $0 by $150k); unused losses carry forward. On sale, claimed depreciation is recaptured at up to 25%, and gains may owe capital-gains tax (a 1031 exchange can defer both). Figures are a year-1 estimate at your 24.0% rate — not tax advice; consult a CPA.
Condition & rehab AI · 1 photo
This home requires extensive repairs and updates across all systems and areas, significantly impacting its current condition and value. Significant investment is needed to bring it up to a livable and marketable standard.
Repairs flagged
- Major roof — No visible roof in the satellite image.
- Major exterior — No visible exterior in the satellite image.
- Major flooring — No visible flooring in the satellite image.
- Major interior walls/paint — No visible interior walls/paint in the satellite image.
- Major bathrooms — No visible bathrooms in the satellite image.
- Major kitchen — No visible kitchen in the satellite image.
- Major systems — No visible systems in the satellite image.
- Major landscaping/curb appeal — No visible landscaping/curb appeal in the satellite image.
Value-add opportunities
- Resale roof replacement — A new roof would significantly improve the home's appearance and value.
- Resale exterior painting/staining — A fresh coat of paint or staining would enhance curb appeal and value.
- Resale flooring replacement — New flooring would improve the home's aesthetic and value.
- Resale interior painting — Fresh paint would improve the home's appearance and value.
- Resale bathroom updates — Updated bathrooms would enhance the home's value and appeal.
- Resale kitchen updates — Updated kitchen would enhance the home's value and appeal.
- Resale system upgrades — Upgraded systems would improve the home's functionality and value.
- Resale landscaping — Landscaping would enhance the home's curb appeal and value.
Renovation cost estimate screening
| Repair item | Severity | Est. cost |
|---|---|---|
| roof · No visible roof in the satellite image. | Major | $15,000–50,000 |
| exterior · No visible exterior in the satellite image. | Major | $15,000–50,000 |
| flooring · No visible flooring in the satellite image. | Major | $15,000–50,000 |
| interior walls/paint · No visible interior walls/paint in the satellite image. | Major | $15,000–50,000 |
| bathrooms · No visible bathrooms in the satellite image. | Major | $15,000–50,000 |
| kitchen · No visible kitchen in the satellite image. | Major | $15,000–50,000 |
| systems · No visible systems in the satellite image. | Major | $15,000–50,000 |
| landscaping/curb appeal · No visible landscaping/curb appeal in the satellite image. | Major | $15,000–50,000 |
| Total estimated repair cost · 8 items | $120,000–400,000 |
Value-add ROI direction
- Resale roof replacement — A new roof would significantly improve the home's appearance and value. ↑
- Resale exterior painting/staining — A fresh coat of paint or staining would enhance curb appeal and value. ↑
- Resale flooring replacement — New flooring would improve the home's aesthetic and value. ↑
- Resale interior painting — Fresh paint would improve the home's appearance and value. ↑
- Resale bathroom updates — Updated bathrooms would enhance the home's value and appeal. ↑
- Resale kitchen updates — Updated kitchen would enhance the home's value and appeal. ↑
- Resale system upgrades — Upgraded systems would improve the home's functionality and value. ↑
- Resale landscaping — Landscaping would enhance the home's curb appeal and value. ↑
ⓘ Cost ranges are severity-bucket heuristics (US national rule-of-thumb). Get contractor quotes + a written scope before underwriting a rehab budget.
Schools (NCES district)
- District
- Charlotte
- NCES district ID
- 1200240
- Math proficiency
- 54% ▼ -6.00%
- Reading proficiency
- 54% ▼ -1.00%
- Median HH income
- $44,864
- Composite
- 45.62/100
- National rank
- #2586
- State rank
- #22 of 73 in FL
Livability — North Fort Myers
- Score
- 74/100
- State rank
- #269
- US rank
- #4409
Category grades
Schools grade is shown separately in the Schools card above.
Census & demographics
- County
- Charlotte County · 196,994 people
- City population
- 57,035
- Metro
- Punta Gorda, FL
- Population (ZIP)
- 13,006
- Household income
- $72,443
- Rent vs Own
- Severe rent burden
- 43.0
Population outlook (Charlotte County) Hauer SSP2
- Today (2025)
- 198,646 people
- By 2030
- 210,507 · +6.0%
- By 2040
- 230,857 · +16.2%
- By 2050
- 247,148 · +24.4%
- By 2075
- 281,777 · +41.8%
- By 2100
- 293,609 · +47.8%
Race, ethnicity, and origin ACS 2023
- Neighborhood character
- Predominantly White (81%)
- Race & ethnicity
- White 81% Two or more races 8% Hispanic / Latino 7% Black 7%
- Hispanic origin (detail)
- Puerto Rican 2% Cuban 3%
- Common ancestry
- Lithuanian 3% Iranian 3% Slovak 3%
- Foreign-born
- 6% · Canada, Jamaica
- Languages at home
- 93% English-only · Spanish 5% German/W. Germanic 1% Arabic 1%
Political lean MEDSL · Charlotte
- 2024 margin
- Solid R (+34.0) · D 32.7% · R 66.7%
- 2008→2024 swing
- -26.7pp toward R · 2008: -7.2pp · 2024: -34.0pp
- All cycles
- 2024: R+34.0 2020: R+26.6 2016: R+27.8 2012: R+14.3 2008: R+7.2
Not yet ingested
- Civics
- —
Market trends
- HPI YoY
- ▼ -5.25%
- Current HPI
- 448.5895
- Rent YoY
- ▲ 4.13%
- Metro
- Punta Gorda, FL
- State GDP YoY
- ▲ 3.28%
- F500 in state
- 36
Industry mix (Fortune 500 HQ in FL)
| Industry | F500 HQs | Revenue |
|---|---|---|
| Industrial Technology | 2 | $29B |
|
||
| Insurance | 2 | $17B |
|
||
| Retail | 1 | $60B |
|
||
| Technology Distribution | 1 | $58B |
|
||
| Homebuilding | 1 | $35B |
|
||
| Technology Manufacturing | 1 | $35B |
|
||
Cash-flow waterfall
monthlySold comps — $/sqft
last 12 mo · ≤1 miLoading sold comps…