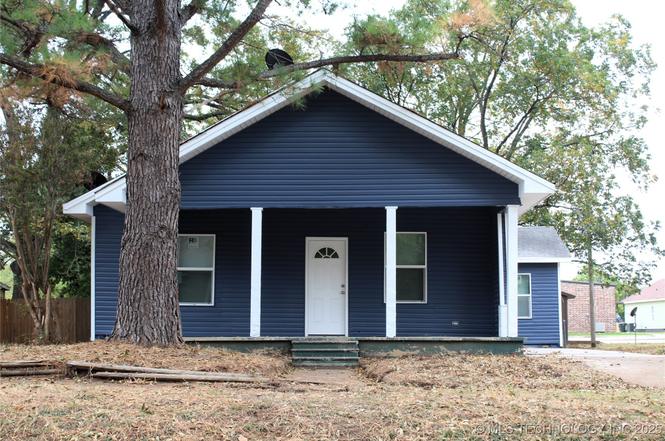
905 W Beech · Durant, OK
Flood risk 5/10 · Moderate
- FEMA flood zone
- X (unshaded)
- Chance of flooding over 30 yrs
- 0.49%
- Est. flood insurance / yr
- $507 – $1,088
Fire risk 4/10 · Minor
- Est. fire insurance / yr
- $2,463 – $4,575
Heat risk 7/10 · Major
- Hot days now (above 111°F)
- 7 days/yr
- Hot days in 30 yrs
- 22 days/yr
Wind risk 4/10 · Minor
- Chance of severe wind over 30 yrs
- 17.0%
Air-quality risk 3/10 · Minor
- Unhealthy air days now
- 2 days/yr
- Unhealthy air days in 30 yrs
- 2 days/yr
Risk factors via First Street. Map © Google.
Why this score? — see what drove the C+ grade
The composite is a weighted blend of 9 inputs, each scored 0–100. Each bar is that input's sub-score; the figure is the points it added to the 100-point composite (weight × sub-score).
- Cash flow +26.2/30.0
- ARV discount +12.1/15.0
- DSCR +8.8/10.0
- 1% rule +5.7/10.0
- Livability +3.1/5.0
- Schools +2.8/10.0
- Rent growth +2.5/5.0
- Condition / age +2.5/5.0
- Appreciation +0.0/10.0
$127,500
🖨 Deal sheet 📄 Offer letter ✓ Due diligence
Listing remarks MLS
Northern Exposure
Key facts
- Remodeled
- Fresh paint
- Stylish fixtures
Tags
Property features AI
Finance
- HOA & community: Sidewalks
Exterior
- Security: No safety shelter
- Utilities: Electricity available; Natural gas available; Public water; Public sewer
- Home design: Single-story home; Faces north; Crawlspace foundation
- Construction: Built with vinyl siding and wood frame; Asphalt/fiberglass roof
- Exterior features: Covered porch; Shed(s) / storage; Chain link fencing
Interior
- Flooring: Carpet; Vinyl
- Bathrooms: 2 full bathrooms
- Heating & cooling: Central heating (electric); Central air conditioning
- Interior features: Granite counters; Stone counters; High ceilings; Ceiling fan(s); Vinyl windows; Electric oven/range connections
- Laundry & utility: Washer hookup; Electric dryer hookup; Gas water heater
Neighborhood map
What this means for you Summary
Snapshot
- This is a 3-bed/1.0-bath single-family listed at $128k.
Deal economics
- At list price, monthly cash flow is $323 ($4k/yr) — positive.
- The deal already cash-flows at list — no discount required.
- Meets the 1% rule at list price ($1k rent vs $128k).
- Recommended offer: $112k (12.0% below list) — sets the bar for market timing.
- Cap rate 9.3% vs local median 3.1% in Durant — top-decile yield for the area; either an underpriced asset or a hidden risk that comps aren't pricing in. Stress-test before assuming the spread holds.
Location & tenants
- Location reads 62/100 on livability (#262 in OK) — a middle-class / working-renter tenant base. Strengths: cost of living A+, housing A+; Watch: health & safety C-, crime D+, schools D-.
- Durant (town): math 30% / reading 37% proficiency, ranked #49 of 270 in OK (top 18%) — families likely to look elsewhere, expect single-tenant / working-renter base with shorter leases.
- Market conditions: Rents soft (-0.1%/yr); 309 active listings in the ZIP; 2 comparable units currently listed for rent nearby; 176 units permitted in Bryan County in 2024 (80 in 5+ unit buildings).
Forward outlook
- Local home prices are declining (-3.0%/yr); year-one equity from $882 of loan paydown is wiped out by about $4k of value loss. Plan a longer hold.
- Bryan County population projected at +26% by 2050 — long-run rental-demand tailwind backs the buy-and-hold thesis.
Negotiation context
- It's been on market 137 days — a 12% lower offer ($112k) is reasonable based on typical stale-listing flexibility.
- 6 sale attempts since 12y ago; this cycle's ask has dropped $12k (8%) from the opening price — seller is motivated, your offer sets the floor, not the list.
- Current owner paid $40k; list at $128k implies a 219% gain — meaningful room to come down on a strong offer.
Risks & watch-outs
- Watch-outs: built in 1938 — expect roof / HVAC / electrical / plumbing capex.
- Climate carrying-cost: moderate flood risk; extreme-heat days projected 7→22/yr by 2055 (HVAC capex compounding) — expect insurance premiums to compound above CPI over the hold.
Questions for the listing agent
- It's been on market 137 days. Have you received any prior offers? Is the seller open to a 12% concession, seller financing, or rate buy-down credit?
- Built in 1938 — when were the roof, HVAC, electrical panel, plumbing, and water heater last replaced?
- Why hasn't it sold? Are there any deal-killer items the seller is aware of (foundation, flood, title, zoning, code violations)?
- Is there a deadline driving the sale (1031 exchange, divorce, estate, relocation)? That informs how much negotiation room exists.
- Schools are D-rated, which usually means shorter tenancies and higher turnover. Who's the typical renter profile here, and what's been the actual vacancy rate?
- Crime grade is D in this area — have there been break-ins, vandalism, or insurance claims at this property in the last 3 years? What carrier currently insures it and at what premium?
- What's the average days-on-market for RENTAL listings here right now (not sales)? A rising rental-DOM trend means longer vacancies and softer asking-rent achievability than the comps imply.
- What's the recent tenant-quality profile in this submarket — average credit score on applications, eviction rate, late-payment / NSF rate, and stable-employment percentage? A property-management company in the area should have these aggregated.
- How much new for-sale + rental construction is in the pipeline within 1–3 miles? Heavy new supply typically softens prices + rents 12–24 months out; constrained supply supports both.
Investment metrics
- 1% rule
- 1.07% ✓
- Cap rate
- 9.34%
- Cash-on-cash
- 10.87%
- DSCR
- 1.48
- GRM
- 7.8
CMA / ARV
- ARV (on-the-fly)
- $142,188
- Comps found
- 12
Show comp detail 12 sales within ~0.75 mi
| Address | Dist | Beds/Ba | Sqft | Sold | Price | $/sf | Match |
|---|---|---|---|---|---|---|---|
| 307 N 8th | 0.08mi | 3/2.0 | 1,228 (+6%) | 6mo | $168,000 | $137 | 77 |
| 421 W Arkansas | 0.40mi | 3/2.0 | 1,212 (+5%) | 1mo | $167,000 | $138 | 69 |
| 1319 W Louisiana St | 0.49mi | 3/2.0 | 1,168 (+1%) | 4mo | $195,000 | $167 | 68 |
| 411 N 7th Ave | 0.18mi | 2/2.0 (-1) | 1,259 (+9%) | 2mo | $38,000 | $30 | 66 |
| 724 N 7th | 0.38mi | 3/2.0 | 1,256 (+9%) | 2mo | $190,000 | $151 | 62 |
| 610 S 13th | 0.63mi | 3/2.0 | 1,200 (+4%) | 4mo | $148,000 | $123 | 57 |
| 1822 W Elm St | 0.67mi | 3/1.0 | 1,232 (+7%) | 1mo | $51,277 | $42 | 57 |
| 515 W Pine | 0.48mi | 2/1.0 (-1) | 1,246 (+8%) | 4mo | $134,000 | $108 | 56 |
| 723 W Locust St | 0.29mi | 2/1.0 (-1) | 990 (-14%) | 4mo | $106,000 | $107 | 55 |
| 409 W Arkansas | 0.42mi | 3/1.0 | 1,008 (-13%) | 6mo | $118,000 | $117 | 54 |
| 923 N 12th Ave | 0.49mi | 2/1.0 (-1) | 1,030 (-11%) | 1mo | $165,000 | $160 | 53 |
| 418 W Georgia | 0.70mi | 2/1.5 (-1) | 1,200 (+4%) | 6mo | $148,000 | $123 | 49 |
Match score weights: distance 35% · size 25% · config 20% · recency 20%. Top-matched comps best support the ARV.
Projected returns pro-forma
-3.0% appreciation · 0.0% rent growth · sell at horizon
- IRR
- -3.2%
- Equity multiple
- 0.88×
- Total profit
- $-4,126
- Equity at exit
- $19,011
- IRR
- 3.2%
- Equity multiple
- 1.20×
- Total profit
- $7,225
- Equity at exit
- $11,024
Cash invested: $35,700 (down + closing). Projections, not guarantees.
Landlord ↔ Tenant lean methodology
- Overall (STATE)
- 83 Strongly Landlord-Friendly
- State Oklahoma
- 83 Strongly Landlord-Friendly · R+20
- County
- — inherits STATE
- City
- — inherits STATE
ZIP-level market 74701
- Home prices YoY
- -11.3%
- Rents YoY
- -0.1%
- Active inventory
- 309
- Price-to-rent
- 7.8×
Monthly cashflow live
- Estimated rent
- $1,366 medium interval (Pro) →
- Mortgage (P&I)
- −$669
- Tax from tax record
- −$34 /mo · $410/yr
- Insurance
- −$53
- HOA
- −$0
- Vacancy / Maint / Mgmt
- −$287
- Net cashflow
- $323
Break-even live
UW: 25.0% down · 7.5% · 30yr · 1.5% tax · 5.0% vac · 8.0% maint · 8.0% mgmt
Financing live
Cash to close
- Down payment
- $31,875
- Closing costs
- $3,825
- Reserves months
- —
- Total cash needed
- —
Loan-product check · same deal, 3 products live
Conventional
25% down · 7.5% · 30yr
- Down + closing
- —
- Monthly P&I
- —
- Monthly cashflow
- —
- DSCR
- —
- Eligible?
- —
Personal DTI + credit; lowest rate.
DSCR
20% down · 8.5% · 30yr
- Down + closing
- —
- Monthly P&I
- —
- Monthly cashflow
- —
- DSCR
- —
- Eligible?
- —
No personal income docs; deal must DSCR.
Hard money
10% down · 12.0% · 12mo
- Down + closing
- —
- Monthly P&I
- —
- Monthly cashflow
- —
- DSCR
- —
- Eligible?
- —
Short-term bridge; refi at stabilization.
Rent comps 2 comps
| Address | Beds | Baths | Sqft | Rent | $/sqft | DOM | Units | Dist |
|---|---|---|---|---|---|---|---|---|
| 2200 W University Blvd Durant, OK | 1.0–2.0 | 1.0 | 803 | $1,000 | $1.25 | 21d | 6 | 1.05mi |
| 112 Wilson St Durant, OK | 2.0–3.0 | 1.0–2.0 | 901 | $975 | $1.08 | 21d | 5 | 1.20mi |
Listing history 21 events
-
2026-05-05status Pending
-
2026-04-28price $127,500
-
2026-03-09status Active
-
2026-02-12status Pending
-
2026-01-26price $134,000
-
2025-11-24status Active
-
2025-11-24$139,000 Active
-
2025-11-01historical
-
2025-08-25status Pending
-
2025-08-18status Active
-
2025-07-21status Pending
-
2025-05-06price $139,000
-
2025-04-25price $144,000
-
2025-03-24price $147,500
-
2025-02-17price $152,900
-
2024-11-01$159,900 Active
-
2014-04-17soldstatus $40,000
-
2014-04-11soldstatus $49,000 17-char remark
Show marketing remark (17 chars)
Northern Exposure
-
2014-03-07$43,000 17-char remark
Show marketing remark (17 chars)
Northern Exposure
-
2010-07-29soldstatus $21,000
-
1997-05-22soldstatus $16,500
ⓘ Source: listings_history table (triggers on properties + properties_extension) + one-shot
backfill from property_details.listing_events for pre-trigger history.
Tax reassessment forecast OK · Resets to sale price
- Current annual tax
- $410 · $34/mo
- Projected year-2 tax
- $1,148 · $96/mo
- Expected delta
- +$738/yr (+$61/mo · 179.9%)
ⓘ Screening estimate from a state-policy table — verify with the county assessor before closing.
Climate risk First Street
- Flood 5/10 Major FEMA zone X (unshaded) · 49% chance over 30 yrs
- Wildfire 4/10 Moderate
- Heat 7/10 Severe 7 d/yr ≥111°F today · 22 d/yr by 30 yrs out
- Wind 4/10 Moderate 17% chance of damaging wind over 30 yrs
- Air quality 3/10 Moderate 2 unhealthy d/yr today · 2 by 30 yrs out
Nearby sold comps map
Loading sold comps map…
Walkable amenities ~0.75 mi
Loading nearby amenities…
Taxation est. · year 1
- Rental income
- $16,394
- − Mortgage interest
- −$7,142
- − Property taxes
- −$410
- − Insurance
- −$638
- − Repairs & maintenance
- −$1,312
- − Management
- −$1,312
- − Depreciation
- −$3,709
- Taxable income
- $1,872
- Est. tax owed @ 24.0%
- −$449
- After-tax cash flow
- $3,431/yr
For passive investors: Depreciation is non-cash, so a rental often shows a tax loss while cash-flowing — sheltering income. Rental losses are passive: they offset passive income freely, and up to $25,000/yr can offset ordinary (W-2) income if you actively participate and your MAGI is under $100k (phasing out to $0 by $150k); unused losses carry forward. On sale, claimed depreciation is recaptured at up to 25%, and gains may owe capital-gains tax (a 1031 exchange can defer both). Figures are a year-1 estimate at your 24.0% rate — not tax advice; consult a CPA.
Schools (NCES district)
- District
- Durant
- NCES district ID
- 4010350
- Math proficiency
- 30% ▼ -11.00%
- Reading proficiency
- 37% ▼ -7.00%
- Median HH income
- $35,850
- Composite
- 27.73/100
- National rank
- #6903
- State rank
- #49 of 270 in OK
Livability — Durant
- Score
- 62/100
- State rank
- #262
- US rank
- #17020
Category grades
Schools grade is shown separately in the Schools card above.
Census & demographics
- Census place
- Durant, OK
- County
- Bryan County · 27,497 people
- City population
- 27,497
- Metro
- Durant, OK
- Population (ZIP)
- 27,497
- Household income
- $58,036
- Rent vs Own
- Severe rent burden
- 759.0
Population outlook (Bryan County) Hauer SSP2
- Today (2025)
- 50,265 people
- By 2030
- 52,866 · +5.2%
- By 2040
- 58,018 · +15.4%
- By 2050
- 63,073 · +25.5%
- By 2075
- 74,439 · +48.1%
- By 2100
- 81,743 · +62.6%
Race, ethnicity, and origin ACS 2023
- Neighborhood character
- Diverse neighborhood (Simpson 0.56)
- Race & ethnicity
- White 65% Native American 14% Two or more races 13% Hispanic / Latino 9% Black 3%
- Hispanic origin (detail)
- Mexican 7%
- Common ancestry
- Italian 1% Slovak 1% Serbian 1%
- Foreign-born
- 3% · Canada
- Languages at home
- 94% English-only · Spanish 5% Other Indo-European 1%
Political lean MEDSL · Bryan
- 2024 margin
- Solid R (+58.5) · D 20.0% · R 78.6% · Other 1.4%
- 2008→2024 swing
- -23.0pp toward R · 2008: -35.5pp · 2024: -58.5pp
- All cycles
- 2024: R+58.5 2020: R+56.5 2016: R+55.6 2012: R+44.5 2008: R+35.5
Not yet ingested
- Civics
- —
Market trends
- HPI YoY
- ▼ -38.66%
- Current HPI
- 303.3877
- Rent YoY
- ▼ -0.13%
- Metro
- Durant, OK
- State GDP YoY
- ▲ 1.55%
- F500 in state
- 6
Industry mix (Fortune 500 HQ in OK)
| Industry | F500 HQs | Revenue |
|---|---|---|
| Energy | 3 | $48B |
|
||
Price history
+672.7% since first listed21 events — show timeline
- 2026-05-05 Pending — MLS Technology, Inc.
- 2026-04-28 Price Changed $127,500 MLS Technology, Inc.
- 2026-03-09 Relisted — MLS Technology, Inc.
- 2026-02-12 Pending — MLS Technology, Inc.
- 2026-01-26 Price Changed $134,000 MLS Technology, Inc.
- 2025-11-24 Relisted — MLS Technology, Inc.
- 2025-11-24 Listed $139,000 MLS Technology, Inc.
- 2025-11-01 Listing Removed — MLS Technology, Inc.
- 2025-08-25 Pending — MLS Technology, Inc.
- 2025-08-18 Relisted — MLS Technology, Inc.
- 2025-07-21 Pending — MLS Technology, Inc.
- 2025-05-06 Price Changed $139,000 MLS Technology, Inc.
- 2025-04-25 Price Changed $144,000 MLS Technology, Inc.
- 2025-03-24 Price Changed $147,500 MLS Technology, Inc.
- 2025-02-17 Price Changed $152,900 MLS Technology, Inc.
- 2024-11-01 Listed $159,900 MLS Technology, Inc.
- 2014-04-17 Sold (Public Records) $40,000 Public Records
- 2014-04-11 Sold (MLS) $49,000 MLS Technology, Inc.
- 2014-03-07 Listed $43,000 MLS Technology, Inc.
- 2010-07-29 Sold (Public Records) $21,000 Public Records
- 1997-05-22 Sold (Public Records) $16,500 Public Records
Property tax history
+4.3%/yrLatest (2025): $410 · -2.8% YoY. Source: county tax records.
Cash-flow waterfall
monthlySold comps — $/sqft
last 12 mo · ≤1 miLoading sold comps…