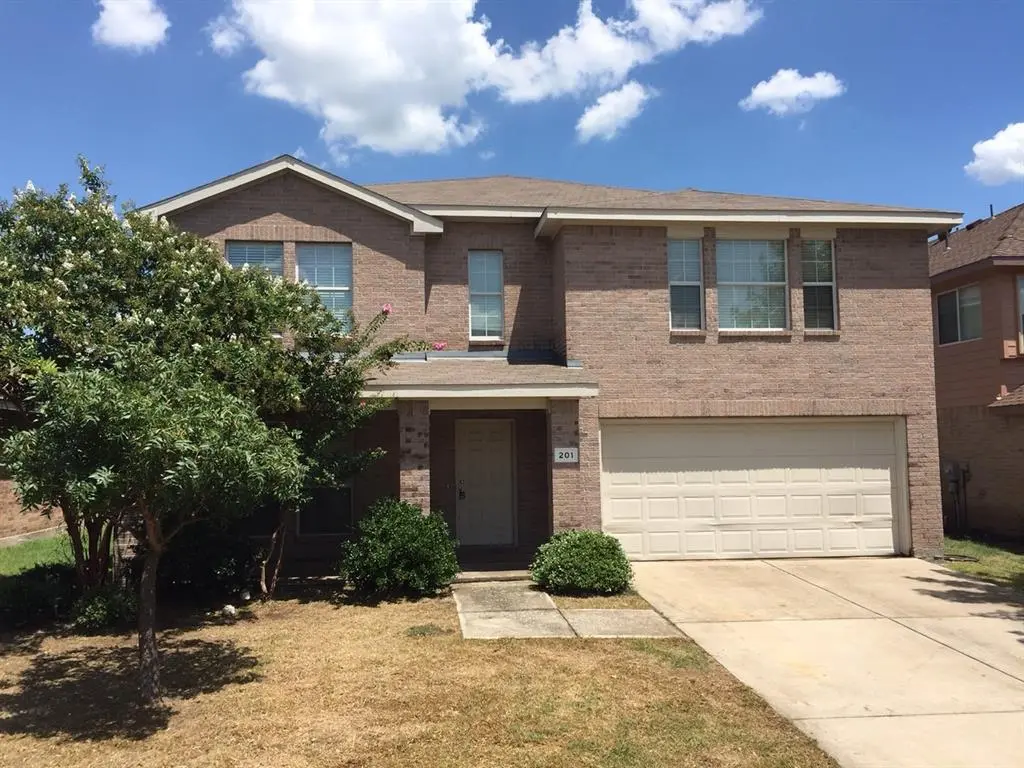
201 Pagoda Dr · Anna, TX
Flood risk 1/10 · Minimal
- FEMA flood zone
- X (unshaded)
- Chance of flooding over 30 yrs
- 0.0%
- Est. flood insurance / yr
- $507 – $1,088
Fire risk 6/10 · Moderate
- Est. fire insurance / yr
- $1,222 – $2,270
Heat risk 7/10 · Major
- Hot days now (above 110°F)
- 7 days/yr
- Hot days in 30 yrs
- 24 days/yr
Wind risk 5/10 · Moderate
- Chance of severe wind over 30 yrs
- 26.0%
Air-quality risk 3/10 · Minor
- Unhealthy air days now
- 3 days/yr
- Unhealthy air days in 30 yrs
- 3 days/yr
Risk factors via First Street. Map © Google.
Why this score? — see what drove the D- grade
The composite is a weighted blend of 9 inputs, each scored 0–100. Each bar is that input's sub-score; the figure is the points it added to the 100-point composite (weight × sub-score).
- ARV discount +15.0/15.0
- Cash flow +7.7/30.0
- Schools +3.8/10.0
- Livability +3.8/5.0
- 1% rule +3.2/10.0
- Condition / age +2.5/5.0
- Rent growth +2.0/5.0
- DSCR +1.8/10.0
- Appreciation +0.0/10.0
$324,000
🖨 Deal sheet 📄 Offer letter ✓ Due diligence
Listing remarks MLS
RARE 5 BEDROOM FOR SALE, READY FOR MOVE IN OR REMODEL
Key facts
- 6,534 sq ft lot
- 2 garage spots
- Built 2006
Neighborhood map
What this means for you Summary
Snapshot
- This is a 4-bed/2.5-bath single-family listed at $324k.
Deal economics
- At list price, monthly cash flow is $-374 ($-4k/yr) — negative.
- To cash-flow at today's rent, offer at most $258k (20.4% below list).
- To meet the 1% rule (rent ≥ 1% of price), the offer needs to be $264k (18.4% below list).
- Recommended offer: $258k (20.4% below list) — sets the bar for cash-flow.
- Cap rate 4.9% vs local median 3.6% in Anna — top-decile yield for the area; either an underpriced asset or a hidden risk that comps aren't pricing in. Stress-test before assuming the spread holds.
Location & tenants
- Location reads 75/100 on livability (#127 in TX, #3,880 nationally) — a middle-class / working-renter tenant base. Strengths: employment A+, housing A+, crime A; Watch: amenities F, commute F.
- Anna ISD (rural): math 44% / reading 41% proficiency, ranked #271 of 826 in TX (top 33%) — families likely to look elsewhere, expect single-tenant / working-renter base with shorter leases.
- Market conditions: Rents soft (-1.9%/yr); 1199 active listings in the ZIP; 40 comparable units currently listed for rent nearby; rentals at typical pace (median 25d on market — plan ~3-4 weeks tenant-placement turnaround); solid renter incomes; 19,194 units permitted in Collin County in 2024 (3,988 in 5+ unit buildings).
- This rent runs 30% of the median local income ($105k/yr) — at the standard rent-burdened threshold; future hikes will face affordability resistance.
Forward outlook
- Local home prices are declining (-3.0%/yr); year-one equity from $2k of loan paydown is wiped out by about $10k of value loss. Plan a longer hold.
- Collin County population projected at +60% by 2050 — long-run rental-demand tailwind backs the buy-and-hold thesis.
Negotiation context
- It's been on market 77 days — a 6% lower offer ($305k) is reasonable based on typical stale-listing flexibility.
- 3 sale attempts since 9y ago with the ask held roughly flat each time — persistent listings suggest the price (not the market) is what's stuck; bring a comps-based counter.
Risks & watch-outs
- Climate carrying-cost: moderate wind risk, 26% chance of damaging wind over 30y; major wildfire risk; extreme-heat days projected 7→24/yr by 2055 (HVAC capex compounding) — expect insurance premiums to compound above CPI over the hold.
Questions for the listing agent
- What do current leases actually rent for vs. the listed asking? Can we see a recent rent roll and the last 12 months of T-12 income?
- It's been on market 77 days. Have you received any prior offers? Is the seller open to a 20% concession, seller financing, or rate buy-down credit?
- What does the HOA fee cover, when was the last increase, and are there any pending special assessments or reserve-fund shortfalls?
- Why hasn't it sold? Are there any deal-killer items the seller is aware of (foundation, flood, title, zoning, code violations)?
- Is there a deadline driving the sale (1031 exchange, divorce, estate, relocation)? That informs how much negotiation room exists.
- Schools are B-rated — typically a magnet for longer-tenancy family renters. What's the average tenant stay here, and is there a school-zone premium baked into asking?
- The area grade is low — what's the realistic commute time and amenity access for the typical tenant pool here? Any planned neighborhood developments (good or bad) we should know about?
- What's the average days-on-market for RENTAL listings here right now (not sales)? A rising rental-DOM trend means longer vacancies and softer asking-rent achievability than the comps imply.
- What's the recent tenant-quality profile in this submarket — average credit score on applications, eviction rate, late-payment / NSF rate, and stable-employment percentage? A property-management company in the area should have these aggregated.
- How much new for-sale + rental construction is in the pipeline within 1–3 miles? Heavy new supply typically softens prices + rents 12–24 months out; constrained supply supports both.
Investment metrics
- 1% rule
- 0.82% ✗
- Cap rate
- 4.91%
- Cash-on-cash
- -4.95%
- DSCR
- 0.78
- GRM
- 10.2
CMA / ARV
- ARV (median comp)
- $408,213
- List price
- $324,000
- Delta
- -20.63%
- Verdict
- UNDERPRICED
- Comps
- 20 within 1.0 mi
Show comp detail 12 sales within ~0.75 mi
| Address | Dist | Beds/Ba | Sqft | Sold | Price | $/sf | Match |
|---|---|---|---|---|---|---|---|
| 1012 Honeywell Dr | 0.13mi | 4/3.0 | 2,751 (-1%) | 8mo | $377,700 | $137 | 84 |
| 1128 Honeywell Dr | 0.20mi | 4/2.5 | 2,642 (-5%) | 7mo | $333,000 | $126 | 77 |
| 1017 Sheldon Dr | 0.31mi | 4/3.5 | 2,650 (-4%) | 0mo | $397,500 | $150 | 74 |
| 825 Sequoia Dr | 0.22mi | 4/2.5 | 2,920 (+6%) | 9mo | $344,500 | $118 | 73 |
| 910 Calder Ct | 0.28mi | 4/3.0 | 2,989 (+8%) | 4mo | $530,000 | $177 | 68 |
| 412 Acklington Dr | 0.23mi | 4/3.0 | 2,460 (-11%) | 2mo | $349,900 | $142 | 67 |
| 1001 Acacia Dr | 0.08mi | 4/2.5 | 2,372 (-14%) | 8mo | $305,000 | $129 | 66 |
| 817 Sequoia Dr | 0.23mi | 4/2.5 | 2,426 (-12%) | 6mo | $334,000 | $138 | 63 |
| 1705 Willowhurst Ln | 0.74mi | 4/3.0 | 2,759 (-0%) | 5mo | $479,999 | $174 | 59 |
| 321 Bankhurst Dr | 0.37mi | 4/3.0 | 2,477 (-10%) | 6mo | $390,000 | $157 | 58 |
| 1700 Willowhurst Ln | 0.74mi | 4/3.0 | 2,886 (+4%) | 6mo | $474,990 | $165 | 52 |
| 1700 Ambergate Dr | 0.68mi | 4/3.0 | 2,381 (-14%) | 4mo | $498,525 | $209 | 39 |
Match score weights: distance 35% · size 25% · config 20% · recency 20%. Top-matched comps best support the ARV.
Projected returns pro-forma
-3.0% appreciation · 0.0% rent growth · sell at horizon
- IRR
- -28.4%
- Equity multiple
- 0.08×
- Total profit
- $-83,891
- Equity at exit
- $48,309
- IRR
- -47.7%
- Equity multiple
- -0.47×
- Total profit
- $-132,946
- Equity at exit
- $28,014
Cash invested: $90,720 (down + closing). Projections, not guarantees.
Landlord ↔ Tenant lean methodology
- Overall (STATE)
- 87 Strongly Landlord-Friendly
- State Texas
- 87 Strongly Landlord-Friendly · R+5
- County
- — inherits STATE
- City
- — inherits STATE
ZIP-level market 75409
- Home prices YoY
- -20.1%
- Rents YoY
- -1.9%
- Active inventory
- 1199
- Price-to-rent
- 10.2×
Monthly cashflow live
- Estimated rent
- $2,644 high interval (Pro) →
- Mortgage (P&I)
- −$1,699
- Tax from tax record
- −$608 /mo · $7,293/yr
- Insurance
- −$135
- HOA
- −$21
- Vacancy / Maint / Mgmt
- −$555
- Net cashflow
- $-374
Break-even live
UW: 25.0% down · 7.5% · 30yr · 1.5% tax · 5.0% vac · 8.0% maint · 8.0% mgmt
Financing live
Cash to close
- Down payment
- $81,000
- Closing costs
- $9,720
- Reserves months
- —
- Total cash needed
- —
Loan-product check · same deal, 3 products live
Conventional
25% down · 7.5% · 30yr
- Down + closing
- —
- Monthly P&I
- —
- Monthly cashflow
- —
- DSCR
- —
- Eligible?
- —
Personal DTI + credit; lowest rate.
DSCR
20% down · 8.5% · 30yr
- Down + closing
- —
- Monthly P&I
- —
- Monthly cashflow
- —
- DSCR
- —
- Eligible?
- —
No personal income docs; deal must DSCR.
Hard money
10% down · 12.0% · 12mo
- Down + closing
- —
- Monthly P&I
- —
- Monthly cashflow
- —
- DSCR
- —
- Eligible?
- —
Short-term bridge; refi at stabilization.
Rent comps 40 comps
| Address | Beds | Baths | Sqft | Rent | $/sqft | DOM | Units | Dist |
|---|---|---|---|---|---|---|---|---|
| 217 Bonsai Dr Anna, TX | 4.0 | 3.5 | 2445 | $2,250 | $0.92 | 5d | 1 | 0.06mi |
| 1117 Acacia Dr Anna, TX | 4.0 | 2.5 | 2539 | $2,450 | $0.96 | 44d | 1 | 0.21mi |
| 300 Kelvington Dr Anna, TX | 4.0 | 2.0 | 2045 | $2,195 | $1.07 | 19d | 1 | 0.21mi |
| 1140 Honeywell Dr Anna, TX | 4.0 | 2.5 | 2736 | $2,095 | $0.77 | 44d | 1 | 0.24mi |
| 213 Cedar Canyon Dr Anna, TX | 4.0 | 2.5 | 2234 | $2,295 | $1.03 | 44d | 1 | 0.28mi |
| 419 Salisbury Dr Anna, TX | 5.0 | 3.5 | 3434 | $3,200 | $0.93 | 2d | 1 | 0.29mi |
| 401 Bamborough Dr Anna, TX | 5.0 | 3.0 | 3029 | $3,500 | $1.16 | 24d | 1 | 0.29mi |
| 512 Eastbrook Dr Anna, TX | 4.0 | 2.0 | 2056 | $3,200 | $1.56 | 24d | 1 | 0.33mi |
| 1113 Sheldon Dr Anna, TX | 4.0 | 3.0 | 2095 | $2,380 | $1.14 | 24d | 1 | 0.33mi |
| 1215 Crescent View Dr Anna, TX | 4.0 | 2.5 | 2355 | $2,299 | $0.98 | 44d | 1 | 0.35mi |
| 1215 Crescent View Dr Anna, TX | 4.0 | 2.5 | 2355 | $2,299 | $0.98 | 22d | 1 | 0.35mi |
| 1017 Chatsworth Dr Anna, TX | 4.0 | 2.5 | 2650 | $2,550 | $0.96 | 44d | 1 | 0.35mi |
| 1313 Forest Haven Dr Anna, TX | 4.0 | 2.5 | 2154 | $2,750 | $1.28 | 5d | 1 | 0.36mi |
| 1313 Cristiano Ln Anna, TX | 5.0 | 3.5 | 2703 | $2,599 | $0.96 | 44d | 1 | 0.41mi |
| 1008 Faringdon Dr Anna, TX | 4.0 | 2.0 | 2154 | $2,599 | $1.21 | 2d | 1 | 0.42mi |
| 512 Tartane Dr Anna, TX | 3.0 | 2.0 | 1974 | $2,190 | $1.11 | 44d | 1 | 0.46mi |
| 817 Edinburgh Dr Anna, TX | 4.0 | 2.0 | 2338 | $2,400 | $1.03 | 44d | 1 | 0.49mi |
| 220 Santa Lucia Dr Anna, TX | 5.0 | 4.0 | 2674 | $2,649 | $0.99 | 44d | 1 | 0.49mi |
| 501 Amenduni Ln Anna, TX | 4.0 | 2.0 | 1981 | $2,250 | $1.14 | 44d | 1 | 0.50mi |
| 312 Santa Lucia Dr Anna, TX | 4.0 | 4.5 | 3719 | $3,350 | $0.90 | 13d | 1 | 0.51mi |
| 312 Santa Lucia Dr Anna, TX | 5.0 | 4.5 | 3719 | $3,400 | $0.91 | 24d | 1 | 0.51mi |
| 312 Santa Lucia Dr Anna, TX | 4.0 | 4.5 | 3719 | $3,400 | $0.91 | 24d | 1 | 0.51mi |
| 517 Amenduni Ln Anna, TX | 4.0 | 2.0 | 1983 | $2,345 | $1.18 | 24d | 1 | 0.53mi |
| 826 Hazels Way Anna, TX | 4.0 | 2.5 | 2084 | $2,400 | $1.15 | 44d | 1 | 0.54mi |
| 833 Bens Dr Anna, TX | 4.0 | 2.0 | 2701 | $2,340 | $0.87 | 44d | 1 | 0.55mi |
| 904 Isabel Dr Anna, TX | 4.0 | 2.5 | 2046 | $2,475 | $1.21 | 44d | 1 | 0.56mi |
| 1009 Tree Shadow Ln Anna, TX | 4.0 | 3.0 | 3266 | $2,750 | $0.84 | 24d | 1 | 0.58mi |
| 1605 Fields View Dr Anna, TX | 4.0 | 2.5 | 2111 | $2,195 | $1.04 | 21d | 1 | 0.62mi |
| 1608 Helmoken Falls Dr Anna, TX | 4.0 | 2.0 | 2010 | $2,295 | $1.14 | 2d | 1 | 0.63mi |
| 701 Santa Lucia Dr Anna, TX | 4.0 | 3.5 | 2253 | $2,250 | $1.00 | 22d | 1 | 0.63mi |
| 916 Lido Ln Anna, TX | 4.0 | 3.5 | 2346 | $2,300 | $0.98 | 7d | 1 | 0.65mi |
| 916 Lido Ln Anna, TX | 4.0 | 3.5 | 2346 | $2,300 | $0.98 | 13d | 1 | 0.65mi |
| 736 Portina Dr Anna, TX | 4.0 | 3.5 | 2819 | $2,695 | $0.96 | 24d | 1 | 0.66mi |
| 808 Portina Dr Anna, TX | 4.0 | 3.0 | 2250 | $2,250 | $1.00 | 44d | 1 | 0.67mi |
| 1200 Renato Dr Anna, TX | 4.0 | 3.5 | 3022 | $3,995 | $1.32 | 6d | 1 | 0.68mi |
| 905 Tartane Dr Anna, TX | 4.0 | 4.5 | 3804 | $3,495 | $0.92 | 17d | 1 | 0.69mi |
| 820 Portina Dr Anna, TX | 4.0 | 2.5 | 2280 | $2,590 | $1.14 | 44d | 1 | 0.69mi |
| 913 Amenduni Ln Anna, TX | 4.0 | 2.5 | 2259 | $2,350 | $1.04 | 13d | 1 | 0.73mi |
| 1808 Willowhurst Ln Anna, TX | 3.0 | 2.0 | 2114 | $2,550 | $1.21 | 6d | 1 | 0.79mi |
| 249 Niagara Falls Dr Anna, TX | 4.0 | 2.5 | 2709 | $2,495 | $0.92 | 4d | 1 | 0.79mi |
HOA detail
- Monthly dues
- $21 · $252/yr
Listing history 24 events
-
2026-06-18days on market $324,000 Active 77 DOM
-
2026-06-17price $324,000 Active 76 DOM
-
2026-06-17days on market $325,000 Active 76 DOM
-
2026-06-16days on market $325,000 Active 75 DOM
-
2026-06-15days on market $325,000 Active 74 DOM
-
2026-06-13days on market $325,000 Active 72 DOM
-
2026-06-13days on market $325,000 Active 71 DOM
-
2026-06-09days on market $325,000 Active 68 DOM
-
2026-06-08days on market $325,000 Active 67 DOM
-
2026-06-07days on market $325,000 Active 66 DOM
-
2026-06-04days on market $325,000 Active 63 DOM
-
2026-06-03days on market $325,000 Active 62 DOM
-
2026-06-02days on market $325,000 Active 61 DOM
-
2026-06-01days on market $325,000 Active 60 DOM
-
2026-05-31days on market $325,000 Active 59 DOM
-
2026-04-14price $325,000 53-char remark
Show marketing remark (53 chars)
RARE 5 BEDROOM FOR SALE, READY FOR MOVE IN OR REMODEL
-
2026-04-09price $329,900 53-char remark
Show marketing remark (53 chars)
RARE 5 BEDROOM FOR SALE, READY FOR MOVE IN OR REMODEL
-
2026-04-02$335,000 Active 53-char remark
Show marketing remark (53 chars)
RARE 5 BEDROOM FOR SALE, READY FOR MOVE IN OR REMODEL
-
2025-12-31historical
-
2025-08-03$370,000 Active
-
2017-11-01historical
-
2017-08-28price $235,000
-
2017-08-04price $239,000
-
2017-07-20$245,000 Active
ⓘ Source: listings_history table (triggers on properties + properties_extension) + one-shot
backfill from property_details.listing_events for pre-trigger history.
Tax reassessment forecast TX · Resets to sale price
- Current annual tax
- $7,293 · $608/mo
- Projected year-2 tax
- $7,293 · $608/mo
- Expected delta
- $0/yr ($0/mo · 0.0%)
ⓘ Screening estimate from a state-policy table — verify with the county assessor before closing.
Climate risk First Street
- Flood 1/10 Low FEMA zone X (unshaded) · 0% chance over 30 yrs
- Wildfire 6/10 Major
- Heat 7/10 Severe 7 d/yr ≥110°F today · 24 d/yr by 30 yrs out
- Wind 5/10 Major 26% chance of damaging wind over 30 yrs
- Air quality 3/10 Moderate 3 unhealthy d/yr today · 3 by 30 yrs out
Nearby sold comps map
Loading sold comps map…
Walkable amenities ~0.75 mi
Loading nearby amenities…
Taxation est. · year 1
- Rental income
- $31,730
- − Mortgage interest
- −$18,149
- − Property taxes
- −$7,293
- − Insurance
- −$1,620
- − Repairs & maintenance
- −$2,538
- − Management
- −$2,538
- − HOA
- −$252
- − Depreciation
- −$9,425
- Taxable loss
- −$10,086
- Est. tax savings @ 24.0%
- +$2,421
- After-tax cash flow
- $-2,067/yr
For passive investors: Depreciation is non-cash, so a rental often shows a tax loss while cash-flowing — sheltering income. Rental losses are passive: they offset passive income freely, and up to $25,000/yr can offset ordinary (W-2) income if you actively participate and your MAGI is under $100k (phasing out to $0 by $150k); unused losses carry forward. On sale, claimed depreciation is recaptured at up to 25%, and gains may owe capital-gains tax (a 1031 exchange can defer both). Figures are a year-1 estimate at your 24.0% rate — not tax advice; consult a CPA.
Schools (NCES district)
- District
- Anna ISD
- NCES district ID
- 4808340
- Math proficiency
- 44% ▼ -9.00%
- Reading proficiency
- 41% ▼ -4.00%
- Median HH income
- $67,456
- Composite
- 38.26/100
- National rank
- #4241
- State rank
- #271 of 826 in TX
Livability — Anna
- Score
- 75/100
- State rank
- #127
- US rank
- #3880
Category grades
Schools grade is shown separately in the Schools card above.
Census & demographics
- Census place
- Anna, TX
- County
- Collin County · 1,159,394 people
- City population
- 27,131
- Metro
- Dallas-Fort Worth-Arlington, TX
- Population (ZIP)
- 27,131
- Household income
- $104,814
- Rent vs Own
- Severe rent burden
- 454.0
Population outlook (Collin County) Hauer SSP2
- Today (2025)
- 1,210,074 people
- By 2030
- 1,358,201 · +12.2%
- By 2040
- 1,654,061 · +36.7%
- By 2050
- 1,937,359 · +60.1%
- By 2075
- 2,567,039 · +112.1%
- By 2100
- 2,952,048 · +144.0%
Race, ethnicity, and origin ACS 2023
- Neighborhood character
- Diverse neighborhood (Simpson 0.56)
- Race & ethnicity
- White 61% Hispanic / Latino 20% Black 15% Two or more races 6% Asian 1%
- Hispanic origin (detail)
- Mexican 16% Puerto Rican 1%
- Common ancestry
- Italian 3% Lithuanian 2% Slovak 1%
- Foreign-born
- 10% · Canada
- Languages at home
- 79% English-only · Spanish 18% French/Haitian/Cajun 2%
Political lean MEDSL · Collin
- 2024 margin
- R (+11.1) · D 43.1% · R 54.3% · Other 2.6%
- 2008→2024 swing
- +14.4pp toward D · 2008: -25.6pp · 2024: -11.1pp
- All cycles
- 2024: R+11.1 2020: R+4.3 2016: R+17.0 2012: R+31.6 2008: R+25.6
Not yet ingested
- Civics
- —
Market trends
- HPI YoY
- ▼ -58.99%
- Current HPI
- 235.0945
- Rent YoY
- ▼ -1.92%
- Metro
- Dallas-Fort Worth-Arlington, TX
- State GDP YoY
- ▲ 3.95%
- F500 in state
- 110
Industry mix (Fortune 500 HQ in TX)
| Industry | F500 HQs | Revenue |
|---|---|---|
| Energy | 16 | $1,198B |
|
||
| Technology | 5 | $198B |
|
||
| Engineering / Construction | 4 | $72B |
|
||
| Energy Services | 3 | $60B |
|
||
| Utilities | 3 | $41B |
|
||
| Healthcare | 2 | $330B |
|
||
Price history
+32.7% since first listed9 events — show timeline
- 2026-04-14 Price Changed $325,000 NTREIS
- 2026-04-09 Price Changed $329,900 NTREIS
- 2026-04-02 Listed $335,000 NTREIS
- 2025-12-31 Listing Removed — NTREIS
- 2025-08-03 Listed $370,000 NTREIS
- 2017-11-01 Listing Removed — NTREIS
- 2017-08-28 Price Changed $235,000 NTREIS
- 2017-08-04 Price Changed $239,000 NTREIS
- 2017-07-20 Listed $245,000 NTREIS
Property tax history
+3.8%/yrLatest (2025): $7,293 · -2.3% YoY. Source: county tax records.
Cash-flow waterfall
monthlySold comps — $/sqft
last 12 mo · ≤1 miLoading sold comps…