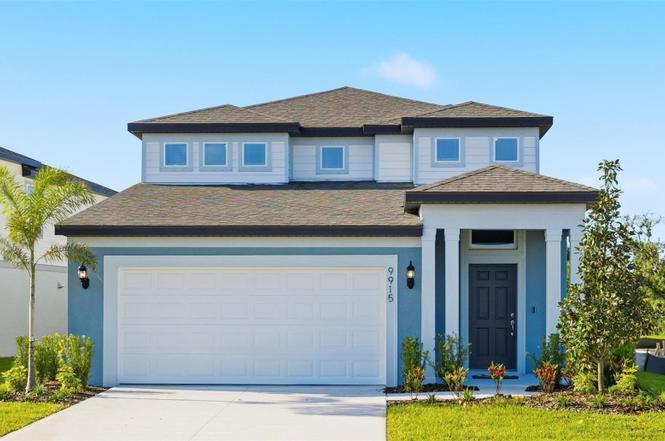
9915 Trellis Vine Way · Parrish, FL
Flood risk No data
- FEMA flood zone
- —
- Chance of flooding over 30 yrs
- —
- Est. flood insurance / yr
- —
Fire risk No data
- Est. fire insurance / yr
- —
Heat risk No data
- Hot days now (above threshold)
- —
- Hot days in 30 yrs
- —
Wind risk No data
- Chance of severe wind over 30 yrs
- —
Air-quality risk No data
- Unhealthy air days now
- —
- Unhealthy air days in 30 yrs
- —
Risk factors via First Street. Map © Google.
Why this score? — see what drove the F grade
The composite is a weighted blend of 9 inputs, each scored 0–100. Each bar is that input's sub-score; the figure is the points it added to the 100-point composite (weight × sub-score).
- Cash flow +9.3/30.0
- ARV discount +7.5/15.0
- Schools +4.4/10.0
- DSCR +2.6/10.0
- Livability +2.5/5.0
- Condition / age +2.5/5.0
- 1% rule +2.3/10.0
- Rent growth +2.3/5.0
- Appreciation +0.0/10.0
$425,340
🖨 Deal sheet (PDF) 📄 Offer letter ✓ Due diligence
Listing remarks
One or more photo(s) has been virtually staged. Move in Ready Available NOW!! Pulte is selling in Oakfield Trails! Located just 3 miles from I-75, discover an elevated lifestyle within a vibrant community, where modern design meets hometown hospitality, and the timeless charm of Florida takes center stage. Residents of Oakfield Trails will enjoy access to the Harvest Social Club in including a Fitness Center, Pool with slide Tower, gathering spaces, restaurant and much more. The Pinecrest is designed with flexibility in mind, offering open living spaces and a versatile loft that’s perfect for relaxing or entertaining. Its thoughtful design adapts easily to your lifestyle. The gourmet
Key facts
- Quartz countertops
- Fitness center
- Large center island
Tags
Neighborhood map
What this means for you Summary
Snapshot
- This is a 4-bed/3.0-bath land listed at $425k.
Deal economics
- At list price, monthly cash flow is $-311 ($-4k/yr) — negative.
- To cash-flow at today's rent, offer at most $370k (12.9% below list).
- To meet the 1% rule (rent ≥ 1% of price), the offer needs to be $312k (26.7% below list).
- Recommended offer: $312k (26.7% below list) — sets the bar for 1% rule.
Location & tenants
- Location reads: area grade F — affects rentability + tenant quality, not the cash-flow math above.
- Manatee (suburban): math 54% / reading 50% proficiency, ranked #26 of 73 in FL (top 36%) — acceptable for families but not a draw, mixed tenant base, ~2y average lease.
- Zoned schools: Barbara A Harvey Elementary School (math 74% / reading 59%, grade B+, #473 of 2,144 statewide, top 23%, 1,069 students, 33% FRL); Buffalo Creek Middle School (math 59% / reading 51%, grade B-, #180 of 571 statewide, top 32%, 1,127 students, 44% FRL); Parrish Community High School (math 47% / reading 57%, grade D+, #160 of 667 statewide, top 25%, 2,017 students, 32% FRL).
- Market conditions: Rents soft (-0.9%/yr); 2194 active listings in the ZIP; 23 comparable units currently listed for rent nearby; rentals at typical pace (median 18d on market — plan ~3-4 weeks tenant-placement turnaround); high-income renter base; 7,472 units permitted in Manatee County in 2024 (1,782 in 5+ unit buildings).
- This rent runs 33% of the median local income ($114k/yr) — at the standard rent-burdened threshold; future hikes will face affordability resistance.
Forward outlook
- Local home prices are declining (-3.0%/yr); year-one equity from $3k of loan paydown is wiped out by about $13k of value loss. Plan a longer hold.
- Manatee County population projected at +43% by 2050 — long-run rental-demand tailwind backs the buy-and-hold thesis.
Negotiation context
- It's been on market 141 days — a 12% lower offer ($374k) is reasonable based on typical stale-listing flexibility.
- 2 sale attempts with the ask held roughly flat each time — persistent listings suggest the price (not the market) is what's stuck; bring a comps-based counter.
Questions for the listing agent
- What do current leases actually rent for vs. the listed asking? Can we see a recent rent roll and the last 12 months of T-12 income?
- It's been on market 141 days. Have you received any prior offers? Is the seller open to a 27% concession, seller financing, or rate buy-down credit?
- What does the HOA fee cover, when was the last increase, and are there any pending special assessments or reserve-fund shortfalls?
- Why hasn't it sold? Are there any deal-killer items the seller is aware of (foundation, flood, title, zoning, code violations)?
- Is there a deadline driving the sale (1031 exchange, divorce, estate, relocation)? That informs how much negotiation room exists.
- The area grade is low — what's the realistic commute time and amenity access for the typical tenant pool here? Any planned neighborhood developments (good or bad) we should know about?
- What's the average days-on-market for RENTAL listings here right now (not sales)? A rising rental-DOM trend means longer vacancies and softer asking-rent achievability than the comps imply.
- What's the recent tenant-quality profile in this submarket — average credit score on applications, eviction rate, late-payment / NSF rate, and stable-employment percentage? A property-management company in the area should have these aggregated.
- How much new for-sale + rental construction is in the pipeline within 1–3 miles? Heavy new supply typically softens prices + rents 12–24 months out; constrained supply supports both.
Investment metrics
- 1% rule
- 0.73% ✗
- Cap rate
- 5.41%
- Cash-on-cash
- -3.14%
- DSCR
- 0.86
- GRM
- 11.4
CMA / ARV
No comps found within radius.
Projected returns pro-forma
-3.0% appreciation · 0.0% rent growth · sell at horizon
- IRR
- -24.7%
- Equity multiple
- 0.18×
- Total profit
- $-97,945
- Equity at exit
- $63,420
- IRR
- -31.8%
- Equity multiple
- -0.23×
- Total profit
- $-146,355
- Equity at exit
- $36,776
Cash invested: $119,095 (down + closing). Projections, not guarantees.
Landlord ↔ Tenant lean methodology
- Overall (STATE)
- 87 Strongly Landlord-Friendly
- State Florida
- 87 Strongly Landlord-Friendly · R+3
- County
- — inherits STATE
- City
- — inherits STATE
ZIP-level market 34219
- Home prices YoY
- -23.7%
- Rents YoY
- -0.9%
- Active inventory
- 2194
- Price-to-rent
- 11.4×
Monthly cashflow live
- Estimated rent
- $3,118 high interval (Pro) →
- Mortgage (P&I)
- −$2,231
- Tax from tax record
- −$293 /mo · $3,513/yr
- Insurance
- −$177
- HOA
- −$74
- Vacancy / Maint / Mgmt
- −$655
- Net cashflow
- $-311
Break-even live
Sensitivity live
| Price | -10% $-71 | -5% $-191 | +0% $-311 | +5% $-432 | +10% $-552 |
|---|---|---|---|---|---|
| Rent | -10% $-558 | -5% $-435 | +0% $-311 | +5% $-188 | +10% $-65 |
| Rate | -1.0pp $-97 | -0.5pp $-203 | base $-311 | +0.5pp $-422 | +1.0pp $-534 |
UW: 25.0% down · 7.5% · 30yr · 1.5% tax · 5.0% vac · 8.0% maint · 8.0% mgmt
Financing live
Cash to close
- Down payment
- $106,335
- Closing costs
- $12,760
- Reserves months
- —
- Total cash needed
- —
Loan-product check · same deal, 3 products live
Conventional
25% down · 7.5% · 30yr
- Down + closing
- —
- Monthly P&I
- —
- Monthly cashflow
- —
- DSCR
- —
- Eligible?
- —
Personal DTI + credit; lowest rate.
DSCR
20% down · 8.5% · 30yr
- Down + closing
- —
- Monthly P&I
- —
- Monthly cashflow
- —
- DSCR
- —
- Eligible?
- —
No personal income docs; deal must DSCR.
Hard money
10% down · 12.0% · 12mo
- Down + closing
- —
- Monthly P&I
- —
- Monthly cashflow
- —
- DSCR
- —
- Eligible?
- —
Short-term bridge; refi at stabilization.
Rent comps 23 comps
| Address | Beds | Baths | Sqft | Rent | $/sqft | DOM | Units | Dist |
|---|---|---|---|---|---|---|---|---|
| 10455 Wet Marsh Cv Parrish, FL | 3.0 | 2.0 | 1635 | $2,650 | $1.62 | 12d | 1 | 0.54mi |
| 9962 Last Light Gln Parrish, FL | 4.0 | 2.0 | 1740 | $2,495 | $1.43 | 5d | 1 | 0.66mi |
| 9009 Moccasin Wallow Rd Parrish, FL | 3.0–4.0 | 2.5 | 1581 | $2,304 | $1.46 | 3d | 32 | 0.68mi |
| 9544 Sandy Bluffs Cir Parrish, FL | 5.0 | 3.0 | 2557 | $2,950 | $1.15 | 5d | 1 | 0.73mi |
| 10225 Daybreak Gln Parrish, FL | 4.0 | 3.0 | 1978 | $2,600 | $1.31 | 5d | 1 | 0.96mi |
| 8541 Bella Mar Trl Parrish, FL | 5.0 | 3.0 | 2389 | $2,800 | $1.17 | 12d | 1 | 0.98mi |
| 8505 Bella Mar Trl Parrish, FL | 4.0 | 2.5 | 1870 | $2,750 | $1.47 | 17d | 1 | 1.03mi |
| 9276 Bonita Mar Dr Parrish, FL | 4.0 | 2.5 | 2466 | $4,250 | $1.72 | 25d | 1 | 1.05mi |
| 9432 Bella Mar Trl Parrish, FL | 4.0 | 2.5 | 2045 | $2,699 | $1.32 | 17d | 1 | 1.08mi |
| 9224 Bonita Mar Dr Parrish, FL | 3.0 | 2.5 | 1799 | $2,290 | $1.27 | 25d | 1 | 1.10mi |
| 8614 Mercator Ct Parrish, FL | 4.0 | 2.5 | 2910 | $3,300 | $1.13 | 25d | 1 | 1.10mi |
| 9207 Bonita Mar Dr Parrish, FL | 3.0 | 2.5 | 1666 | $2,275 | $1.37 | 25d | 1 | 1.12mi |
| 8326 Abalone Loop Parrish, FL | 4.0 | 3.0 | 2711 | $3,650 | $1.35 | 5d | 1 | 1.26mi |
| 8330 Abalone Loop Parrish, FL | 3.0 | 2.5 | 2473 | $2,900 | $1.17 | 17d | 1 | 1.26mi |
| 11628 Moonsail Dr Parrish, FL | 3.0 | 2.0 | 2144 | $3,500 | $1.63 | 23d | 1 | 1.27mi |
| 9262 Gulf Haven Dr Palmetto, FL | 3.0 | 2.5 | 2043 | $2,750 | $1.35 | 16d | 1 | 1.32mi |
| 11612 Armada Way Parrish, FL | 4.0 | 2.0 | 2112 | $3,400 | $1.61 | 21d | 1 | 1.33mi |
| 11454 Gallatin Trl Parrish, FL | 4.0 | 2.0 | 1635 | $2,575 | $1.57 | 17d | 1 | 1.36mi |
| 11512 Gallatin Trl Parrish, FL | 4.0 | 2.5 | 1929 | $3,300 | $1.71 | 25d | 1 | 1.39mi |
| 10749 Hidden Banks Gln Parrish, FL | 5.0 | 3.0 | 2447 | $2,549 | $1.04 | 25d | 1 | 1.41mi |
| 7566 Sea Oak Ct Palmetto, FL | 3.0 | 2.5 | 1807 | $2,700 | $1.49 | 23d | 1 | 1.44mi |
| 8031 111th Ter E Parrish, FL | 5.0 | 3.0 | 3067 | $4,150 | $1.35 | 25d | 1 | 1.45mi |
| 11230 82nd St E Parrish, FL | 3.0 | 2.0 | 1758 | $2,495 | $1.42 | 17d | 1 | 1.49mi |
HOA detail
- Monthly dues
- $74 · $888/yr
- Likely covers
- poolgym
Listing history 14 events
-
2026-04-24status Pending
-
2026-03-11price $425,340
-
2026-03-11price $423,840
-
2026-02-27price $428,840
-
2026-02-25price $427,340
-
2026-02-11price $422,340
-
2026-02-04price $412,340
-
2026-02-04status Active
-
2026-02-04price $432,340
-
2025-12-30status Pending
-
2025-12-22price $426,340
-
2025-11-10price $425,480
-
2025-11-03price $420,140
-
2025-10-29$418,140 Active
ⓘ Source: listings_history table (triggers on properties + properties_extension) + one-shot
backfill from property_details.listing_events for pre-trigger history.
Tax reassessment forecast FL · Resets to sale price
- Current annual tax
- $3,513 · $293/mo
- Projected year-2 tax
- $3,530 · $294/mo
- Expected delta
- +$17/yr (+$1/mo · 0.5%)
ⓘ Screening estimate from a state-policy table — verify with the county assessor before closing.
Nearby sold comps map
Loading sold comps map…
Walkable amenities ~0.75 mi
Loading nearby amenities…
Taxation est. · year 1
- Rental income
- $37,415
- − Mortgage interest
- −$23,826
- − Property taxes
- −$3,513
- − Insurance
- −$2,127
- − Repairs & maintenance
- −$2,993
- − Management
- −$2,993
- − HOA
- −$888
- − Depreciation
- −$12,374
- Taxable loss
- −$11,298
- Est. tax savings @ 24.0%
- +$2,712
- After-tax cash flow
- $-1,025/yr
For passive investors: Depreciation is non-cash, so a rental often shows a tax loss while cash-flowing — sheltering income. Rental losses are passive: they offset passive income freely, and up to $25,000/yr can offset ordinary (W-2) income if you actively participate and your MAGI is under $100k (phasing out to $0 by $150k); unused losses carry forward. On sale, claimed depreciation is recaptured at up to 25%, and gains may owe capital-gains tax (a 1031 exchange can defer both). Figures are a year-1 estimate at your 24.0% rate — not tax advice; consult a CPA.
Schools (NCES district)
- District
- Manatee
- NCES district ID
- 1201230
- Math proficiency
- 54% ▼ -6.00%
- Reading proficiency
- 50% ▼ -2.00%
- Median HH income
- $49,607
- Composite
- 44.43/100
- National rank
- #2806
- State rank
- #26 of 73 in FL
Livability — Parrish
No livability data for this city. (Only ~50 U.S. cities are tracked.)
Census & demographics
- County
- Manatee County · 416,364 people
- City population
- 52,177
- Metro
- North Port-Sarasota-Bradenton, FL
- Population (ZIP)
- 33,296
- Household income
- $113,773
- Rent vs Own
- Severe rent burden
- 219.0
Population outlook (Manatee County) Hauer SSP2
- Today (2025)
- 447,342 people
- By 2030
- 488,911 · +9.3%
- By 2040
- 567,934 · +27.0%
- By 2050
- 637,995 · +42.6%
- By 2075
- 781,970 · +74.8%
- By 2100
- 848,272 · +89.6%
Race, ethnicity, and origin ACS 2023
- Neighborhood character
- Predominantly White (75%)
- Race & ethnicity
- White 75% Hispanic / Latino 11% Two or more races 8% Black 8% Asian 2%
- Hispanic origin (detail)
- Mexican 2% Puerto Rican 3%
- Common ancestry
- Romanian 4% Hispanic 2% Russian 2%
- Foreign-born
- 10% · Canada, Dominican Republic, Jamaica
- Languages at home
- 88% English-only · Spanish 7% French/Haitian/Cajun 2% Other Asian/Pacific 1%
Political lean MEDSL · Manatee
- 2024 margin
- Strong R (+23.5) · D 37.9% · R 61.4%
- 2008→2024 swing
- -16.5pp toward R · 2008: -7.0pp · 2024: -23.5pp
- All cycles
- 2024: R+23.5 2020: R+16.1 2016: R+17.1 2012: R+12.5 2008: R+7.0
Not yet ingested
- Civics
- —
Market trends
- HPI YoY
- ▼ -84.45%
- Current HPI
- 271.7131
- Rent YoY
- ▼ -0.95%
- Metro
- North Port-Sarasota-Bradenton, FL
- State GDP YoY
- ▲ 3.28%
- F500 in state
- 36
Industry mix (Fortune 500 HQ in FL)
| Industry | F500 HQs | Revenue |
|---|---|---|
| Industrial Technology | 2 | $29B |
|
||
| Insurance | 2 | $17B |
|
||
| Retail | 1 | $60B |
|
||
| Technology Distribution | 1 | $58B |
|
||
| Homebuilding | 1 | $35B |
|
||
| Technology Manufacturing | 1 | $35B |
|
||
Price history
+1.7% since first listed14 events — show timeline
- 2026-04-24 Pending — Stellar MLS as Distributed by MLS Grid
- 2026-03-11 Price Changed $425,340 Stellar MLS as Distributed by MLS Grid
- 2026-03-11 Price Changed $423,840 Stellar MLS as Distributed by MLS Grid
- 2026-02-27 Price Changed $428,840 Stellar MLS as Distributed by MLS Grid
- 2026-02-25 Price Changed $427,340 Stellar MLS as Distributed by MLS Grid
- 2026-02-11 Price Changed $422,340 Stellar MLS as Distributed by MLS Grid
- 2026-02-04 Price Changed $412,340 Stellar MLS as Distributed by MLS Grid
- 2026-02-04 Relisted — Stellar MLS as Distributed by MLS Grid
- 2026-02-04 Price Changed $432,340 Stellar MLS as Distributed by MLS Grid
- 2025-12-30 Pending — Stellar MLS as Distributed by MLS Grid
- 2025-12-22 Price Changed $426,340 Stellar MLS as Distributed by MLS Grid
- 2025-11-10 Price Changed $425,480 Stellar MLS as Distributed by MLS Grid
- 2025-11-03 Price Changed $420,140 Stellar MLS as Distributed by MLS Grid
- 2025-10-29 Listed $418,140 Stellar MLS as Distributed by MLS Grid
Cash-flow waterfall
monthlySold comps — $/sqft
last 12 mo · ≤1 miLoading sold comps…