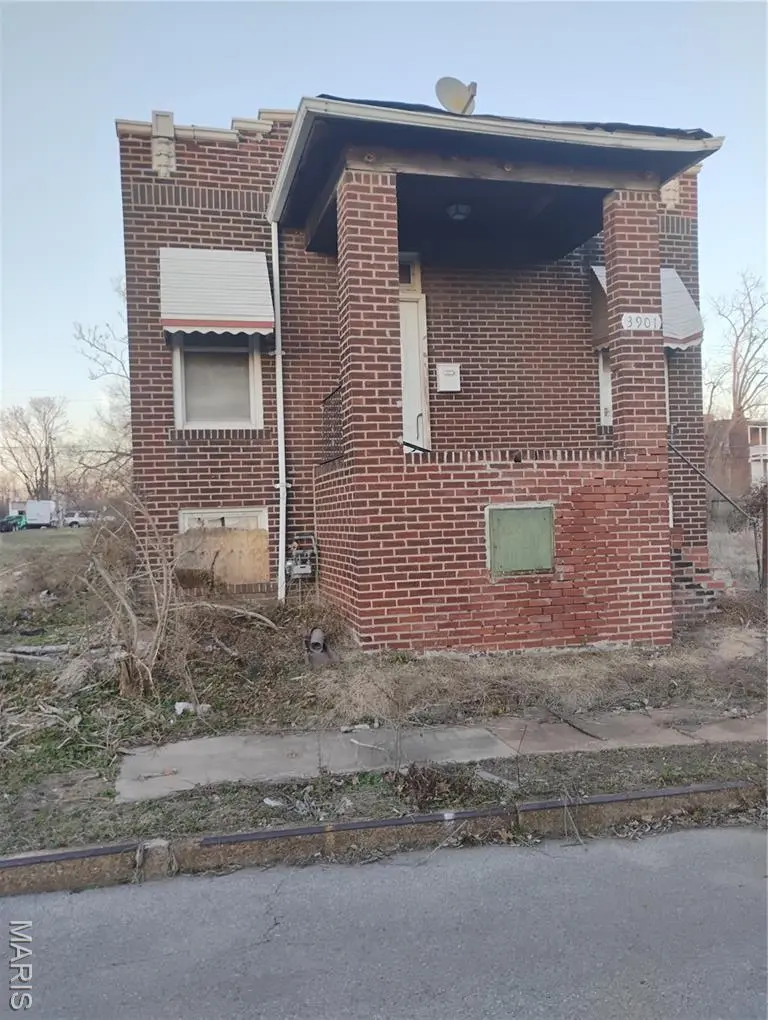
3901 Sherman Pl · St. Louis, MO
Flood risk 1/10 · Minimal
- FEMA flood zone
- X (unshaded)
- Chance of flooding over 30 yrs
- 0.0%
- Est. flood insurance / yr
- $473 – $860
Fire risk 1/10 · Minimal
- Est. fire insurance / yr
- $1,054 – $1,958
Heat risk 5/10 · Moderate
- Hot days now (above 108°F)
- 7 days/yr
- Hot days in 30 yrs
- 20 days/yr
Wind risk 2/10 · Minimal
- Chance of severe wind over 30 yrs
- 1.0%
Air-quality risk 4/10 · Minor
- Unhealthy air days now
- 5 days/yr
- Unhealthy air days in 30 yrs
- 6 days/yr
Risk factors via First Street. Map © Google.
Why this score? — see what drove the B+ grade
The composite is a weighted blend of 9 inputs, each scored 0–100. Each bar is that input's sub-score; the figure is the points it added to the 100-point composite (weight × sub-score).
- Cash flow +30.0/30.0
- ARV discount +15.0/15.0
- 1% rule +10.0/10.0
- DSCR +10.0/10.0
- Appreciation +4.1/10.0
- Rent growth +2.5/5.0
- Livability +2.5/5.0
- Condition / age +2.5/5.0
- Schools +1.2/10.0
$26,000
🖨 Deal sheet (PDF) 📄 Offer letter ✓ Due diligence
Listing remarks MLS
Investor special with tons of potential! This property at 3901 Sherman is a great opportunity for those looking to add to their portfolio or complete a value-add project. Featuring a spacious layout and solid structure, this home is ready for your vision and updates. Perfect for a fix-and-flip or long-term rental. Conveniently located near major highways, shopping, and local amenities. Property to be sold as-is, seller to do no inspections or repairs. Don’t miss out on this chance to bring this property back to life!
Key facts
- 2,748 sq ft lot
- Built 1925
- Listed 96 days
Neighborhood map
What this means for you Summary
Snapshot
- This is a 2-bed/1.0-bath single-family listed at $26k.
Deal economics
- At list price, monthly cash flow is $511 ($6k/yr) — positive.
- The deal already cash-flows at list — no discount required.
- Meets the 1% rule at list price ($848 rent vs $26k).
- Recommended offer: $24k (9.0% below list) — sets the bar for market timing.
- Cap rate 29.9% vs local median 5.0% in St. Louis — top-decile yield for the area; either an underpriced asset or a hidden risk that comps aren't pricing in. Stress-test before assuming the spread holds.
Location & tenants
- Location reads: area grade B — affects rentability + tenant quality, not the cash-flow math above.
- St. Louis City (urban): math 10% / reading 18% proficiency, ranked #312 of 324 in MO (top 96%) — low school quality limits family demand, transient renter base, plan for 1-2y turnover; 80% free/reduced lunch — lower-income household profile, screen leases tightly.
- Market conditions: 58 active listings in the ZIP; 18 comparable units currently listed for rent nearby; rentals at typical pace (median 24d on market — plan ~3-4 weeks tenant-placement turnaround); 44% of comp listings sitting > 30 days — soft ceiling on asking rent; 294 units permitted in St. Louis city in 2024 (227 in 5+ unit buildings).
Forward outlook
- Local home prices are declining (-1.8%/yr); year-one equity from $180 of loan paydown is wiped out by about $455 of value loss. Plan a longer hold.
- St. Louis County population projected to shrink 6% by 2050 — rents likely to lag national; underwrite the cash flow, not the appreciation.
- At projected returns (-1.8% appreciation + 3.0% rent growth), your $7k cash investment doubles in ~2 years — after that, you're playing with house money.
Negotiation context
- It's been on market 96 days — a 9% lower offer ($24k) is reasonable based on typical stale-listing flexibility.
- 2 sale attempts since 13y ago; this cycle's ask has dropped $9k (26%) from the opening price — seller is motivated, your offer sets the floor, not the list.
Risks & watch-outs
- Watch-outs: built in 1925 — expect roof / HVAC / electrical / plumbing capex.
- Climate carrying-cost: extreme-heat days projected 7→20/yr by 2055 (HVAC capex compounding) — expect insurance premiums to compound above CPI over the hold.
Questions for the listing agent
- It's been on market 96 days. Have you received any prior offers? Is the seller open to a 9% concession, seller financing, or rate buy-down credit?
- Built in 1925 — when were the roof, HVAC, electrical panel, plumbing, and water heater last replaced?
- Why hasn't it sold? Are there any deal-killer items the seller is aware of (foundation, flood, title, zoning, code violations)?
- Is there a deadline driving the sale (1031 exchange, divorce, estate, relocation)? That informs how much negotiation room exists.
- What's the average days-on-market for RENTAL listings here right now (not sales)? A rising rental-DOM trend means longer vacancies and softer asking-rent achievability than the comps imply.
- What's the recent tenant-quality profile in this submarket — average credit score on applications, eviction rate, late-payment / NSF rate, and stable-employment percentage? A property-management company in the area should have these aggregated.
- How much new for-sale + rental construction is in the pipeline within 1–3 miles? Heavy new supply typically softens prices + rents 12–24 months out; constrained supply supports both.
Investment metrics
- 1% rule
- 3.26% ✓
- Cap rate
- 29.86%
- Cash-on-cash
- 84.16%
- DSCR
- 4.74
- GRM
- 2.6
CMA / ARV
- ARV (median comp)
- $43,629
- List price
- $26,000
- Delta
- -40.41%
- Verdict
- UNDERPRICED
- Comps
- 20 within 1.0 mi
Show comp detail 7 sales within ~0.75 mi
| Address | Dist | Beds/Ba | Sqft | Sold | Price | $/sf | Match |
|---|---|---|---|---|---|---|---|
| 3819 Kossuth Ave | 0.09mi | 1/1.0 (-1) | 816 (-7%) | 22mo | $38,500 | $47 | 61 |
| 3641 Hebert St | 0.55mi | 2/1.0 | 967 (+10%) | 4mo | $107,000 | $111 | 54 |
| 4275 E Ashland Ave | 0.74mi | 2/1.0 | 938 (+7%) | 2mo | $99,900 | $107 | 53 |
| 4117 Gano Ave | 0.19mi | 1/1.0 (-1) | 766 (-13%) | 16mo | $5,000 | $7 | 51 |
| 4330 Penrose St | 0.72mi | 2/1.0 | 800 (-9%) | 1mo | $15,000 | $19 | 50 |
| 4231 East San Francisco | 0.56mi | 1/1.0 (-1) | 795 (-10%) | 10mo | $15,000 | $19 | 44 |
| 4124 W Green Lea Pl | 0.45mi | 2/1.5 | 968 (+10%) | 20mo | $15,000 | $15 | 44 |
Match score weights: distance 35% · size 25% · config 20% · recency 20%. Top-matched comps best support the ARV.
Projected returns pro-forma
-1.75% appreciation · 3.0% rent growth · sell at horizon
- IRR
- 85.3%
- Equity multiple
- 5.08×
- Total profit
- $29,691
- Equity at exit
- $5,351
- IRR
- 87.8%
- Equity multiple
- 10.48×
- Total profit
- $68,979
- Equity at exit
- $4,863
Cash invested: $7,280 (down + closing). Projections, not guarantees.
Landlord ↔ Tenant lean methodology
- Overall (STATE)
- 81 Strongly Landlord-Friendly
- State Missouri
- 81 Strongly Landlord-Friendly · R+10
- County
- — inherits STATE
- City
- — inherits STATE
ZIP-level market 63107
- Home prices YoY
- -1.9%
- Active inventory
- 58
- Price-to-rent
- 2.6×
Monthly cashflow live
- Estimated rent
- $848 high interval (Pro) →
- Mortgage (P&I)
- −$136
- Tax from tax record
- −$12 /mo · $144/yr
- Insurance
- −$11
- HOA
- −$0
- Vacancy / Maint / Mgmt
- −$178
- Net cashflow
- $511
Break-even live
Sensitivity live
| Price | -10% $525 | -5% $518 | +0% $511 | +5% $503 | +10% $496 |
|---|---|---|---|---|---|
| Rent | -10% $444 | -5% $477 | +0% $511 | +5% $544 | +10% $578 |
| Rate | -1.0pp $524 | -0.5pp $517 | base $511 | +0.5pp $504 | +1.0pp $497 |
UW: 25.0% down · 7.5% · 30yr · 1.5% tax · 5.0% vac · 8.0% maint · 8.0% mgmt
Financing live
Cash to close
- Down payment
- $6,500
- Closing costs
- $780
- Reserves months
- —
- Total cash needed
- —
Loan-product check · same deal, 3 products live
Conventional
25% down · 7.5% · 30yr
- Down + closing
- —
- Monthly P&I
- —
- Monthly cashflow
- —
- DSCR
- —
- Eligible?
- —
Personal DTI + credit; lowest rate.
DSCR
20% down · 8.5% · 30yr
- Down + closing
- —
- Monthly P&I
- —
- Monthly cashflow
- —
- DSCR
- —
- Eligible?
- —
No personal income docs; deal must DSCR.
Hard money
10% down · 12.0% · 12mo
- Down + closing
- —
- Monthly P&I
- —
- Monthly cashflow
- —
- DSCR
- —
- Eligible?
- —
Short-term bridge; refi at stabilization.
Rent comps 18 comps
| Address | Beds | Baths | Sqft | Rent | $/sqft | DOM | Units | Dist |
|---|---|---|---|---|---|---|---|---|
| 3819 Kossuth Ave Saint Louis, MO | 1.0 | 1.5 | 816 | $725 | $0.89 | 24d | 1 | 0.09mi |
| 4301 E Warne Ave St. Louis, MO | 1.0 | 1.0 | 550 | $525 | $0.95 | 44d | 1 | 0.27mi |
| 3644 Natural Bridge Ave Apt 203 St. Louis, MO | 1.0 | 1.0 | 570 | $680 | $1.19 | 44d | 1 | 0.46mi |
| 3644 Natural Bridge Ave Apt 303 St. Louis, MO | 1.0 | 1.0 | 710 | $825 | $1.16 | 44d | 1 | 0.46mi |
| 2002 Obear Ave St. Louis, MO | 2.0 | 1.5 | 1024 | $970 | $0.95 | 5d | 1 | 0.62mi |
| 1906 Obear Ave #1 St. Louis, MO | 2.0 | 1.5 | 1024 | $970 | $0.95 | 22d | 1 | 0.68mi |
| 4426 Holly Ave Unit B St. Louis, MO | 2.0 | 1.0 | 1000 | $1,100 | $1.10 | 15d | 1 | 0.73mi |
| 3516 Russell Blvd Saint Louis, MO | 1.0 | 1.0 | 560 | $875 | $1.56 | 8d | 1 | 0.83mi |
| 5200 Von Phul St Saint Louis, MO | 1.0 | 1.0 | 800 | $1,050 | $1.31 | 24d | 1 | 0.88mi |
| 2603 Belle Glade Ave Saint Louis, MO | 2.0 | 1.0 | 945 | $800 | $0.85 | 5d | 1 | 1.03mi |
| 4493 Bessie Ave Saint Louis, MO | 3.0 | 1.0 | 880 | $1,250 | $1.42 | 44d | 1 | 1.03mi |
| 4497 Lee Ave Saint Louis, MO | 3.0 | 2.0 | 1012 | $1,000 | $0.99 | 17d | 1 | 1.05mi |
| 4460 Bircher Blvd Saint Louis, MO | 1.0 | 1.0 | 1100 | $725 | $0.66 | 11d | 1 | 1.19mi |
| 4642 Farlin Ave Unit 1F St. Louis, MO | 2.0 | 1.0 | 1056 | $800 | $0.76 | 44d | 1 | 1.23mi |
| 2239 University St Saint Louis, MO | 3.0 | 1.5 | 1116 | $1,295 | $1.16 | 12d | 1 | 1.26mi |
| 1910 Agnes St Saint Louis, MO | 3.0 | 1.0 | 704 | $1,200 | $1.70 | 44d | 1 | 1.26mi |
| 1708 Annie Malone Dr Saint Louis, MO | 3.0 | 1.5 | 924 | $1,500 | $1.62 | 44d | 1 | 1.36mi |
| 4627 Maffitt Ave Saint Louis, MO | 2.0 | 1.0 | 704 | $795 | $1.13 | 44d | 1 | 1.48mi |
Listing history 11 events
-
2026-06-18days on market $26,000 Active 96 DOM
-
2026-06-17days on market $26,000 Active 95 DOM
-
2026-06-16days on market $26,000 Active 94 DOM
-
2026-06-15days on market $26,000 Active 93 DOM
-
2026-06-13days on market $26,000 Active 91 DOM
-
2026-05-31days on market $26,000 Active 90 DOM
-
2026-05-11price $29,000 528-char remark
Show marketing remark (528 chars)
Investor special with tons of potential! This property at 3901 Sherman is a great opportunity for those looking to add to their portfolio or complete a value-add project. Featuring a spacious layout and solid structure, this home is ready for your vision and updates. Perfect for a fix-and-flip or long-term rental. Conveniently located near major highways, shopping, and local amenities. Property to be sold as-is, seller to do no inspections or repairs. Don’t miss out on this chance to bring this property back to life!
-
2026-03-03$35,000 Active 528-char remark
Show marketing remark (528 chars)
Investor special with tons of potential! This property at 3901 Sherman is a great opportunity for those looking to add to their portfolio or complete a value-add project. Featuring a spacious layout and solid structure, this home is ready for your vision and updates. Perfect for a fix-and-flip or long-term rental. Conveniently located near major highways, shopping, and local amenities. Property to be sold as-is, seller to do no inspections or repairs. Don’t miss out on this chance to bring this property back to life!
-
2026-03-02historical $35,000 528-char remark
Show marketing remark (528 chars)
Investor special with tons of potential! This property at 3901 Sherman is a great opportunity for those looking to add to their portfolio or complete a value-add project. Featuring a spacious layout and solid structure, this home is ready for your vision and updates. Perfect for a fix-and-flip or long-term rental. Conveniently located near major highways, shopping, and local amenities. Property to be sold as-is, seller to do no inspections or repairs. Don’t miss out on this chance to bring this property back to life!
-
2013-06-13soldstatus 442-char remark
Show marketing remark (442 chars)
ATTN LANDLORDS AND INVESTORS!!!! YOU DON’T WANT TO MISS THIS ONE!!! Take a look at this home!! This nice bungalow contains 880 square feet at a GREAT LOW PRICE!!! This home features 2 bedrooms and 1 bath and needs some TLC but has tons of potential!! This property will make a great home or rental for the right buyer. Schedule a showing TODAY!!! Property is being sold "As-Is" and is subject to HUD Guidelines 24 CFR 206.125.
-
2013-04-10$2,000 442-char remark
Show marketing remark (442 chars)
ATTN LANDLORDS AND INVESTORS!!!! YOU DON’T WANT TO MISS THIS ONE!!! Take a look at this home!! This nice bungalow contains 880 square feet at a GREAT LOW PRICE!!! This home features 2 bedrooms and 1 bath and needs some TLC but has tons of potential!! This property will make a great home or rental for the right buyer. Schedule a showing TODAY!!! Property is being sold "As-Is" and is subject to HUD Guidelines 24 CFR 206.125.
ⓘ Source: listings_history table (triggers on properties + properties_extension) + one-shot
backfill from property_details.listing_events for pre-trigger history.
Tax reassessment forecast MO · Resets to sale price
- Current annual tax
- $144 · $12/mo
- Projected year-2 tax
- $252 · $21/mo
- Expected delta
- +$109/yr (+$9/mo · 75.7%)
ⓘ Screening estimate from a state-policy table — verify with the county assessor before closing.
Climate risk First Street
- Flood 1/10 Low FEMA zone X (unshaded) · 0% chance over 30 yrs
- Wildfire 1/10 Low
- Heat 5/10 Major 7 d/yr ≥108°F today · 20 d/yr by 30 yrs out
- Wind 2/10 Low 100% chance of damaging wind over 30 yrs
- Air quality 4/10 Moderate 5 unhealthy d/yr today · 6 by 30 yrs out
Nearby sold comps map
Loading sold comps map…
Walkable amenities ~0.75 mi
Loading nearby amenities…
Taxation est. · year 1
- Rental income
- $10,173
- − Mortgage interest
- −$1,456
- − Property taxes
- −$144
- − Insurance
- −$130
- − Repairs & maintenance
- −$814
- − Management
- −$814
- − Depreciation
- −$756
- Taxable income
- $6,059
- Est. tax owed @ 24.0%
- −$1,454
- After-tax cash flow
- $4,673/yr
For passive investors: Depreciation is non-cash, so a rental often shows a tax loss while cash-flowing — sheltering income. Rental losses are passive: they offset passive income freely, and up to $25,000/yr can offset ordinary (W-2) income if you actively participate and your MAGI is under $100k (phasing out to $0 by $150k); unused losses carry forward. On sale, claimed depreciation is recaptured at up to 25%, and gains may owe capital-gains tax (a 1031 exchange can defer both). Figures are a year-1 estimate at your 24.0% rate — not tax advice; consult a CPA.
Schools (NCES district)
- District
- St. Louis City
- NCES district ID
- 2929280
- Math proficiency
- 10% ▼ -6.00%
- Reading proficiency
- 18% ▼ -3.00%
- Median HH income
- $35,685
- Composite
- 11.54/100
- National rank
- #9699
- State rank
- #312 of 324 in MO
Livability — St. Louis
No livability data for this city. (Only ~50 U.S. cities are tracked.)
Census & demographics
- Census place
- St. Louis, MO
- City population
- 283,259
- Population (ZIP)
- 9,082
Population outlook (St. Louis County) Hauer SSP2
- Today (2025)
- 315,737 people
- By 2030
- 313,865 · -0.6%
- By 2040
- 305,439 · -3.3%
- By 2050
- 296,529 · -6.1%
- By 2075
- 271,028 · -14.2%
- By 2100
- 255,359 · -19.1%
Race, ethnicity, and origin ACS 2023
- Neighborhood character
- Predominantly Black (89%)
- Race & ethnicity
- Black 89% White 8% Hispanic / Latino 2% Two or more races 2%
- Common ancestry
- Lithuanian 1%
- Foreign-born
- 1% · Canada
- Languages at home
- 98% English-only · Spanish 1%
Political lean MEDSL · St. Louis
- 2024 margin
- Solid D (+64.7) · D 81.4% · R 16.7% · Other 2.0%
- 2008→2024 swing
- -3.5pp toward R · 2008: 68.2pp · 2024: 64.7pp
- All cycles
- 2024: D+64.7 2020: D+66.2 2016: D+63.7 2012: D+66.6 2008: D+68.2
Not yet ingested
- Civics
- —
Market trends
- HPI YoY
- ▼ -1.75%
- Current HPI
- 92.7423
- Rent YoY
- —
- Metro
- —
- State GDP YoY
- ▲ 1.84%
- F500 in state
- 20
Industry mix (Fortune 500 HQ in MO)
| Industry | F500 HQs | Revenue |
|---|---|---|
| Healthcare | 1 | $163B |
|
||
| Insurance | 1 | $21B |
|
||
| Industrial Technology | 1 | $17B |
|
||
| Retail | 1 | $16B |
|
||
| Industrial Distribution | 1 | $10B |
|
||
| Utilities | 1 | $9B |
|
||
Price history
+1350.0% since first listed5 events — show timeline
- 2026-05-11 Price Changed $29,000 MARIS as Distributed by MLS Grid
- 2026-03-03 Listed $35,000 MARIS as Distributed by MLS Grid
- 2026-03-02 Coming Soon $35,000 MARIS as Distributed by MLS Grid
- 2013-06-13 Sold (MLS) — MARIS as Distributed by MLS Grid
- 2013-04-10 Listed $2,000 MARIS as Distributed by MLS Grid
Property tax history
-0.5%/yrLatest (2024): $144 · +4.1% YoY. Source: county tax records.
Cash-flow waterfall
monthlySold comps — $/sqft
last 12 mo · ≤1 miLoading sold comps…