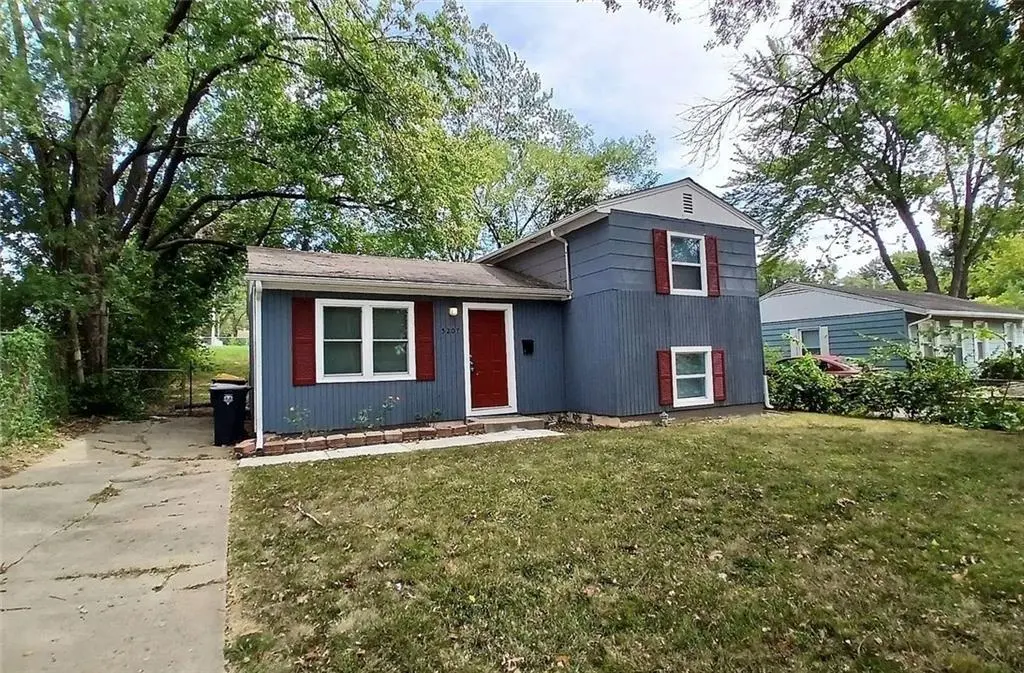
5207 Sycamore Ave · Kansas City, MO
Flood risk 1/10 · Minimal
- FEMA flood zone
- X (unshaded)
- Chance of flooding over 30 yrs
- 0.0%
- Est. flood insurance / yr
- $507 – $1,088
Fire risk 1/10 · Minimal
- Est. fire insurance / yr
- $1,054 – $1,958
Heat risk 4/10 · Minor
- Hot days now (above 107°F)
- 7 days/yr
- Hot days in 30 yrs
- 16 days/yr
Wind risk 2/10 · Minimal
- Chance of severe wind over 30 yrs
- —
Air-quality risk 3/10 · Minor
- Unhealthy air days now
- 3 days/yr
- Unhealthy air days in 30 yrs
- 5 days/yr
Risk factors via First Street. Map © Google.
Why this score? — see what drove the C- grade
The composite is a weighted blend of 9 inputs, each scored 0–100. Each bar is that input's sub-score; the figure is the points it added to the 100-point composite (weight × sub-score).
- Cash flow +27.6/30.0
- DSCR +9.7/10.0
- 1% rule +6.7/10.0
- Livability +3.9/5.0
- Rent growth +2.5/5.0
- Condition / age +2.5/5.0
- Schools +1.8/10.0
- ARV discount +0.0/15.0
- Appreciation +0.0/10.0
$139,900
🖨 Deal sheet 📄 Offer letter ✓ Due diligence
Listing remarks MLS
New Refrigerator and stove to be installed upon contract. 3 Bedroom home features huge backyard with deck and partial fence. Existing Washer/dryer included.
Key facts
- 9,229 sq ft lot
- Built 1959
- Listed 19 days
Property features AI
Finance
- Other: Living area and finished area noted in public records
- HOA & community: No association fees
Exterior
- Parking: Off-street parking
- Utilities: Public water (city/public — verify); Public sewer
- Home design: Single-family residence; Side/side split floor plan; Faces west
- Construction: Wood siding; Composition roof; Residence approximately 51-75 years old
- Exterior features: City lot within city limits; Paved road with public maintenance; Lot in typical city location (lot features: City Limits, City Lot)
Interior
- Kitchen: Refrigerator; Gas Range
- Bedrooms: 3 bedrooms (two on upper level, one main level living area noted separately)
- Flooring: Carpet in living areas and bedrooms; Vinyl flooring in kitchen; Ceramic tile flooring
- Bathrooms: 1 full bathroom (upper level); Additional lower-level bathroom indicated
- Heating & cooling: Natural gas heating; Central cooling
- Interior features: Eat-in kitchen; Partial basement with sump pump and walk-out access
- Laundry & utility: Lower-level laundry
Neighborhood map
What this means for you Summary
Snapshot
- This is a 4-bed/1.0-bath single-family listed at $140k.
Deal economics
- At list price, monthly cash flow is $418 ($5k/yr) — positive.
- The deal already cash-flows at list — no discount required.
- Meets the 1% rule at list price ($2k rent vs $140k).
- Recommended offer: $138k (1.5% below list) — sets the bar for market timing.
- Cap rate 9.9% vs local median 3.9% in Kansas City — top-decile yield for the area; either an underpriced asset or a hidden risk that comps aren't pricing in. Stress-test before assuming the spread holds.
Location & tenants
- Location reads 78/100 on livability (#28 in MO, #2,671 nationally) — a middle-class / working-renter tenant base. Strengths: amenities A+, commute A+, cost of living A+; Watch: crime F.
- Raytown C-2 (suburban): math 12% / reading 28% proficiency, ranked #302 of 324 in MO (top 93%) — low school quality limits family demand, transient renter base, plan for 1-2y turnover.
- Zoned schools: Eastwood Hills Elem. (math 8% / reading 22%, grade F, #982 of 1,115 statewide, top 89%, 329 students, 82% FRL); Raytown Sr. High (math 7% / reading 29%, grade F, #482 of 521 statewide, top 92%, 1,365 students, 65% FRL) — zoned schools average 74% FRL vs 54% district-wide (20 pts higher); higher-poverty schools than district average — tighter screening recommended.
- Market conditions: 52 active listings in the ZIP; 5 comparable units currently listed for rent nearby; rentals leasing fast (median 8d on market — plan ~1-2 weeks tenant-placement turnaround); 40% of comp listings sitting > 30 days — soft ceiling on asking rent; 4,002 units permitted in Jackson County in 2024 (2,271 in 5+ unit buildings).
- This rent runs 38% of the median local income ($51k/yr) — at the standard rent-burdened threshold; future hikes will face affordability resistance.
Forward outlook
- Local home prices are declining (-3.0%/yr); year-one equity from $967 of loan paydown is wiped out by about $4k of value loss. Plan a longer hold.
- Jackson County population projected at +4% by 2050 — modest demand growth; plan on rents tracking national, not racing it.
- At projected returns (-3.0% appreciation + 3.0% rent growth), your $39k cash investment doubles in ~9 years — after that, you're playing with house money.
Negotiation context
- It's been on market 19 days — a 2% lower offer ($138k) is reasonable based on typical stale-listing flexibility.
- 6 sale attempts since 26y ago with the ask held roughly flat each time — persistent listings suggest the price (not the market) is what's stuck; bring a comps-based counter.
Risks & watch-outs
- Watch-outs: built in 1959 — expect roof / HVAC / electrical / plumbing capex.
Questions for the listing agent
- Built in 1959 — when were the roof, HVAC, electrical panel, plumbing, and water heater last replaced?
- Is there a deadline driving the sale (1031 exchange, divorce, estate, relocation)? That informs how much negotiation room exists.
- Crime grade is F in this area — have there been break-ins, vandalism, or insurance claims at this property in the last 3 years? What carrier currently insures it and at what premium?
- What's the average days-on-market for RENTAL listings here right now (not sales)? A rising rental-DOM trend means longer vacancies and softer asking-rent achievability than the comps imply.
- What's the recent tenant-quality profile in this submarket — average credit score on applications, eviction rate, late-payment / NSF rate, and stable-employment percentage? A property-management company in the area should have these aggregated.
- How much new for-sale + rental construction is in the pipeline within 1–3 miles? Heavy new supply typically softens prices + rents 12–24 months out; constrained supply supports both.
Investment metrics
- 1% rule
- 1.17% ✓
- Cap rate
- 9.88%
- Cash-on-cash
- 12.81%
- DSCR
- 1.57
- GRM
- 7.2
CMA / ARV
- ARV (on-the-fly)
- $110,780
- Comps found
- 12
Show comp detail 12 sales within ~0.75 mi
| Address | Dist | Beds/Ba | Sqft | Sold | Price | $/sf | Match |
|---|---|---|---|---|---|---|---|
| 5115 Sycamore Ave | 0.10mi | 3/1.0 (-1) | 816 (+7%) | 12mo | $99,000 | $121 | 69 |
| 5117 Palmer Dr | 0.23mi | 3/1.0 (-1) | 816 (+7%) | 11mo | $135,000 | $165 | 64 |
| 5130 Palmer St | 0.20mi | 3/1.0 (-1) | 864 (+13%) | 1mo | $124,900 | $145 | 63 |
| 8404 E 47th Ter | 0.61mi | 3/1.0 (-1) | 768 (+0%) | 13mo | $65,000 | $85 | 55 |
| 7803 E 50th Ter | 0.25mi | 3/1.5 (-1) | 864 (+13%) | 6mo | $174,900 | $202 | 54 |
| 7405 E 49th St | 0.49mi | 3/1.0 (-1) | 864 (+13%) | 2mo | $82,000 | $95 | 48 |
| 7801 Ozark Rd | 0.65mi | 3/1.0 (-1) | 816 (+7%) | 8mo | $110,000 | $135 | 47 |
| 7409 E 49th St | 0.48mi | 3/1.0 (-1) | 864 (+13%) | 8mo | $36,000 | $42 | 44 |
| 7719 E 47th Ter | 0.60mi | 3/1.0 (-1) | 840 (+10%) | 9mo | $125,000 | $149 | 43 |
| 7715 E 47th Ter | 0.60mi | 3/1.0 (-1) | 840 (+10%) | 11mo | $159,999 | $190 | 41 |
| 8806 E 55th St | 0.73mi | 3/1.0 (-1) | 846 (+11%) | 6mo | $118,000 | $139 | 38 |
| 7501 E 49th St | 0.48mi | 3/2.0 (-1) | 864 (+13%) | 13mo | $170,000 | $197 | 36 |
Match score weights: distance 35% · size 25% · config 20% · recency 20%. Top-matched comps best support the ARV.
Projected returns pro-forma
-3.0% appreciation · 3.0% rent growth · sell at horizon
- IRR
- 2.6%
- Equity multiple
- 1.10×
- Total profit
- $3,936
- Equity at exit
- $20,860
- IRR
- 12.2%
- Equity multiple
- 1.96×
- Total profit
- $37,590
- Equity at exit
- $12,096
Cash invested: $39,172 (down + closing). Projections, not guarantees.
Landlord ↔ Tenant lean methodology
- Overall (STATE)
- 81 Strongly Landlord-Friendly
- State Missouri
- 81 Strongly Landlord-Friendly · R+10
- County
- — inherits STATE
- City
- — inherits STATE
ZIP-level market 64129
- Home prices YoY
- -9.8%
- Active inventory
- 52
- Price-to-rent
- 7.2×
Monthly cashflow live
- Estimated rent
- $1,631 high interval (Pro) →
- Mortgage (P&I)
- −$734
- Tax from tax record
- −$78 /mo · $934/yr
- Insurance
- −$58
- HOA
- −$0
- Vacancy / Maint / Mgmt
- −$342
- Net cashflow
- $418
Break-even live
UW: 25.0% down · 7.5% · 30yr · 1.5% tax · 5.0% vac · 8.0% maint · 8.0% mgmt
Financing live
Cash to close
- Down payment
- $34,975
- Closing costs
- $4,197
- Reserves months
- —
- Total cash needed
- —
Loan-product check · same deal, 3 products live
Conventional
25% down · 7.5% · 30yr
- Down + closing
- —
- Monthly P&I
- —
- Monthly cashflow
- —
- DSCR
- —
- Eligible?
- —
Personal DTI + credit; lowest rate.
DSCR
20% down · 8.5% · 30yr
- Down + closing
- —
- Monthly P&I
- —
- Monthly cashflow
- —
- DSCR
- —
- Eligible?
- —
No personal income docs; deal must DSCR.
Hard money
10% down · 12.0% · 12mo
- Down + closing
- —
- Monthly P&I
- —
- Monthly cashflow
- —
- DSCR
- —
- Eligible?
- —
Short-term bridge; refi at stabilization.
Rent comps 5 comps
| Address | Beds | Baths | Sqft | Rent | $/sqft | DOM | Units | Dist |
|---|---|---|---|---|---|---|---|---|
| 7611 E 47th Ter Kansas City, MO | 3.0 | 1.0 | 840 | $1,276 | $1.52 | 7d | 1 | 0.66mi |
| 4730 Richmond Ave Kansas City, MO | 3.0 | 1.0 | 821 | $1,395 | $1.70 | 44d | 1 | 0.66mi |
| 5312 Hunter St Raytown, MO | 3.0 | 1.5 | 912 | $1,450 | $1.59 | 2d | 1 | 0.77mi |
| 5312 Hunter St Raytown, MO | 3.0 | 1.5 | 912 | $1,450 | $1.59 | 3d | 1 | 0.77mi |
| 8855 E 59th St Raytown, MO | 3.0 | 1.5 | 864 | $1,396 | $1.62 | 44d | 1 | 1.10mi |
Listing history 13 events
-
2026-06-17status $139,900 Pending 19 DOM
-
2026-06-17days on market $139,900 Active 19 DOM
-
2026-06-16days on market $139,900 Active 18 DOM
-
2026-06-15days on market $139,900 Active 17 DOM
-
2026-06-13days on market $139,900 Active 15 DOM
-
2026-06-13days on market $139,900 Active 14 DOM
-
2026-06-09days on market $139,900 Active 11 DOM
-
2026-06-08days on market $139,900 Active 10 DOM
-
2026-06-07days on market $139,900 Active 9 DOM
-
2026-06-03days on market $139,900 Active 5 DOM
-
2026-06-02days on market $139,900 Active 4 DOM
-
2026-06-01days on market $139,900 Active 3 DOM
-
2026-05-31days on market $139,900 Active 2 DOM
ⓘ Source: listings_history table (triggers on properties + properties_extension) + one-shot
backfill from property_details.listing_events for pre-trigger history.
Tax reassessment forecast MO · Resets to sale price
- Current annual tax
- $934 · $78/mo
- Projected year-2 tax
- $1,357 · $113/mo
- Expected delta
- +$423/yr (+$35/mo · 45.2%)
ⓘ Screening estimate from a state-policy table — verify with the county assessor before closing.
Climate risk First Street
- Flood 1/10 Low FEMA zone X (unshaded) · 0% chance over 30 yrs
- Wildfire 1/10 Low
- Heat 4/10 Moderate 7 d/yr ≥107°F today · 16 d/yr by 30 yrs out
- Wind 2/10 Low
- Air quality 3/10 Moderate 3 unhealthy d/yr today · 5 by 30 yrs out
Nearby sold comps map
Loading sold comps map…
Walkable amenities ~0.75 mi
Loading nearby amenities…
Taxation est. · year 1
- Rental income
- $19,566
- − Mortgage interest
- −$7,837
- − Property taxes
- −$934
- − Insurance
- −$700
- − Repairs & maintenance
- −$1,565
- − Management
- −$1,565
- − Depreciation
- −$4,070
- Taxable income
- $2,895
- Est. tax owed @ 24.0%
- −$695
- After-tax cash flow
- $4,325/yr
For passive investors: Depreciation is non-cash, so a rental often shows a tax loss while cash-flowing — sheltering income. Rental losses are passive: they offset passive income freely, and up to $25,000/yr can offset ordinary (W-2) income if you actively participate and your MAGI is under $100k (phasing out to $0 by $150k); unused losses carry forward. On sale, claimed depreciation is recaptured at up to 25%, and gains may owe capital-gains tax (a 1031 exchange can defer both). Figures are a year-1 estimate at your 24.0% rate — not tax advice; consult a CPA.
Schools (NCES district)
- District
- Raytown C-2
- NCES district ID
- 2926070
- Math proficiency
- 12% ▼ -11.00%
- Reading proficiency
- 28% ▼ -9.00%
- Median HH income
- $47,215
- Composite
- 17.59/100
- National rank
- #9039
- State rank
- #302 of 324 in MO
Livability — Kansas City
- Score
- 78/100
- State rank
- #28
- US rank
- #2671
Category grades
Schools grade is shown separately in the Schools card above.
Census & demographics
- Census place
- Kansas City, MO
- County
- Jackson County · 687,798 people
- City population
- 439,467
- Metro
- Kansas City, MO-KS
- Population (ZIP)
- 9,267
- Household income
- $51,310
- Rent vs Own
- Severe rent burden
- 349.0
Population outlook (Jackson County) Hauer SSP2
- Today (2025)
- 719,589 people
- By 2030
- 731,456 · +1.6%
- By 2040
- 746,689 · +3.8%
- By 2050
- 749,289 · +4.1%
- By 2075
- 736,227 · +2.3%
- By 2100
- 668,210 · -7.1%
Race, ethnicity, and origin ACS 2023
- Neighborhood character
- Diverse neighborhood (Simpson 0.65)
- Race & ethnicity
- Black 45% White 37% Hispanic / Latino 11% Two or more races 9%
- Hispanic origin (detail)
- Mexican 6%
- Common ancestry
- Lithuanian 4% Italian 2% Armenian 1%
- Foreign-born
- 8% · Canada
- Languages at home
- 87% English-only · Spanish 8% Arabic 1%
Political lean MEDSL · Jackson
- 2024 margin
- D (+19.3) · D 58.9% · R 39.5% · Other 1.6%
- 2008→2024 swing
- -6.1pp toward R · 2008: 25.4pp · 2024: 19.3pp
- All cycles
- 2024: D+19.3 2020: D+22.0 2016: D+16.6 2012: D+19.0 2008: D+25.4
Not yet ingested
- Civics
- —
Market trends
- HPI YoY
- ▼ -32.25%
- Current HPI
- 297.5233
- Rent YoY
- —
- Metro
- Kansas City, MO-KS
- State GDP YoY
- ▲ 1.84%
- F500 in state
- 20
Industry mix (Fortune 500 HQ in MO)
| Industry | F500 HQs | Revenue |
|---|---|---|
| Healthcare | 1 | $163B |
|
||
| Insurance | 1 | $21B |
|
||
| Industrial Technology | 1 | $17B |
|
||
| Retail | 1 | $16B |
|
||
| Industrial Distribution | 1 | $10B |
|
||
| Utilities | 1 | $9B |
|
||
Price history
+250.2% since first listed15 events — show timeline
- 2026-05-29 Listed $139,900 Heartland MLS as Distributed by MLS Grid
- 2025-09-05 Rental Removed $1,400 RENTSPREE
- 2025-08-12 Listed for Rent $1,400 RENTSPREE
- 2024-10-06 Rental Removed $1,400 APPFOLIO
- 2024-09-20 Listed for Rent $1,400 APPFOLIO
- 2024-09-02 Listing Removed — Heartland MLS as Distributed by MLS Grid
- 2024-08-05 Listed $149,000 Heartland MLS as Distributed by MLS Grid
- 2024-04-29 Sold (Public Records) — Public Records
- 2021-01-20 Sold (Public Records) — Public Records
- 2007-07-16 Listed $59,900 Heartland MLS as Distributed by MLS Grid
- 2001-01-31 Sold (Public Records) — Public Records
- 2001-01-20 Sold (MLS) — Heartland MLS as Distributed by MLS Grid
- 2000-12-08 Listed $39,950 Heartland MLS as Distributed by MLS Grid
- 1999-07-20 Sold (Public Records) — Public Records
- 1984-12-01 Sold (Public Records) — Public Records
Property tax history
+2.2%/yrLatest (2025): $934 · -14.8% YoY. Source: county tax records.
Cash-flow waterfall
monthlySold comps — $/sqft
last 12 mo · ≤1 miLoading sold comps…