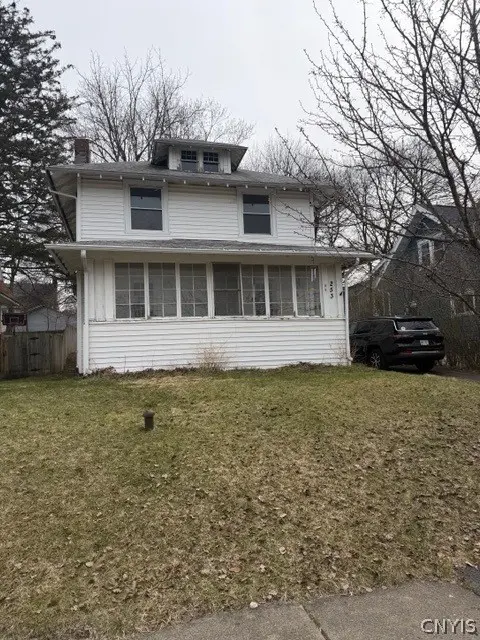
253 Fenway Dr · Syracuse, NY
Flood risk 1/10 · Minimal
- FEMA flood zone
- X (unshaded)
- Chance of flooding over 30 yrs
- 0.0%
- Est. flood insurance / yr
- $473 – $860
Fire risk 1/10 · Minimal
- Est. fire insurance / yr
- $691 – $1,283
Heat risk 3/10 · Minor
- Hot days now (above 94°F)
- 7 days/yr
- Hot days in 30 yrs
- 16 days/yr
Wind risk 1/10 · Minimal
- Chance of severe wind over 30 yrs
- 0.0%
Air-quality risk 2/10 · Minimal
- Unhealthy air days now
- 0 days/yr
- Unhealthy air days in 30 yrs
- 1 days/yr
Risk factors via First Street. Map © Google.
Why this score? — see what drove the B- grade
The composite is a weighted blend of 9 inputs, each scored 0–100. Each bar is that input's sub-score; the figure is the points it added to the 100-point composite (weight × sub-score).
- Cash flow +23.0/30.0
- ARV discount +11.0/15.0
- Appreciation +8.6/10.0
- DSCR +7.4/10.0
- 1% rule +5.0/10.0
- Livability +3.9/5.0
- Rent growth +2.5/5.0
- Condition / age +2.5/5.0
- Schools +1.8/10.0
$199,900
🖨 Deal sheet 📄 Offer letter ✓ Due diligence
Listing remarks
Welcome to 253 Fenway Drive! Located in the University Neighborhood, this 5 bedroom 1 1/2 bath home is ready for new owners. Hardwoods throughout, an enclosed front porch, off-street parking and full attic are just some of it's highlights. The upstairs bathroom has been remodeled. The entire house has been freshly painted inside and the kitchen has a new stove, cabinets and countertops. The neighborhood itself is great for taking walks. It's located close to downtown Syracuse, Syracuse University, Le Moyne College and many wonderful restaurants and shopping areas.
Key facts
- New stove
- Remodeled bathroom
- Freshly painted
Tags
Neighborhood map
What this means for you Summary
Snapshot
- This is a 4-bed/1.5-bath single-family listed at $200k.
Deal economics
- At list price, monthly cash flow is $355 ($4k/yr) — positive.
- The deal already cash-flows at list — no discount required.
- Meets the 1% rule at list price ($2k rent vs $200k).
- Recommended offer: $194k (3.0% below list) — sets the bar for market timing.
Location & tenants
- Location reads 77/100 on livability (#187 in NY, #2,869 nationally) — a middle-class / working-renter tenant base. Strengths: amenities A+, commute A+, cost of living A+; Watch: schools D+, crime F, employment D-.
- Syracuse City School District (urban): math 18% / reading 26% proficiency, ranked #590 of 590 in NY (top 100%) — low school quality limits family demand, transient renter base, plan for 1-2y turnover; 74% free/reduced lunch — lower-income household profile, screen leases tightly.
- Market conditions: 24 active listings in the ZIP; 12 comparable units currently listed for rent nearby; rentals at typical pace (median 21d on market — plan ~3-4 weeks tenant-placement turnaround); solid renter incomes; 616 units permitted in Onondaga County in 2024 (256 in 5+ unit buildings).
- This rent runs 31% of the median local income ($76k/yr) — at the standard rent-burdened threshold; future hikes will face affordability resistance.
Forward outlook
- In year one you build about $16k of equity ($1k loan paydown + $14k appreciation (7.2% local appreciation)).
- Onondaga County population projected to shrink 9% by 2050 — rents likely to lag national; underwrite the cash flow, not the appreciation.
- At projected returns (7.2% appreciation + 3.0% rent growth), your $56k cash investment doubles in ~3 years — after that, you're playing with house money.
- By year 3, paydown + projected appreciation supports a ~$39k cash-out refi (75% LTV) — recoverable capital for the next deal without selling this one.
Negotiation context
- It's been on market 52 days — a 3% lower offer ($194k) is reasonable based on typical stale-listing flexibility.
- 2 sale attempts since 11y ago with the ask held roughly flat each time — persistent listings suggest the price (not the market) is what's stuck; bring a comps-based counter.
- Current owner paid $24k; list at $200k implies a 733% gain — meaningful room to come down on a strong offer.
Risks & watch-outs
- Watch-outs: built in 1925 — expect roof / HVAC / electrical / plumbing capex.
Questions for the listing agent
- It's been on market 52 days. Have you received any prior offers? Is the seller open to a 3% concession, seller financing, or rate buy-down credit?
- Built in 1925 — when were the roof, HVAC, electrical panel, plumbing, and water heater last replaced?
- Is there a deadline driving the sale (1031 exchange, divorce, estate, relocation)? That informs how much negotiation room exists.
- Schools are D-rated, which usually means shorter tenancies and higher turnover. Who's the typical renter profile here, and what's been the actual vacancy rate?
- Crime grade is F in this area — have there been break-ins, vandalism, or insurance claims at this property in the last 3 years? What carrier currently insures it and at what premium?
- What's the average days-on-market for RENTAL listings here right now (not sales)? A rising rental-DOM trend means longer vacancies and softer asking-rent achievability than the comps imply.
- What's the recent tenant-quality profile in this submarket — average credit score on applications, eviction rate, late-payment / NSF rate, and stable-employment percentage? A property-management company in the area should have these aggregated.
- How much new for-sale + rental construction is in the pipeline within 1–3 miles? Heavy new supply typically softens prices + rents 12–24 months out; constrained supply supports both.
Investment metrics
- 1% rule
- 1.00% ✓
- Cap rate
- 8.42%
- Cash-on-cash
- 7.61%
- DSCR
- 1.34
- GRM
- 8.3
CMA / ARV
- ARV (on-the-fly)
- $217,008
- Comps found
- 12
Show comp detail 12 sales within ~0.75 mi
| Address | Dist | Beds/Ba | Sqft | Sold | Price | $/sf | Match |
|---|---|---|---|---|---|---|---|
| 253 Fenway Dr | 0.00mi | 5/1.5 (+1) | 1,584 (0%) | 1mo | $195,000 | $123 | 94 |
| 144 Didama St | 0.20mi | 4/2.0 | 1,585 (+0%) | 1mo | $79,000 | $50 | 88 |
| 218 Candee Ave | 0.26mi | 4/1.5 | 1,672 (+6%) | 1mo | $225,000 | $135 | 78 |
| 2429 E Fayette St | 0.14mi | 4/2.0 | 1,742 (+10%) | 4mo | $190,000 | $109 | 72 |
| 335 Bruce St | 0.06mi | 5/3.0 (+1) | 1,680 (+6%) | 8mo | $270,000 | $161 | 69 |
| 518 Seeley Rd | 0.35mi | 3/2.0 (-1) | 1,563 (-1%) | 7mo | $190,000 | $122 | 69 |
| 153 Milnor Ave | 0.45mi | 4/1.5 | 1,611 (+2%) | 9mo | $265,000 | $164 | 68 |
| 131 Fayette Blvd | 0.43mi | 3/1.5 (-1) | 1,497 (-6%) | 6mo | $199,000 | $133 | 60 |
| 250 Scottholm | 0.55mi | 3/1.5 (-1) | 1,680 (+6%) | 6mo | $278,000 | $165 | 54 |
| 151 Houston Ave | 0.46mi | 3/2.5 (-1) | 1,440 (-9%) | 3mo | $276,000 | $192 | 52 |
| 161 Houston Ave | 0.46mi | 4/3.0 | 1,440 (-9%) | 9mo | $240,000 | $167 | 50 |
| 415 Greenwood Pl | 0.75mi | 4/1.5 | 1,711 (+8%) | 2mo | $235,000 | $137 | 50 |
Match score weights: distance 35% · size 25% · config 20% · recency 20%. Top-matched comps best support the ARV.
Projected returns pro-forma
7.21% appreciation · 3.0% rent growth · sell at horizon
- IRR
- 24.2%
- Equity multiple
- 2.70×
- Total profit
- $94,913
- Equity at exit
- $141,266
- IRR
- 22.3%
- Equity multiple
- 5.62×
- Total profit
- $258,612
- Equity at exit
- $270,862
Cash invested: $55,972 (down + closing). Projections, not guarantees.
Landlord ↔ Tenant lean methodology
- Overall (STATE)
- 15 Strongly Tenant-Friendly
- State New York
- 15 Strongly Tenant-Friendly · D+10
- County
- — inherits STATE
- City
- — inherits STATE
ZIP-level market 13224
- Home prices YoY
- 2.1%
- Active inventory
- 24
- Price-to-rent
- 8.3×
Monthly cashflow live
- Estimated rent
- $2,002 high interval (Pro) →
- Mortgage (P&I)
- −$1,048
- Tax from tax record
- −$95 /mo · $1,141/yr
- Insurance
- −$83
- HOA
- −$0
- Vacancy / Maint / Mgmt
- −$420
- Net cashflow
- $355
Break-even live
UW: 25.0% down · 7.5% · 30yr · 1.5% tax · 5.0% vac · 8.0% maint · 8.0% mgmt
Financing live
Cash to close
- Down payment
- $49,975
- Closing costs
- $5,997
- Reserves months
- —
- Total cash needed
- —
Loan-product check · same deal, 3 products live
Conventional
25% down · 7.5% · 30yr
- Down + closing
- —
- Monthly P&I
- —
- Monthly cashflow
- —
- DSCR
- —
- Eligible?
- —
Personal DTI + credit; lowest rate.
DSCR
20% down · 8.5% · 30yr
- Down + closing
- —
- Monthly P&I
- —
- Monthly cashflow
- —
- DSCR
- —
- Eligible?
- —
No personal income docs; deal must DSCR.
Hard money
10% down · 12.0% · 12mo
- Down + closing
- —
- Monthly P&I
- —
- Monthly cashflow
- —
- DSCR
- —
- Eligible?
- —
Short-term bridge; refi at stabilization.
Rent comps 12 comps
| Address | Beds | Baths | Sqft | Rent | $/sqft | DOM | Units | Dist |
|---|---|---|---|---|---|---|---|---|
| 118 Niven St Syracuse, NY | 3.0 | 1.0 | 1150 | $1,650 | $1.43 | 21d | 1 | 0.14mi |
| 205 Fellows Ave Unit 1 Syracuse, NY | 3.0 | 1.0 | 1638 | $1,800 | $1.10 | 21d | 1 | 0.46mi |
| 108 Harrington Rd Syracuse, NY | 3.0 | 2.0 | 1800 | $2,600 | $1.44 | 13d | 1 | 0.59mi |
| 135 Lexington Ave Unit 22 Syracuse, NY | 5.0 | 2.0 | 1150 | $2,500 | $2.17 | 43d | 1 | 0.61mi |
| 922 Westcott St Syracuse, NY | 4.0 | 2.0 | 1700 | $2,000 | $1.18 | 21d | 1 | 0.96mi |
| 1108 Madison St Unit 2 Syracuse, NY | 3.0 | 1.5 | 1580 | $2,080 | $1.32 | 43d | 1 | 0.99mi |
| 953-55 Westcott St Unit 955 Syracuse, NY | 3.0 | 1.0 | 1286 | $1,500 | $1.17 | 43d | 1 | 0.99mi |
| 620 Euclid Ave Apt 1 Syracuse, NY | 3.0 | 1.0 | 1248 | $1,700 | $1.36 | 43d | 1 | 1.00mi |
| 204 Mariposa St Unit pvt house Syracuse, NY | 3.0 | 1.0 | 1128 | $2,137 | $1.89 | 13d | 1 | 1.13mi |
| 121 Doll Pkwy Unit A Syracuse, NY | 4.0 | 2.0 | 1400 | $2,800 | $2.00 | 13d | 1 | 1.14mi |
| 202 Stafford Ave Syracuse, NY | 3.0 | 1.0 | 1692 | $1,800 | $1.06 | 13d | 1 | 1.31mi |
| 1801 James St #2 Syracuse, NY | 3.0 | 1.0 | 1244 | $1,800 | $1.45 | 13d | 1 | 1.43mi |
Listing history 5 events
-
2026-05-21status Pending
-
2026-04-04historical Active Under Contract
-
2026-03-30$199,900 Active
-
2015-07-10$1,200
-
2005-02-11soldstatus $24,000
ⓘ Source: listings_history table (triggers on properties + properties_extension) + one-shot
backfill from property_details.listing_events for pre-trigger history.
Tax reassessment forecast NY · Partial reset (capped growth)
- Current annual tax
- $1,141 · $95/mo
- Projected year-2 tax
- $2,260 · $188/mo
- Expected delta
- +$1,119/yr (+$93/mo · 98.1%)
ⓘ Screening estimate from a state-policy table — verify with the county assessor before closing.
Climate risk First Street
- Flood 1/10 Low FEMA zone X (unshaded) · 0% chance over 30 yrs
- Wildfire 1/10 Low
- Heat 3/10 Moderate 7 d/yr ≥94°F today · 16 d/yr by 30 yrs out
- Wind 1/10 Low 0% chance of damaging wind over 30 yrs
- Air quality 2/10 Low 0 unhealthy d/yr today · 1 by 30 yrs out
Nearby sold comps map
Loading sold comps map…
Walkable amenities ~0.75 mi
Loading nearby amenities…
Taxation est. · year 1
- Rental income
- $24,022
- − Mortgage interest
- −$11,198
- − Property taxes
- −$1,141
- − Insurance
- −$1,000
- − Repairs & maintenance
- −$1,922
- − Management
- −$1,922
- − Depreciation
- −$5,815
- Taxable income
- $1,025
- Est. tax owed @ 24.0%
- −$246
- After-tax cash flow
- $4,011/yr
For passive investors: Depreciation is non-cash, so a rental often shows a tax loss while cash-flowing — sheltering income. Rental losses are passive: they offset passive income freely, and up to $25,000/yr can offset ordinary (W-2) income if you actively participate and your MAGI is under $100k (phasing out to $0 by $150k); unused losses carry forward. On sale, claimed depreciation is recaptured at up to 25%, and gains may owe capital-gains tax (a 1031 exchange can defer both). Figures are a year-1 estimate at your 24.0% rate — not tax advice; consult a CPA.
Schools (NCES district)
- District
- Syracuse City School District
- NCES district ID
- 3628590
- Math proficiency
- 18% ▼ -5.00%
- Reading proficiency
- 26% ▬ 0.00%
- Median HH income
- $32,097
- Composite
- 17.83/100
- National rank
- #9007
- State rank
- #590 of 590 in NY
Livability — Syracuse
- Score
- 77/100
- State rank
- #187
- US rank
- #2869
Category grades
Schools grade is shown separately in the Schools card above.
Census & demographics
- Census place
- Syracuse, NY
- County
- Onondaga County · 247,257 people
- City population
- 152,627
- Metro
- Syracuse, NY
- Population (ZIP)
- 8,659
- Household income
- $76,500
- Rent vs Own
- Severe rent burden
- 423.0
Population outlook (Onondaga County) Hauer SSP2
- Today (2025)
- 467,894 people
- By 2030
- 463,381 · -1.0%
- By 2040
- 447,697 · -4.3%
- By 2050
- 426,399 · -8.9%
- By 2075
- 373,661 · -20.1%
- By 2100
- 307,967 · -34.2%
Race, ethnicity, and origin ACS 2023
- Neighborhood character
- Diverse neighborhood (Simpson 0.67)
- Race & ethnicity
- White 47% Black 32% Two or more races 10% Hispanic / Latino 8% Asian 6%
- Hispanic origin (detail)
- Puerto Rican 3% Cuban 1% Dominican 2%
- Common ancestry
- Romanian 3% Arab 2% Subsaharan African 2%
- Foreign-born
- 16% · Canada, China, Jamaica
- Languages at home
- 84% English-only · Spanish 6% Arabic 4% Other Indo-European 2%
Political lean MEDSL · Onondaga
- 2024 margin
- D (+17.3) · D 58.6% · R 41.4%
- 2008→2024 swing
- -3.0pp toward R · 2008: 20.3pp · 2024: 17.3pp
- All cycles
- 2024: D+17.3 2020: D+20.6 2016: D+12.8 2012: D+21.1 2008: D+20.3
Not yet ingested
- Civics
- —
Market trends
- HPI YoY
- ▲ 7.21%
- Current HPI
- 350.9419
- Rent YoY
- —
- Metro
- Syracuse, NY
- State GDP YoY
- ▲ 2.60%
- F500 in state
- 92
Industry mix (Fortune 500 HQ in NY)
| Industry | F500 HQs | Revenue |
|---|---|---|
| Financial Services | 10 | $950B |
|
||
| Consumer Goods | 9 | $162B |
|
||
| Insurance | 4 | $225B |
|
||
| Telecommunications | 2 | $144B |
|
||
| Pharmaceuticals | 2 | $112B |
|
||
| Media / Entertainment | 2 | $69B |
|
||
Price history
+732.9% since first listed5 events — show timeline
- 2026-05-21 Pending — CNYIS
- 2026-04-04 Contingent — CNYIS
- 2026-03-30 Listed $199,900 CNYIS
- 2015-07-10 Listed $1,200 WNYREIS
- 2005-02-11 Sold (Public Records) $24,000 Public Records
Property tax history
+0.0%/yrLatest (2025): $1,141 · +0.0% YoY. Source: county tax records.
Cash-flow waterfall
monthlySold comps — $/sqft
last 12 mo · ≤1 miLoading sold comps…