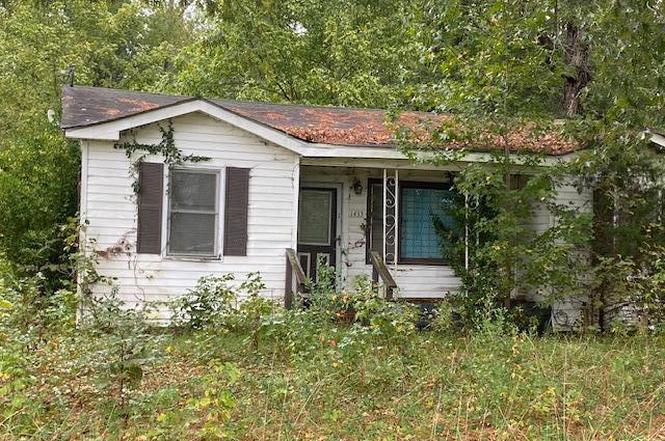
1433 Bell Town Rd · Williamston, NC
Flood risk 1/10 · Minimal
- FEMA flood zone
- X (unshaded)
- Chance of flooding over 30 yrs
- 0.0%
- Est. flood insurance / yr
- $507 – $1,088
Fire risk 5/10 · Moderate
- Est. fire insurance / yr
- $906 – $1,684
Heat risk 8/10 · Major
- Hot days now (above 107°F)
- 7 days/yr
- Hot days in 30 yrs
- 16 days/yr
Wind risk 8/10 · Major
- Chance of severe wind over 30 yrs
- 80.0%
Air-quality risk 2/10 · Minimal
- Unhealthy air days now
- 1 days/yr
- Unhealthy air days in 30 yrs
- 1 days/yr
Risk factors via First Street. Map © Google.
Why this score? — see what drove the B+ grade
The composite is a weighted blend of 9 inputs, each scored 0–100. Each bar is that input's sub-score; the figure is the points it added to the 100-point composite (weight × sub-score).
- Cash flow +30.0/30.0
- 1% rule +10.0/10.0
- DSCR +10.0/10.0
- Appreciation +7.6/10.0
- ARV discount +7.5/15.0
- Livability +2.9/5.0
- Rent growth +2.5/5.0
- Condition / age +2.5/5.0
- Schools +2.4/10.0
$40,000
🖨 Deal sheet 📄 Offer letter ✓ Due diligence
Listing remarks
INVESTMENT PROPERTY. SOLD ''AS IS''.
Key facts
- 0.32 acre lot
- Built 1962
- Listed 224 days
Property features AI
Exterior
- Parking: On-site parking (no garage)
- Utilities: Other utilities
- Home design: Single-family residence; One level
- Construction: Vinyl siding and wood frame construction
- Exterior features: Shingle roof; Paved road access
Interior
- Bathrooms: 1 full bathroom
- Heating & cooling: No central heating; No cooling
- Interior features: Crawl space basement; Total of 3 rooms
Neighborhood map
What this means for you Summary
Snapshot
- This is a 3-bed/1.0-bath single-family listed at $40k.
Deal economics
- At list price, monthly cash flow is $517 ($6k/yr) — positive.
- The deal already cash-flows at list — no discount required.
- Meets the 1% rule at list price ($983 rent vs $40k).
- Recommended offer: $35k (12.0% below list) — sets the bar for market timing.
- Cap rate 21.8% vs local median 4.6% in Williamston — top-decile yield for the area; either an underpriced asset or a hidden risk that comps aren't pricing in. Stress-test before assuming the spread holds.
Location & tenants
- Location reads 58/100 on livability (#584 in NC) — a working-class tenant base; expect higher turnover. Strengths: cost of living A+, health & safety A+, housing B+; Watch: crime F, amenities F, commute F.
- Martin County Schools (rural): math 24% / reading 34% proficiency, ranked #150 of 178 in NC (top 84%) — low school quality limits family demand, transient renter base, plan for 1-2y turnover; 62% free/reduced lunch — lower-income household profile, screen leases tightly.
- Zoned schools: Riverside Middle (math 18% / reading 33%, grade F, #388 of 475 statewide, top 83%, 364 students, 99% FRL); Riverside High (math 22% / reading 37%, grade F, #459 of 535 statewide, top 87%, 447 students, 99% FRL) — zoned schools average 99% FRL vs 62% district-wide (37 pts higher); higher-poverty schools than district average — tighter screening recommended.
- Market conditions: 72 active listings in the ZIP.
Forward outlook
- In year one you build about $2k of equity ($277 loan paydown + $2k appreciation (5.1% local appreciation)).
- Martin County population projected at -33% by 2050 — secular population decline; favor cash flow + early exit over multi-decade hold.
- At projected returns (5.1% appreciation + 3.0% rent growth), your $11k cash investment doubles in ~2 years — after that, you're playing with house money.
Negotiation context
- It's been on market 225 days — a 12% lower offer ($35k) is reasonable based on typical stale-listing flexibility.
- 2 sale attempts; this cycle's ask has dropped $10k (20%) from the opening price — seller is motivated, your offer sets the floor, not the list.
Risks & watch-outs
- Climate carrying-cost: severe wind risk, 80% chance of damaging wind over 30y; moderate wildfire risk; extreme-heat days projected 7→16/yr by 2055 (HVAC capex compounding) — expect insurance premiums to compound above CPI over the hold.
Questions for the listing agent
- It's been on market 225 days. Have you received any prior offers? Is the seller open to a 12% concession, seller financing, or rate buy-down credit?
- Built in 1962 — when were the roof, HVAC, electrical panel, plumbing, and water heater last replaced?
- Why hasn't it sold? Are there any deal-killer items the seller is aware of (foundation, flood, title, zoning, code violations)?
- Is there a deadline driving the sale (1031 exchange, divorce, estate, relocation)? That informs how much negotiation room exists.
- Schools are D-rated, which usually means shorter tenancies and higher turnover. Who's the typical renter profile here, and what's been the actual vacancy rate?
- Crime grade is F in this area — have there been break-ins, vandalism, or insurance claims at this property in the last 3 years? What carrier currently insures it and at what premium?
- What's the average days-on-market for RENTAL listings here right now (not sales)? A rising rental-DOM trend means longer vacancies and softer asking-rent achievability than the comps imply.
- What's the recent tenant-quality profile in this submarket — average credit score on applications, eviction rate, late-payment / NSF rate, and stable-employment percentage? A property-management company in the area should have these aggregated.
- How much new for-sale + rental construction is in the pipeline within 1–3 miles? Heavy new supply typically softens prices + rents 12–24 months out; constrained supply supports both.
Investment metrics
- 1% rule
- 2.46% ✓
- Cap rate
- 21.79%
- Cash-on-cash
- 55.36%
- DSCR
- 3.46
- GRM
- 3.4
CMA / ARV
No comps found within radius.
Projected returns pro-forma
5.13% appreciation · 3.0% rent growth · sell at horizon
- IRR
- 62.7%
- Equity multiple
- 4.79×
- Total profit
- $42,416
- Equity at exit
- $22,972
- IRR
- 60.4%
- Equity multiple
- 9.90×
- Total profit
- $99,661
- Equity at exit
- $39,900
Cash invested: $11,200 (down + closing). Projections, not guarantees.
Landlord ↔ Tenant lean methodology
- Overall (STATE)
- 85 Strongly Landlord-Friendly
- State North Carolina
- 85 Strongly Landlord-Friendly · R+3
- County
- — inherits STATE
- City
- — inherits STATE
ZIP-level market 27892
- Home prices YoY
- 3.0%
- Active inventory
- 72
- Price-to-rent
- 3.4×
Monthly cashflow live
- Estimated rent
- $983 medium interval (Pro) →
- Mortgage (P&I)
- −$210
- Tax from tax record
- −$34 /mo · $406/yr
- Insurance
- −$17
- HOA
- −$0
- Vacancy / Maint / Mgmt
- −$207
- Net cashflow
- $517
Break-even live
UW: 25.0% down · 7.5% · 30yr · 1.5% tax · 5.0% vac · 8.0% maint · 8.0% mgmt
Financing live
Cash to close
- Down payment
- $10,000
- Closing costs
- $1,200
- Reserves months
- —
- Total cash needed
- —
Loan-product check · same deal, 3 products live
Conventional
25% down · 7.5% · 30yr
- Down + closing
- —
- Monthly P&I
- —
- Monthly cashflow
- —
- DSCR
- —
- Eligible?
- —
Personal DTI + credit; lowest rate.
DSCR
20% down · 8.5% · 30yr
- Down + closing
- —
- Monthly P&I
- —
- Monthly cashflow
- —
- DSCR
- —
- Eligible?
- —
No personal income docs; deal must DSCR.
Hard money
10% down · 12.0% · 12mo
- Down + closing
- —
- Monthly P&I
- —
- Monthly cashflow
- —
- DSCR
- —
- Eligible?
- —
Short-term bridge; refi at stabilization.
Listing history 19 events
-
2026-06-19days on market $40,000 Active 225 DOM
-
2026-06-18days on market $40,000 Active 224 DOM
-
2026-06-17days on market $40,000 Active 223 DOM
-
2026-06-16days on market $40,000 Active 222 DOM
-
2026-06-15days on market $40,000 Active 221 DOM
-
2026-06-14days on market $40,000 Active 219 DOM
-
2026-06-12days on market $40,000 Active 218 DOM
-
2026-06-09days on market $40,000 Active 215 DOM
-
2026-06-08days on market $40,000 Active 214 DOM
-
2026-06-07days on market $40,000 Active 213 DOM
-
2026-06-03days on market $40,000 Active 209 DOM
-
2026-06-02days on market $40,000 Active 208 DOM
-
2026-06-01days on market $40,000 Active 207 DOM
-
2026-05-31days on market $40,000 Active 206 DOM
-
2026-05-30days on market $40,000 Active 205 DOM
-
2026-05-06status Active
-
2026-04-13historical
-
2025-11-18price $40,000
-
2025-10-13$50,000 Active
ⓘ Source: listings_history table (triggers on properties + properties_extension) + one-shot
backfill from property_details.listing_events for pre-trigger history.
Tax reassessment forecast NC · Resets to sale price
- Current annual tax
- $406 · $34/mo
- Projected year-2 tax
- $406 · $34/mo
- Expected delta
- $0/yr ($0/mo · 0.0%)
ⓘ Screening estimate from a state-policy table — verify with the county assessor before closing.
Climate risk First Street
- Flood 1/10 Low FEMA zone X (unshaded) · 0% chance over 30 yrs
- Wildfire 5/10 Major
- Heat 8/10 Severe 7 d/yr ≥107°F today · 16 d/yr by 30 yrs out
- Wind 8/10 Severe 80% chance of damaging wind over 30 yrs
- Air quality 2/10 Low 1 unhealthy d/yr today · 1 by 30 yrs out
Nearby sold comps map
Loading sold comps map…
Walkable amenities ~0.75 mi
Loading nearby amenities…
Taxation est. · year 1
- Rental income
- $11,801
- − Mortgage interest
- −$2,241
- − Property taxes
- −$406
- − Insurance
- −$200
- − Repairs & maintenance
- −$944
- − Management
- −$944
- − Depreciation
- −$1,164
- Taxable income
- $5,903
- Est. tax owed @ 24.0%
- −$1,417
- After-tax cash flow
- $4,783/yr
For passive investors: Depreciation is non-cash, so a rental often shows a tax loss while cash-flowing — sheltering income. Rental losses are passive: they offset passive income freely, and up to $25,000/yr can offset ordinary (W-2) income if you actively participate and your MAGI is under $100k (phasing out to $0 by $150k); unused losses carry forward. On sale, claimed depreciation is recaptured at up to 25%, and gains may owe capital-gains tax (a 1031 exchange can defer both). Figures are a year-1 estimate at your 24.0% rate — not tax advice; consult a CPA.
Schools (NCES district)
- District
- Martin County Schools
- NCES district ID
- 3702880
- Math proficiency
- 24% ▼ -2.00%
- Reading proficiency
- 34% ▲ 1.00%
- Median HH income
- $35,403
- Composite
- 23.94/100
- National rank
- #7781
- State rank
- #150 of 178 in NC
Livability — Williamston
- Score
- 58/100
- State rank
- #584
- US rank
- #21504
Category grades
Schools grade is shown separately in the Schools card above.
Census & demographics
- Population (ZIP)
- 13,387
Population outlook (Martin County) Hauer SSP2
- Today (2025)
- 21,018 people
- By 2030
- 19,693 · -6.3%
- By 2040
- 16,793 · -20.1%
- By 2050
- 14,171 · -32.6%
- By 2075
- 9,804 · -53.4%
- By 2100
- 6,894 · -67.2%
Race, ethnicity, and origin ACS 2023
- Neighborhood character
- Diverse neighborhood (Simpson 0.57)
- Race & ethnicity
- White 53% Black 38% Two or more races 5% Hispanic / Latino 5%
- Hispanic origin (detail)
- Mexican 4%
- Common ancestry
- Slovak 2% Serbian 1% Iranian 1%
- Foreign-born
- 2% · Canada, China
- Languages at home
- 94% English-only · Spanish 5% Chinese 1%
Political lean MEDSL · Martin
- 2024 margin
- R (+10.3) · D 44.6% · R 54.9%
- 2008→2024 swing
- -15.0pp toward R · 2008: 4.6pp · 2024: -10.3pp
- All cycles
- 2024: R+10.3 2020: R+5.0 2016: R+0.5 2012: D+4.4 2008: D+4.6
Not yet ingested
- Civics
- —
Market trends
- HPI YoY
- ▲ 5.13%
- Current HPI
- 178.4817
- Rent YoY
- —
- Metro
- —
- State GDP YoY
- ▲ 3.28%
- F500 in state
- 26
Industry mix (Fortune 500 HQ in NC)
| Industry | F500 HQs | Revenue |
|---|---|---|
| Financial Services | 2 | $213B |
|
||
| Retail | 2 | $95B |
|
||
| Industrial Conglomerate | 1 | $38B |
|
||
| Metals / Steel | 1 | $35B |
|
||
| Utilities | 1 | $30B |
|
||
| Industrial Machinery | 1 | $19B |
|
||
Price history
-20.0% since first listed4 events — show timeline
- 2026-05-06 Relisted — Hive MLS
- 2026-04-13 Listing Removed — Hive MLS
- 2025-11-18 Price Changed $40,000 Hive MLS
- 2025-10-13 Listed $50,000 Hive MLS
Property tax history
-2.7%/yrLatest (2025): $406 · +63.1% YoY. Source: county tax records.
Cash-flow waterfall
monthlySold comps — $/sqft
last 12 mo · ≤1 miLoading sold comps…