801 W Dipper Ave · Pharr, TX
Flood risk 1/10 · Minimal
- FEMA flood zone
- X (shaded)
- Chance of flooding over 30 yrs
- 0.0%
- Est. flood insurance / yr
- $507 – $1,088
Fire risk 6/10 · Moderate
- Est. fire insurance / yr
- $1,222 – $2,270
Heat risk 9/10 · Severe
- Hot days now (above 111°F)
- 7 days/yr
- Hot days in 30 yrs
- 22 days/yr
Wind risk 8/10 · Major
- Chance of severe wind over 30 yrs
- 99.0%
Air-quality risk 1/10 · Minimal
- Unhealthy air days now
- 0 days/yr
- Unhealthy air days in 30 yrs
- 0 days/yr
Risk factors via First Street. Map © Google.
Why this score? — see what drove the C+ grade
The composite is a weighted blend of 9 inputs, each scored 0–100. Each bar is that input's sub-score; the figure is the points it added to the 100-point composite (weight × sub-score).
- Cash flow +21.2/30.0
- ARV discount +15.0/15.0
- 1% rule +8.1/10.0
- DSCR +6.7/10.0
- Livability +3.6/5.0
- Condition / age +2.5/5.0
- Rent growth +2.4/5.0
- Schools +2.0/10.0
- Appreciation +0.0/10.0
$87,000
🖨 Deal sheet (PDF) 📄 Offer letter ✓ Due diligence
Listing remarks
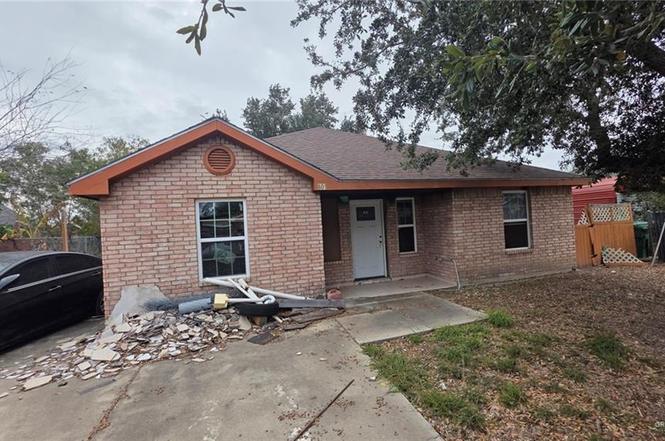
Investor opportunity in an established neighborhood. The home’s interior has been fully taken down to the studs due to an electrical fire, providing a clear starting point for renovation or redesign. New wiring, windows and doors have been installed. The exterior structure appears to be in generally workable condition, based on visual observation. This property may be suitable for investors, builders, or experienced renovators looking for a project. Buyers are encouraged to perform their own due diligence, including inspections and verification of all conditions, measurements, and suitability for intended use. Property is being sold as-is.
Key facts
- 6,023 sq ft lot
- Built 1999
- Listed 77 days
Property features AI
Finance
- HOA & community: No association
Exterior
- Parking: No garage; Other garage or carport
- Utilities: City sewer
- Home design: Not new construction
- Construction: Brick and siding construction; Slab foundation
- Exterior features: Manual gate; Chain link fencing; Shingle roof; Storage structure; Paved road access
Interior
- Kitchen: Electric water heater; No conveying appliances
- Flooring: Tile
- Bathrooms: 3 full bathrooms
- Heating & cooling: Central heating; Central air conditioning
- Interior features: Tile flooring; Double-pane windows; No window coverings; Countertops: other
Neighborhood map
What this means for you Summary
Snapshot
- This is a 2-bed/1.0-bath single-family listed at $87k.
Deal economics
- At list price, monthly cash flow is $125 ($2k/yr) — positive.
- The deal already cash-flows at list — no discount required.
- Meets the 1% rule at list price ($1k rent vs $87k).
- Recommended offer: $82k (6.0% below list) — sets the bar for market timing.
- Cap rate 8.0% vs local median 3.4% in Pharr — top-decile yield for the area; either an underpriced asset or a hidden risk that comps aren't pricing in. Stress-test before assuming the spread holds.
Location & tenants
- Location reads 72/100 on livability (#245 in TX) — a middle-class / working-renter tenant base. Strengths: cost of living A+, housing A+, health & safety A+; Watch: amenities F, commute F, employment F.
- Pharr-San Juan-Alamo ISD (suburban): math 18% / reading 30% proficiency, ranked #740 of 826 in TX (top 90%) — low school quality limits family demand, transient renter base, plan for 1-2y turnover; 72% free/reduced lunch — lower-income household profile, screen leases tightly.
- Zoned schools: Graciela Garcia El (math 17% / reading 22%, grade F, #3,583 of 4,322 statewide, top 86%, 402 students, 93% FRL); Kennedy Middle (math 22% / reading 27%, grade F, #1,279 of 1,662 statewide, top 78%, 580 students, 94% FRL); Psja Southwest Early College H S (math 18% / reading 37%, grade F, #1,183 of 1,632 statewide, top 73%, 1,692 students, 98% FRL) — zoned schools average 95% FRL vs 72% district-wide (23 pts higher); higher-poverty schools than district average — tighter screening recommended.
- Market conditions: Rents soft (-0.2%/yr); 451 active listings in the ZIP; 4 comparable units currently listed for rent nearby; rentals at typical pace (median 24d on market — plan ~3-4 weeks tenant-placement turnaround); 7,378 units permitted in Hidalgo County in 2024 (641 in 5+ unit buildings).
Forward outlook
- Local home prices are declining (-3.0%/yr); year-one equity from $601 of loan paydown is wiped out by about $3k of value loss. Plan a longer hold.
- Hidalgo County population projected at +28% by 2050 — long-run rental-demand tailwind backs the buy-and-hold thesis.
Negotiation context
- It's been on market 77 days — a 6% lower offer ($82k) is reasonable based on typical stale-listing flexibility.
Risks & watch-outs
- Watch-outs: property tax is 3.9% of price.
- Climate carrying-cost: severe wind risk, 99% chance of damaging wind over 30y; major wildfire risk; extreme-heat days projected 7→22/yr by 2055 (HVAC capex compounding) — expect insurance premiums to compound above CPI over the hold.
Questions for the listing agent
- It's been on market 77 days. Have you received any prior offers? Is the seller open to a 6% concession, seller financing, or rate buy-down credit?
- Property tax is high relative to price — has the assessment been appealed recently, and will the sale trigger a re-assessment?
- Why hasn't it sold? Are there any deal-killer items the seller is aware of (foundation, flood, title, zoning, code violations)?
- Is there a deadline driving the sale (1031 exchange, divorce, estate, relocation)? That informs how much negotiation room exists.
- Schools are D-rated, which usually means shorter tenancies and higher turnover. Who's the typical renter profile here, and what's been the actual vacancy rate?
- What's the average days-on-market for RENTAL listings here right now (not sales)? A rising rental-DOM trend means longer vacancies and softer asking-rent achievability than the comps imply.
- What's the recent tenant-quality profile in this submarket — average credit score on applications, eviction rate, late-payment / NSF rate, and stable-employment percentage? A property-management company in the area should have these aggregated.
- How much new for-sale + rental construction is in the pipeline within 1–3 miles? Heavy new supply typically softens prices + rents 12–24 months out; constrained supply supports both.
Investment metrics
- 1% rule
- 1.31% ✓
- Cap rate
- 8.02%
- Cash-on-cash
- 6.16%
- DSCR
- 1.27
- GRM
- 6.4
CMA / ARV
- ARV (on-the-fly)
- $139,392
- Comps found
- 12
Show comp detail 12 sales within ~0.75 mi
| Address | Dist | Beds/Ba | Sqft | Sold | Price | $/sf | Match |
|---|---|---|---|---|---|---|---|
| 801 W Dipper Ave | 0.00mi | 3/3.0 (+1) | 968 (0%) | 0mo | $87,000 | $90 | 87 |
| 803 W Dove Ave | 0.05mi | 3/1.0 (+1) | 1,008 (+4%) | 2mo | $159,000 | $158 | 84 |
| 802 W Cardinal Ave | 0.07mi | 3/1.0 (+1) | 1,032 (+7%) | 1mo | $145,000 | $141 | 80 |
| 814 W Sabatini Ave | 0.35mi | 2/1.0 | 968 (0%) | 11mo | $165,000 | $170 | 75 |
| 507 W La Quinta Dr | 0.29mi | 3/1.0 (+1) | 946 (-2%) | 11mo | $120,000 | $127 | 69 |
| 5801 S Azul Ln | 0.26mi | 3/1.0 (+1) | 895 (-8%) | 10mo | $149,900 | $167 | 62 |
| 5910 S Valdivia St | 0.37mi | 2/2.0 | 1,070 (+10%) | 2mo | $144,990 | $136 | 59 |
| 404 Flores St | 0.51mi | 3/2.0 (+1) | 968 (0%) | 11mo | $118,000 | $122 | 58 |
| 809 W Villa St | 0.31mi | 3/2.0 (+1) | 1,043 (+8%) | 6mo | $149,999 | $144 | 58 |
| 706 W Albatross Ave | 0.17mi | 3/2.0 (+1) | 1,108 (+14%) | 13mo | $195,000 | $176 | 48 |
| 1011 W Eagle Ave | 0.27mi | 3/2.0 (+1) | 1,108 (+14%) | 8mo | $175,000 | $158 | 48 |
| 721 Villa Ave | 0.69mi | 3/2.0 (+1) | 1,020 (+5%) | 5mo | $84,999 | $83 | 46 |
Match score weights: distance 35% · size 25% · config 20% · recency 20%. Top-matched comps best support the ARV.
Projected returns pro-forma
-3.0% appreciation · 0.0% rent growth · sell at horizon
- IRR
- -10.9%
- Equity multiple
- 0.62×
- Total profit
- $-9,342
- Equity at exit
- $12,972
- IRR
- -8.1%
- Equity multiple
- 0.58×
- Total profit
- $-10,265
- Equity at exit
- $7,522
Cash invested: $24,360 (down + closing). Projections, not guarantees.
Landlord ↔ Tenant lean methodology
- Overall (STATE)
- 87 Strongly Landlord-Friendly
- State Texas
- 87 Strongly Landlord-Friendly · R+5
- County
- — inherits STATE
- City
- — inherits STATE
ZIP-level market 78577
- Home prices YoY
- -8.1%
- Rents YoY
- -0.2%
- Active inventory
- 451
- Price-to-rent
- 6.4×
Monthly cashflow live
- Estimated rent
- $1,138 medium interval (Pro) →
- Mortgage (P&I)
- −$456
- Tax from tax record
- −$282 /mo · $3,382/yr
- Insurance
- −$36
- HOA
- −$0
- Vacancy / Maint / Mgmt
- −$239
- Net cashflow
- $125
Break-even live
Sensitivity live
| Price | -10% $174 | -5% $150 | +0% $125 | +5% $100 | +10% $76 |
|---|---|---|---|---|---|
| Rent | -10% $35 | -5% $80 | +0% $125 | +5% $170 | +10% $215 |
| Rate | -1.0pp $169 | -0.5pp $147 | base $125 | +0.5pp $103 | +1.0pp $80 |
UW: 25.0% down · 7.5% · 30yr · 1.5% tax · 5.0% vac · 8.0% maint · 8.0% mgmt
Financing live
Cash to close
- Down payment
- $21,750
- Closing costs
- $2,610
- Reserves months
- —
- Total cash needed
- —
Loan-product check · same deal, 3 products live
Conventional
25% down · 7.5% · 30yr
- Down + closing
- —
- Monthly P&I
- —
- Monthly cashflow
- —
- DSCR
- —
- Eligible?
- —
Personal DTI + credit; lowest rate.
DSCR
20% down · 8.5% · 30yr
- Down + closing
- —
- Monthly P&I
- —
- Monthly cashflow
- —
- DSCR
- —
- Eligible?
- —
No personal income docs; deal must DSCR.
Hard money
10% down · 12.0% · 12mo
- Down + closing
- —
- Monthly P&I
- —
- Monthly cashflow
- —
- DSCR
- —
- Eligible?
- —
Short-term bridge; refi at stabilization.
Rent comps 4 comps
| Address | Beds | Baths | Sqft | Rent | $/sqft | DOM | Units | Dist |
|---|---|---|---|---|---|---|---|---|
| 810 W Falcon Ave Pharr, TX | 3.0 | 1.0 | 968 | $1,150 | $1.19 | 14d | 1 | 0.15mi |
| 1625 W Marlin St Unit 3 Pharr, TX | 2.0 | 2.0 | 965 | $1,125 | $1.17 | 24d | 1 | 0.90mi |
| 901 E Thomas Dr Pharr, TX | 3.0 | 2.0 | 1100 | $1,295 | $1.18 | 24d | 1 | 1.33mi |
| 901 E Thomas Dr Pharr, TX | 2.0 | 2.0 | 900 | $998 | $1.11 | 21d | 1 | 1.33mi |
Listing history 6 events
-
2026-04-30status Pending
-
2026-04-27historical Option
-
2026-03-09price $87,000
-
2026-02-12$97,999 Active
-
2026-01-02soldstatus
-
1999-07-14soldstatus
ⓘ Source: listings_history table (triggers on properties + properties_extension) + one-shot
backfill from property_details.listing_events for pre-trigger history.
Tax reassessment forecast TX · Resets to sale price
- Current annual tax
- $3,382 · $282/mo
- Projected year-2 tax
- $3,382 · $282/mo
- Expected delta
- $0/yr ($0/mo · -0.0%)
ⓘ Screening estimate from a state-policy table — verify with the county assessor before closing.
Climate risk First Street
- Flood 1/10 Low FEMA zone X (shaded) · 0% chance over 30 yrs
- Wildfire 6/10 Major
- Heat 9/10 Extreme 7 d/yr ≥111°F today · 22 d/yr by 30 yrs out
- Wind 8/10 Severe 99% chance of damaging wind over 30 yrs
- Air quality 1/10 Low 0 unhealthy d/yr today · 0 by 30 yrs out
Nearby sold comps map
Loading sold comps map…
Walkable amenities ~0.75 mi
Loading nearby amenities…
Taxation est. · year 1
- Rental income
- $13,662
- − Mortgage interest
- −$4,873
- − Property taxes
- −$3,382
- − Insurance
- −$435
- − Repairs & maintenance
- −$1,093
- − Management
- −$1,093
- − Depreciation
- −$2,531
- Taxable income
- $255
- Est. tax owed @ 24.0%
- −$61
- After-tax cash flow
- $1,440/yr
For passive investors: Depreciation is non-cash, so a rental often shows a tax loss while cash-flowing — sheltering income. Rental losses are passive: they offset passive income freely, and up to $25,000/yr can offset ordinary (W-2) income if you actively participate and your MAGI is under $100k (phasing out to $0 by $150k); unused losses carry forward. On sale, claimed depreciation is recaptured at up to 25%, and gains may owe capital-gains tax (a 1031 exchange can defer both). Figures are a year-1 estimate at your 24.0% rate — not tax advice; consult a CPA.
Schools (NCES district)
- District
- Pharr-San Juan-Alamo ISD
- NCES district ID
- 4834860
- Math proficiency
- 18% ▼ -34.00%
- Reading proficiency
- 30% ▼ -11.00%
- Median HH income
- $33,757
- Composite
- 19.63/100
- National rank
- #8744
- State rank
- #740 of 826 in TX
Livability — Pharr
- Score
- 72/100
- State rank
- #245
- US rank
- #5852
Category grades
Schools grade is shown separately in the Schools card above.
Census & demographics
- Census place
- Pharr, TX
- County
- Hidalgo County · 623,128 people
- City population
- 80,540
- Metro
- McAllen-Edinburg-Mission, TX
- Population (ZIP)
- 80,540
- Household income
- $52,770
- Rent vs Own
- Severe rent burden
- 2161.0
Population outlook (Hidalgo County) Hauer SSP2
- Today (2025)
- 955,232 people
- By 2030
- 1,009,774 · +5.7%
- By 2040
- 1,120,332 · +17.3%
- By 2050
- 1,225,036 · +28.2%
- By 2075
- 1,439,189 · +50.7%
- By 2100
- 1,533,429 · +60.5%
Race, ethnicity, and origin ACS 2023
- Neighborhood character
- Predominantly Hispanic (95%)
- Race & ethnicity
- Hispanic / Latino 95% Two or more races 45% White 5%
- Hispanic origin (detail)
- Mexican 92%
- Foreign-born
- 29% · Canada
- Languages at home
- 18% English-only · Spanish 81%
Political lean MEDSL · Hidalgo
- 2024 margin
- Toss-up / Even · D 48.1% · R 51.0%
- 2008→2024 swing
- -41.6pp toward R · 2008: 38.7pp · 2024: -2.9pp
- All cycles
- 2024: R+2.9 2020: D+17.1 2016: D+40.5 2012: D+41.8 2008: D+38.7
Not yet ingested
- Civics
- —
Market trends
- HPI YoY
- ▼ -23.00%
- Current HPI
- 261.1606
- Rent YoY
- ▼ -0.24%
- Metro
- McAllen-Edinburg-Mission, TX
- State GDP YoY
- ▲ 3.95%
- F500 in state
- 110
Industry mix (Fortune 500 HQ in TX)
| Industry | F500 HQs | Revenue |
|---|---|---|
| Energy | 16 | $1,198B |
|
||
| Technology | 5 | $198B |
|
||
| Engineering / Construction | 4 | $72B |
|
||
| Energy Services | 3 | $60B |
|
||
| Utilities | 3 | $41B |
|
||
| Healthcare | 2 | $330B |
|
||
Price history
-11.2% since first listed6 events — show timeline
- 2026-04-30 Pending — MCALLENMLS
- 2026-04-27 Contingent — MCALLENMLS
- 2026-03-09 Price Changed $87,000 MCALLENMLS
- 2026-02-12 Listed $97,999 MCALLENMLS
- 2026-01-02 Sold (Public Records) — Public Records
- 1999-07-14 Sold (Public Records) — Public Records
Property tax history
+5.1%/yrLatest (2025): $3,382 · +9.8% YoY. Source: county tax records.
Cash-flow waterfall
monthlySold comps — $/sqft
last 12 mo · ≤1 miLoading sold comps…