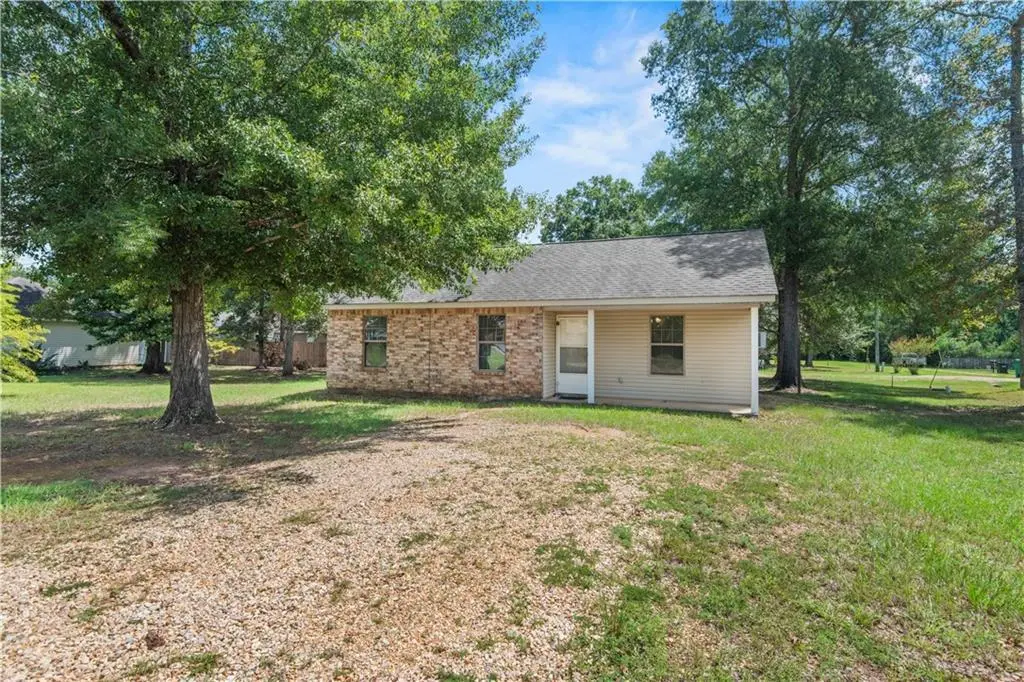
1017 Webb St · Franklinton, LA
Flood risk 1/10 · Minimal
- FEMA flood zone
- X (unshaded)
- Chance of flooding over 30 yrs
- 0.0%
- Est. flood insurance / yr
- $507 – $1,088
Fire risk 5/10 · Moderate
- Est. fire insurance / yr
- $1,269 – $2,357
Heat risk 8/10 · Major
- Hot days now (above 108°F)
- 7 days/yr
- Hot days in 30 yrs
- 21 days/yr
Wind risk 8/10 · Major
- Chance of severe wind over 30 yrs
- 99.0%
Air-quality risk 1/10 · Minimal
- Unhealthy air days now
- 0 days/yr
- Unhealthy air days in 30 yrs
- 0 days/yr
Risk factors via First Street. Map © Google.
Why this score? — see what drove the C- grade
The composite is a weighted blend of 9 inputs, each scored 0–100. Each bar is that input's sub-score; the figure is the points it added to the 100-point composite (weight × sub-score).
- Cash flow +22.0/30.0
- ARV discount +8.9/15.0
- DSCR +7.0/10.0
- 1% rule +4.7/10.0
- Livability +3.5/5.0
- Schools +2.8/10.0
- Rent growth +2.5/5.0
- Condition / age +2.5/5.0
- Appreciation +0.0/10.0
$145,000
🖨 Deal sheet (PDF) 📄 Offer letter ✓ Due diligence
Listing remarks MLS
This cozy cottage is resting on a quiet, tree shaded, corner lot inside the city limits of Franklinton. It features a flowing floorplan with 3 bedrooms, spacious living area, along with a quaint kitchen that comes complete with a range/oven, refrigerator, dishwasher, and built in microwave. To add to your enjoyment there is is 20X11 back porch and a bonus storage shed.
Key facts
- Storage shed
- Back porch
- Corner lot
Tags
Neighborhood map
What this means for you Summary
Snapshot
- This is a 3-bed/1.0-bath single-family listed at $145k.
Deal economics
- At list price, monthly cash flow is $230 ($3k/yr) — positive.
- The deal already cash-flows at list — no discount required.
- To meet the 1% rule (rent ≥ 1% of price), the offer needs to be $140k (3.4% below list).
- Recommended offer: $132k (9.0% below list) — sets the bar for market timing.
- Cap rate 8.2% vs local median 5.5% in Franklinton — top-decile yield for the area; either an underpriced asset or a hidden risk that comps aren't pricing in. Stress-test before assuming the spread holds.
Location & tenants
- Location reads 69/100 on livability (#67 in LA) — a middle-class / working-renter tenant base. Strengths: cost of living A+, health & safety A+, crime B; Watch: amenities F, commute F, employment F.
- Washington Parish (rural): math 27% / reading 41% proficiency, ranked #38 of 98 in LA (top 39%) — families likely to look elsewhere, expect single-tenant / working-renter base with shorter leases; 77% free/reduced lunch — lower-income household profile, screen leases tightly.
- Zoned schools: Franklinton Primary School (math 22% / reading 32%, grade F, #359 of 646 statewide, top 57%, 664 students, 56% FRL); Franklinton Junior High School (math 27% / reading 46%, grade F, #82 of 218 statewide, top 38%, 362 students, 59% FRL); Franklinton High School (math 27% / reading 42%, grade F, #106 of 265 statewide, top 43%, 732 students, 56% FRL) — zoned schools average 57% FRL vs 77% district-wide (20 pts lower); this property's tenant base skews higher-income than the district average.
- Market conditions: 245 active listings in the ZIP; 10 units permitted in Washington Parish in 2024 (0 in 5+ unit buildings).
Forward outlook
- Local home prices are declining (-3.0%/yr); year-one equity from $1k of loan paydown is wiped out by about $4k of value loss. Plan a longer hold.
- Washington County population projected at -16% by 2050 — secular population decline; favor cash flow + early exit over multi-decade hold.
Negotiation context
- It's been on market 101 days — a 9% lower offer ($132k) is reasonable based on typical stale-listing flexibility.
- 3 sale attempts with the ask held roughly flat each time — persistent listings suggest the price (not the market) is what's stuck; bring a comps-based counter.
Risks & watch-outs
- Climate carrying-cost: severe wind risk, 99% chance of damaging wind over 30y; moderate wildfire risk; extreme-heat days projected 7→21/yr by 2055 (HVAC capex compounding) — expect insurance premiums to compound above CPI over the hold.
Questions for the listing agent
- It's been on market 101 days. Have you received any prior offers? Is the seller open to a 9% concession, seller financing, or rate buy-down credit?
- Why hasn't it sold? Are there any deal-killer items the seller is aware of (foundation, flood, title, zoning, code violations)?
- Is there a deadline driving the sale (1031 exchange, divorce, estate, relocation)? That informs how much negotiation room exists.
- What's the average days-on-market for RENTAL listings here right now (not sales)? A rising rental-DOM trend means longer vacancies and softer asking-rent achievability than the comps imply.
- What's the recent tenant-quality profile in this submarket — average credit score on applications, eviction rate, late-payment / NSF rate, and stable-employment percentage? A property-management company in the area should have these aggregated.
- How much new for-sale + rental construction is in the pipeline within 1–3 miles? Heavy new supply typically softens prices + rents 12–24 months out; constrained supply supports both.
Investment metrics
- 1% rule
- 0.97% ✗
- Cap rate
- 8.20%
- Cash-on-cash
- 6.81%
- DSCR
- 1.30
- GRM
- 8.6
CMA / ARV
- ARV (median comp)
- $149,782
- List price
- $145,000
- Delta
- -3.19%
- Verdict
- FAIR
- Comps
- 9 within 1.0 mi
Show comp detail 3 sales within ~0.75 mi
| Address | Dist | Beds/Ba | Sqft | Sold | Price | $/sf | Match |
|---|---|---|---|---|---|---|---|
| 1009 Webb St | 0.04mi | 3/1.0 | 1,000 (+2%) | 7mo | $125,000 | $125 | 90 |
| 1013 Marshall St | 0.09mi | 2/1.0 (-1) | 1,040 (+6%) | 6mo | $162,000 | $156 | 76 |
| 1007 Crystal Dr | 0.04mi | 3/2.0 | 1,046 (+6%) | 13mo | $193,000 | $185 | 73 |
Match score weights: distance 35% · size 25% · config 20% · recency 20%. Top-matched comps best support the ARV.
Projected returns pro-forma
-3.0% appreciation · 3.0% rent growth · sell at horizon
- IRR
- -5.9%
- Equity multiple
- 0.78×
- Total profit
- $-8,888
- Equity at exit
- $21,620
- IRR
- 3.7%
- Equity multiple
- 1.27×
- Total profit
- $10,916
- Equity at exit
- $12,537
Cash invested: $40,600 (down + closing). Projections, not guarantees.
Landlord ↔ Tenant lean methodology
- Overall (STATE)
- 90 Strongly Landlord-Friendly
- State Louisiana
- 90 Strongly Landlord-Friendly · R+12
- County
- — inherits STATE
- City
- — inherits STATE
ZIP-level market 70438
- Home prices YoY
- -14.2%
- Active inventory
- 245
- Price-to-rent
- 8.6×
Monthly cashflow live
- Estimated rent
- $1,401 medium interval (Pro) →
- Mortgage (P&I)
- −$760
- Tax from tax record
- −$56 /mo · $668/yr
- Insurance
- −$60
- HOA
- −$0
- Vacancy / Maint / Mgmt
- −$294
- Net cashflow
- $230
Break-even live
Sensitivity live
| Price | -10% $312 | -5% $271 | +0% $230 | +5% $189 | +10% $148 |
|---|---|---|---|---|---|
| Rent | -10% $120 | -5% $175 | +0% $230 | +5% $286 | +10% $341 |
| Rate | -1.0pp $303 | -0.5pp $267 | base $230 | +0.5pp $193 | +1.0pp $154 |
UW: 25.0% down · 7.5% · 30yr · 1.5% tax · 5.0% vac · 8.0% maint · 8.0% mgmt
Financing live
Cash to close
- Down payment
- $36,250
- Closing costs
- $4,350
- Reserves months
- —
- Total cash needed
- —
Loan-product check · same deal, 3 products live
Conventional
25% down · 7.5% · 30yr
- Down + closing
- —
- Monthly P&I
- —
- Monthly cashflow
- —
- DSCR
- —
- Eligible?
- —
Personal DTI + credit; lowest rate.
DSCR
20% down · 8.5% · 30yr
- Down + closing
- —
- Monthly P&I
- —
- Monthly cashflow
- —
- DSCR
- —
- Eligible?
- —
No personal income docs; deal must DSCR.
Hard money
10% down · 12.0% · 12mo
- Down + closing
- —
- Monthly P&I
- —
- Monthly cashflow
- —
- DSCR
- —
- Eligible?
- —
Short-term bridge; refi at stabilization.
Listing history 14 events
-
2026-06-07statusdays on market $145,000 Pending 101 DOM
-
2026-06-03days on market $145,000 Active 98 DOM
-
2026-06-02days on market $145,000 Active 97 DOM
-
2026-06-01days on market $145,000 Active 96 DOM
-
2026-05-31days on market $145,000 Active 95 DOM
-
2026-02-24$145,000 Active 371-char remark
Show marketing remark (371 chars)
This cozy cottage is resting on a quiet, tree shaded, corner lot inside the city limits of Franklinton. It features a flowing floorplan with 3 bedrooms, spacious living area, along with a quaint kitchen that comes complete with a range/oven, refrigerator, dishwasher, and built in microwave. To add to your enjoyment there is is 20X11 back porch and a bonus storage shed.
-
2026-01-21price $145,000
-
2026-01-21price $145,000
-
2025-11-29price $159,900
-
2025-11-06price $159,900
-
2025-10-02price $162,000
-
2025-10-02price $162,000
-
2025-08-18$168,500 Active
ⓘ Source: listings_history table (triggers on properties + properties_extension) + one-shot
backfill from property_details.listing_events for pre-trigger history.
Tax reassessment forecast LA · Resets to sale price
- Current annual tax
- $668 · $56/mo
- Projected year-2 tax
- $798 · $66/mo
- Expected delta
- +$130/yr (+$11/mo · 19.4%)
ⓘ Screening estimate from a state-policy table — verify with the county assessor before closing.
Climate risk First Street
- Flood 1/10 Low FEMA zone X (unshaded) · 0% chance over 30 yrs
- Wildfire 5/10 Major
- Heat 8/10 Severe 7 d/yr ≥108°F today · 21 d/yr by 30 yrs out
- Wind 8/10 Severe 99% chance of damaging wind over 30 yrs
- Air quality 1/10 Low 0 unhealthy d/yr today · 0 by 30 yrs out
Nearby sold comps map
Loading sold comps map…
Walkable amenities ~0.75 mi
Loading nearby amenities…
Taxation est. · year 1
- Rental income
- $16,811
- − Mortgage interest
- −$8,122
- − Property taxes
- −$668
- − Insurance
- −$725
- − Repairs & maintenance
- −$1,345
- − Management
- −$1,345
- − Depreciation
- −$4,218
- Taxable income
- $388
- Est. tax owed @ 24.0%
- −$93
- After-tax cash flow
- $2,670/yr
For passive investors: Depreciation is non-cash, so a rental often shows a tax loss while cash-flowing — sheltering income. Rental losses are passive: they offset passive income freely, and up to $25,000/yr can offset ordinary (W-2) income if you actively participate and your MAGI is under $100k (phasing out to $0 by $150k); unused losses carry forward. On sale, claimed depreciation is recaptured at up to 25%, and gains may owe capital-gains tax (a 1031 exchange can defer both). Figures are a year-1 estimate at your 24.0% rate — not tax advice; consult a CPA.
Schools (NCES district)
- District
- Washington Parish
- NCES district ID
- 2201860
- Math proficiency
- 27% ▼ -34.00%
- Reading proficiency
- 41% ▼ -29.00%
- Median HH income
- $34,972
- Composite
- 28.03/100
- National rank
- #6844
- State rank
- #38 of 98 in LA
Livability — Franklinton
- Score
- 69/100
- State rank
- #67
- US rank
- #8352
Category grades
Schools grade is shown separately in the Schools card above.
Census & demographics
- Census place
- Franklinton, LA
- Population (ZIP)
- 19,935
Population outlook (Washington County) Hauer SSP2
- Today (2025)
- 44,642 people
- By 2030
- 43,302 · -3.0%
- By 2040
- 40,345 · -9.6%
- By 2050
- 37,434 · -16.1%
- By 2075
- 29,954 · -32.9%
- By 2100
- 21,579 · -51.7%
Race, ethnicity, and origin ACS 2023
- Neighborhood character
- Predominantly White (73%)
- Race & ethnicity
- White 73% Black 22% Two or more races 4% Hispanic / Latino 2%
- Common ancestry
- Lithuanian 9% Slovak 2% German 1%
- Foreign-born
- 0% · Canada
- Languages at home
- 98% English-only · French/Haitian/Cajun 1%
Political lean MEDSL · Washington
- 2024 margin
- Solid R (+40.3) · D 29.3% · R 69.6% · Other 1.1%
- 2008→2024 swing
- -7.6pp toward R · 2008: -32.7pp · 2024: -40.3pp
- All cycles
- 2024: R+40.3 2020: R+37.6 2016: R+36.8 2012: R+28.3 2008: R+32.7
Not yet ingested
- Civics
- —
Market trends
- HPI YoY
- ▼ -31.73%
- Current HPI
- 191.4762
- Rent YoY
- —
- Metro
- —
- State GDP YoY
- ▲ 3.29%
- F500 in state
- 10
Industry mix (Fortune 500 HQ in LA)
| Industry | F500 HQs | Revenue |
|---|---|---|
| Telecommunications | 2 | $23B |
|
||
| Utilities | 1 | $12B |
|
||
| Wholesale / Distribution | 1 | $5B |
|
||
| Advertising | 1 | $2B |
|
||
Price history
-13.9% since first listed9 events — show timeline
- 2026-02-24 Listed $145,000 GSREIN
- 2026-02-24 Listed $145,000 AcadianaMLS
- 2026-01-21 Price Changed $145,000 AcadianaMLS
- 2026-01-21 Price Changed $145,000 GSREIN
- 2025-11-29 Price Changed $159,900 AcadianaMLS
- 2025-11-06 Price Changed $159,900 GSREIN
- 2025-10-02 Price Changed $162,000 AcadianaMLS
- 2025-10-02 Price Changed $162,000 GSREIN
- 2025-08-18 Listed $168,500 AcadianaMLS
Property tax history
-1.7%/yrLatest (2025): $668 · +0.4% YoY. Source: county tax records.
Cash-flow waterfall
monthlySold comps — $/sqft
last 12 mo · ≤1 miLoading sold comps…