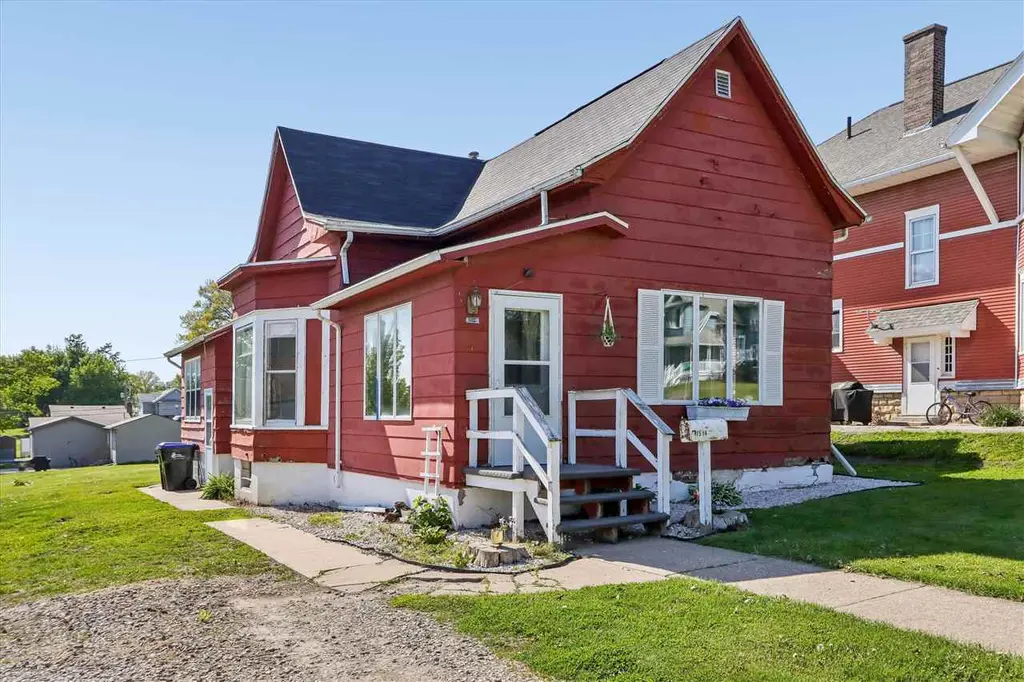
1514 7th Ave · Belle Plaine, IA
Flood risk 1/10 · Minimal
- FEMA flood zone
- X (unshaded)
- Chance of flooding over 30 yrs
- 0.0%
- Est. flood insurance / yr
- $473 – $860
Fire risk 4/10 · Minor
- Est. fire insurance / yr
- $902 – $1,676
Heat risk 3/10 · Minor
- Hot days now (above 103°F)
- 7 days/yr
- Hot days in 30 yrs
- 15 days/yr
Wind risk 2/10 · Minimal
- Chance of severe wind over 30 yrs
- —
Air-quality risk 1/10 · Minimal
- Unhealthy air days now
- 0 days/yr
- Unhealthy air days in 30 yrs
- 0 days/yr
Risk factors via First Street. Map © Google.
Why this score? — see what drove the C grade
The composite is a weighted blend of 9 inputs, each scored 0–100. Each bar is that input's sub-score; the figure is the points it added to the 100-point composite (weight × sub-score).
- Cash flow +17.0/30.0
- Appreciation +10.0/10.0
- Schools +5.9/10.0
- ARV discount +5.5/15.0
- DSCR +5.3/10.0
- 1% rule +4.1/10.0
- Livability +3.8/5.0
- Rent growth +2.5/5.0
- Condition / age +2.5/5.0
$93,000
🖨 Deal sheet (PDF) 📄 Offer letter ✓ Due diligence
Listing remarks
Conveniently located directly across from a park, this ranch-style home offers a comfortable and functional layout with tasteful updates throughout. You’ll appreciate the tall ceilings, attractive LVP flooring, natural light and crisp white thick trim that create a bright and welcoming feel. Upon entering, you will appreciate the convenient drop zone area to keep everyday items organized and easily accessible. The spacious living room feature a large window that allow for abundant natural light. The kitchen includes appliances, ample white cabinetry, and a window above the sink overlooking the oversized, flat backyard. Generous dining area offers plenty of space for everyday living an
Key facts
- Across from a park
- 0.26 acre lot
- Built 1860
Tags
Property features AI
Finance
- HOA & community: Association fee paid annually
Exterior
- Parking: Off-street parking
- Security: Smoke detector(s)
- Utilities: Public water; Public sewer
- Home design: Single-family residence; Residential property
- Construction: Wood siding; Block foundation; Built with block basement (full, unfinished)
- Exterior features: Level lot; Shed(s); Street lights; Sidewalks; Park nearby
Interior
- Kitchen: Microwave; Refrigerator
- Bedrooms: Master downstairs
- Flooring: Carpet
- Bathrooms: 1 full bathroom
- Heating & cooling: Natural gas heating with forced air; Wall/window cooling unit(s)
- Interior features: High ceilings; Entrance foyer; Master bedroom on main level; Other interior features
- Laundry & utility: Main level laundry room; Washer; Dryer
Neighborhood map
What this means for you Summary
Snapshot
- This is a 2-bed/1.0-bath single-family listed at $93k.
Deal economics
- At list price, monthly cash flow is $63 ($757/yr) — positive.
- The deal already cash-flows at list — no discount required.
- To meet the 1% rule (rent ≥ 1% of price), the offer needs to be $85k (8.6% below list).
- Recommended offer: $85k (8.6% below list) — sets the bar for 1% rule.
- Cap rate 7.1% vs local median 3.7% in Belle Plaine — top-decile yield for the area; either an underpriced asset or a hidden risk that comps aren't pricing in. Stress-test before assuming the spread holds.
Location & tenants
- Location reads 75/100 on livability (#215 in IA, #3,962 nationally) — a middle-class / working-renter tenant base. Strengths: cost of living A+, housing A+, health & safety A+; Watch: crime C-, amenities F, commute F.
- Belle Plaine Community School District (rural): math 68% / reading 74% proficiency, ranked #144 of 289 in IA (top 50%) — strong family-tenant draw, lease renewals of 3-5y typical.
- Zoned schools: Longfellow Elementary School (math 72% / reading 72%, grade A-, #181 of 616 statewide, top 34%, 286 students, 44% FRL); Belle Plaine Jr/Sr High School (math 62% / reading 77%, grade B, #152 of 336 statewide, top 52%, 193 students, 35% FRL).
- Market conditions: 33 active listings in the ZIP; 2 comparable units currently listed for rent nearby; 34 units permitted in Benton County in 2024 (0 in 5+ unit buildings).
Forward outlook
- In year one you build about $10k of equity ($643 loan paydown + $9k appreciation (10.0% local appreciation)).
- Benton County population projected at -13% by 2050 — secular population decline; favor cash flow + early exit over multi-decade hold.
- At projected returns (10.0% appreciation + 3.0% rent growth), your $26k cash investment doubles in ~3 years — after that, you're playing with house money.
- By year 4, paydown + projected appreciation supports a ~$35k cash-out refi (75% LTV) — recoverable capital for the next deal without selling this one.
Negotiation context
- It's been on market 41 days — a 3% lower offer ($90k) is reasonable based on typical stale-listing flexibility.
- 2 sale attempts since 11y ago with the ask held roughly flat each time — persistent listings suggest the price (not the market) is what's stuck; bring a comps-based counter.
- Current owner paid $17k; list at $93k implies a 447% gain — meaningful room to come down on a strong offer.
Risks & watch-outs
- Watch-outs: built in 1860 — expect roof / HVAC / electrical / plumbing capex.
Questions for the listing agent
- It's been on market 41 days. Have you received any prior offers? Is the seller open to a 9% concession, seller financing, or rate buy-down credit?
- Built in 1860 — when were the roof, HVAC, electrical panel, plumbing, and water heater last replaced?
- Is there a deadline driving the sale (1031 exchange, divorce, estate, relocation)? That informs how much negotiation room exists.
- Schools are B-rated — typically a magnet for longer-tenancy family renters. What's the average tenant stay here, and is there a school-zone premium baked into asking?
- What's the average days-on-market for RENTAL listings here right now (not sales)? A rising rental-DOM trend means longer vacancies and softer asking-rent achievability than the comps imply.
- What's the recent tenant-quality profile in this submarket — average credit score on applications, eviction rate, late-payment / NSF rate, and stable-employment percentage? A property-management company in the area should have these aggregated.
- How much new for-sale + rental construction is in the pipeline within 1–3 miles? Heavy new supply typically softens prices + rents 12–24 months out; constrained supply supports both.
Investment metrics
- 1% rule
- 0.91% ✗
- Cap rate
- 7.11%
- Cash-on-cash
- 2.91%
- DSCR
- 1.13
- GRM
- 9.1
CMA / ARV
- ARV (median comp)
- $89,025
- List price
- $93,000
- Delta
- 4.46%
- Verdict
- FAIR
- Comps
- 20 within 1.0 mi
Show comp detail 12 sales within ~0.75 mi
| Address | Dist | Beds/Ba | Sqft | Sold | Price | $/sf | Match |
|---|---|---|---|---|---|---|---|
| 1613 7th Ave | 0.10mi | 2/1.0 | 1,000 (-8%) | 14mo | $115,000 | $115 | 70 |
| 1502 6th Ave | 0.09mi | 3/1.5 (+1) | 1,020 (-6%) | 12mo | $123,500 | $121 | 68 |
| 409 11th St | 0.39mi | 3/1.0 (+1) | 1,065 (-2%) | 12mo | $102,000 | $96 | 63 |
| 904 10th St | 0.46mi | 3/1.5 (+1) | 1,093 (+0%) | 10mo | $130,000 | $119 | 63 |
| 1512 7th Ave | 0.01mi | 3/2.0 (+1) | 1,201 (+10%) | 14mo | $87,000 | $72 | 62 |
| 1406 4th Ave | 0.25mi | 3/1.0 (+1) | 1,019 (-7%) | 13mo | $119,900 | $118 | 62 |
| 1305 11th Ave | 0.43mi | 2/1.0 | 984 (-10%) | 5mo | $60,000 | $61 | 60 |
| 605 9th St | 0.50mi | 2/1.0 | 1,152 (+6%) | 10mo | $151,000 | $131 | 59 |
| 1606 13th Ave | 0.52mi | 2/2.0 | 1,044 (-4%) | 10mo | $147,777 | $142 | 56 |
| 705 10th St | 0.43mi | 3/1.5 (+1) | 1,176 (+8%) | 6mo | $110,000 | $94 | 55 |
| 608 6th Ave | 0.72mi | 2/1.0 | 1,108 (+2%) | 15mo | $136,000 | $123 | 51 |
| 1609 11th Ave | 0.39mi | 2/2.0 | 1,214 (+11%) | 10mo | $105,000 | $86 | 51 |
Match score weights: distance 35% · size 25% · config 20% · recency 20%. Top-matched comps best support the ARV.
Projected returns pro-forma
10.0% appreciation · 3.0% rent growth · sell at horizon
- IRR
- 26.4%
- Equity multiple
- 3.10×
- Total profit
- $54,658
- Equity at exit
- $83,782
- IRR
- 23.1%
- Equity multiple
- 7.06×
- Total profit
- $157,783
- Equity at exit
- $180,679
Cash invested: $26,040 (down + closing). Projections, not guarantees.
Landlord ↔ Tenant lean methodology
- Overall (STATE)
- 83 Strongly Landlord-Friendly
- State Iowa
- 83 Strongly Landlord-Friendly · R+6
- County
- — inherits STATE
- City
- — inherits STATE
ZIP-level market 52208
- Home prices YoY
- 5.4%
- Active inventory
- 33
- Price-to-rent
- 9.1×
Monthly cashflow live
- Estimated rent
- $850 medium interval (Pro) →
- Mortgage (P&I)
- −$488
- Tax from tax record
- −$82 /mo · $984/yr
- Insurance
- −$39
- HOA
- −$0
- Vacancy / Maint / Mgmt
- −$178
- Net cashflow
- $63
Break-even live
Sensitivity live
| Price | -10% $116 | -5% $89 | +0% $63 | +5% $37 | +10% $10 |
|---|---|---|---|---|---|
| Rent | -10% $-4 | -5% $29 | +0% $63 | +5% $97 | +10% $130 |
| Rate | -1.0pp $110 | -0.5pp $87 | base $63 | +0.5pp $39 | +1.0pp $14 |
UW: 25.0% down · 7.5% · 30yr · 1.5% tax · 5.0% vac · 8.0% maint · 8.0% mgmt
Financing live
Cash to close
- Down payment
- $23,250
- Closing costs
- $2,790
- Reserves months
- —
- Total cash needed
- —
Loan-product check · same deal, 3 products live
Conventional
25% down · 7.5% · 30yr
- Down + closing
- —
- Monthly P&I
- —
- Monthly cashflow
- —
- DSCR
- —
- Eligible?
- —
Personal DTI + credit; lowest rate.
DSCR
20% down · 8.5% · 30yr
- Down + closing
- —
- Monthly P&I
- —
- Monthly cashflow
- —
- DSCR
- —
- Eligible?
- —
No personal income docs; deal must DSCR.
Hard money
10% down · 12.0% · 12mo
- Down + closing
- —
- Monthly P&I
- —
- Monthly cashflow
- —
- DSCR
- —
- Eligible?
- —
Short-term bridge; refi at stabilization.
Rent comps 2 comps
| Address | Beds | Baths | Sqft | Rent | $/sqft | DOM | Units | Dist |
|---|---|---|---|---|---|---|---|---|
| 1409 12th Ave Apt 2 Belle Plaine, IA | 2.0 | 1.0 | 700 | $850 | $1.21 | 22d | 1 | 0.48mi |
| 1307 12th Ave Unit 1409-M03 Belle Plaine, IA | 2.0 | 1.0 | 800 | $850 | $1.06 | 15d | 1 | 0.50mi |
Listing history 23 events
-
2026-06-21days on market $93,000 Active 41 DOM
-
2026-06-21days on market $93,000 Active 40 DOM
-
2026-06-18days on market $93,000 Active 38 DOM
-
2026-06-17days on market $93,000 Active 37 DOM
-
2026-06-16days on market $93,000 Active 36 DOM
-
2026-06-15days on market $93,000 Active 35 DOM
-
2026-06-13days on market $93,000 Active 33 DOM
-
2026-06-12days on market $93,000 Active 32 DOM
-
2026-06-09days on market $93,000 Active 29 DOM
-
2026-06-08days on market $93,000 Active 28 DOM
-
2026-06-07days on market $93,000 Active 27 DOM
-
2026-06-07days on market $93,000 Active 26 DOM
-
2026-06-04days on market $93,000 Active 23 DOM
-
2026-06-02days on market $93,000 Active 22 DOM
-
2026-06-01days on market $93,000 Active 21 DOM
-
2026-05-31days on market $93,000 Active 20 DOM
-
2026-05-31days on market $93,000 Active 19 DOM
-
2026-05-11$93,000 Active 895-char remark
-
2016-03-20soldstatus $17,000
-
2015-12-21$24,900
-
1986-07-10soldstatus $18,000
-
1985-09-12soldstatus $27,500
-
1981-09-15soldstatus $19,750
ⓘ Source: listings_history table (triggers on properties + properties_extension) + one-shot
backfill from property_details.listing_events for pre-trigger history.
Tax reassessment forecast IA · Partial reset (capped growth)
- Current annual tax
- $984 · $82/mo
- Projected year-2 tax
- $1,222 · $102/mo
- Expected delta
- +$238/yr (+$20/mo · 24.2%)
ⓘ Screening estimate from a state-policy table — verify with the county assessor before closing.
Climate risk First Street
- Flood 1/10 Low FEMA zone X (unshaded) · 0% chance over 30 yrs
- Wildfire 4/10 Moderate
- Heat 3/10 Moderate 7 d/yr ≥103°F today · 15 d/yr by 30 yrs out
- Wind 2/10 Low
- Air quality 1/10 Low 0 unhealthy d/yr today · 0 by 30 yrs out
Nearby sold comps map
Loading sold comps map…
Walkable amenities ~0.75 mi
Loading nearby amenities…
Taxation est. · year 1
- Rental income
- $10,200
- − Mortgage interest
- −$5,209
- − Property taxes
- −$984
- − Insurance
- −$465
- − Repairs & maintenance
- −$816
- − Management
- −$816
- − Depreciation
- −$2,705
- Taxable loss
- −$796
- Est. tax savings @ 24.0%
- +$191
- After-tax cash flow
- $948/yr
For passive investors: Depreciation is non-cash, so a rental often shows a tax loss while cash-flowing — sheltering income. Rental losses are passive: they offset passive income freely, and up to $25,000/yr can offset ordinary (W-2) income if you actively participate and your MAGI is under $100k (phasing out to $0 by $150k); unused losses carry forward. On sale, claimed depreciation is recaptured at up to 25%, and gains may owe capital-gains tax (a 1031 exchange can defer both). Figures are a year-1 estimate at your 24.0% rate — not tax advice; consult a CPA.
Schools (NCES district)
- District
- Belle Plaine Community School District
- NCES district ID
- 1904620
- Math proficiency
- 68% ▼ -5.00%
- Reading proficiency
- 74% ▬ 0.00%
- Median HH income
- $42,054
- Composite
- 59.42/100
- National rank
- #927
- State rank
- #144 of 289 in IA
Livability — Belle Plaine
- Score
- 75/100
- State rank
- #215
- US rank
- #3962
Category grades
Schools grade is shown separately in the Schools card above.
Census & demographics
- Census place
- Belle Plaine, IA
- Population (ZIP)
- 2,921
Population outlook (Benton County) Hauer SSP2
- Today (2025)
- 25,078 people
- By 2030
- 24,606 · -1.9%
- By 2040
- 23,425 · -6.6%
- By 2050
- 21,891 · -12.7%
- By 2075
- 19,482 · -22.3%
- By 2100
- 17,139 · -31.7%
Race, ethnicity, and origin ACS 2023
- Neighborhood character
- Predominantly White (94%)
- Race & ethnicity
- White 94% Hispanic / Latino 3% Two or more races 3%
- Common ancestry
- Slovak 3% Portuguese 3% Lithuanian 3%
- Foreign-born
- 1% · Canada
- Languages at home
- 98% English-only · Spanish 1%
Political lean MEDSL · Benton
- 2024 margin
- Solid R (+33.2) · D 32.8% · R 66.0% · Other 1.3%
- 2008→2024 swing
- -37.7pp toward R · 2008: 4.5pp · 2024: -33.2pp
- All cycles
- 2024: R+33.2 2020: R+27.5 2016: R+26.0 2012: R+0.6 2008: D+4.5
Not yet ingested
- Civics
- —
Market trends
- HPI YoY
- ▲ 12.07%
- Current HPI
- 237.1468
- Rent YoY
- —
- Metro
- —
- State GDP YoY
- ▲ 2.48%
- F500 in state
- 4
Industry mix (Fortune 500 HQ in IA)
| Industry | F500 HQs | Revenue |
|---|---|---|
| Financial Services | 1 | $16B |
|
||
| Retail / Convenience | 1 | $15B |
|
||
Price history
+370.9% since first listed6 events — show timeline
- 2026-05-11 Listed $93,000 ICAARMLS
- 2016-03-20 Sold (MLS) $17,000 CRAAR, CDRMLS
- 2015-12-21 Listed $24,900 CRAAR, CDRMLS
- 1986-07-10 Sold (Public Records) $18,000 Public Records
- 1985-09-12 Sold (Public Records) $27,500 Public Records
- 1981-09-15 Sold (Public Records) $19,750 Public Records
Property tax history
+5.7%/yrLatest (2025): $984 · +6.7% YoY. Source: county tax records.
Cash-flow waterfall
monthlySold comps — $/sqft
last 12 mo · ≤1 miLoading sold comps…