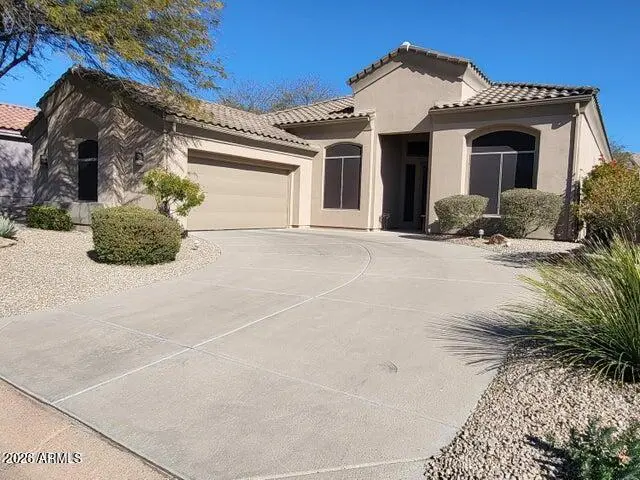
34687 N 93rd Pl · Scottsdale, AZ
Flood risk 1/10 · Minimal
- FEMA flood zone
- X (unshaded)
- Chance of flooding over 30 yrs
- 0.0%
- Est. flood insurance / yr
- $507 – $1,088
Fire risk 6/10 · Moderate
- Est. fire insurance / yr
- $610 – $1,132
Heat risk 7/10 · Major
- Hot days now (above 107°F)
- 5 days/yr
- Hot days in 30 yrs
- 12 days/yr
Wind risk 1/10 · Minimal
- Chance of severe wind over 30 yrs
- —
Air-quality risk 3/10 · Minor
- Unhealthy air days now
- 3 days/yr
- Unhealthy air days in 30 yrs
- 4 days/yr
Risk factors via First Street. Map © Google.
Why this score? — see what drove the D- grade
The composite is a weighted blend of 9 inputs, each scored 0–100. Each bar is that input's sub-score; the figure is the points it added to the 100-point composite (weight × sub-score).
- Cash flow +10.9/30.0
- ARV discount +9.3/15.0
- Schools +5.4/10.0
- Livability +4.0/5.0
- DSCR +3.2/10.0
- Rent growth +2.5/5.0
- Condition / age +2.5/5.0
- 1% rule +2.0/10.0
- Appreciation +0.0/10.0
$900,000
🖨 Deal sheet 📄 Offer letter ✓ Due diligence
Listing remarks MLS
Great room floor plan by Edmunds in The Legacy at Legend Trail. Perfect size at 2053 SF this 3 bedroom 2 bath layout has nicely appointed features, stacked stone accents, wonderful natural light from the multitude of windows. Tranquil backyard allows for optimal relaxation to enjoy the pebbletec pool w/ boulder waterfall, covered patio & 2 separate sun patios Great curb appeal w/painted stucco exterior, tile roof, side entry 2 car garage w/EV charger, fully owned solar panels to keep utilities very low. Enjoy all the amenities that Legend Trail has to offer from the golf course, community center, workout facilities, pickle ball, walking trails & so much more. Furnishings included for a true lock & leave or income rental property.
Key facts
- 7,149 sq ft lot
- 2 garage spots
- Pool
Neighborhood map
What this means for you Summary
Snapshot
- This is a 3-bed/3.0-bath single-family listed at $900k.
Deal economics
- At list price, monthly cash flow is $-391 ($-5k/yr) — negative.
- To cash-flow at today's rent, offer at most $831k (7.7% below list).
- To meet the 1% rule (rent ≥ 1% of price), the offer needs to be $630k (30.0% below list).
- Recommended offer: $630k (30.0% below list) — sets the bar for 1% rule.
- Cap rate 5.8% vs local median 2.5% in Scottsdale — top-decile yield for the area; either an underpriced asset or a hidden risk that comps aren't pricing in. Stress-test before assuming the spread holds.
Location & tenants
- Location reads 80/100 on livability (#4 in AZ, #1,756 nationally) — a professional / high-income tenant draw. Strengths: amenities A+, commute A+, employment A+; Watch: health & safety C-, cost of living F.
- Cave Creek Unified District (4244) (urban): math 57% / reading 59% proficiency, ranked #13 of 249 in AZ (top 5%) — acceptable for families but not a draw, mixed tenant base, ~2y average lease; only 8% free/reduced lunch — higher-income household profile.
- Market conditions: 588 active listings in the ZIP; 13 comparable units currently listed for rent nearby; rentals lingering (median 44d on market — plan ~5-8 weeks vacancy on turnover, expect pricing pressure); 85% of comp listings sitting > 30 days — soft ceiling on asking rent; high-income renter base; 36,011 units permitted in Maricopa County in 2024 (12,801 in 5+ unit buildings).
- This rent runs 43% of the median local income ($178k/yr) — at the standard rent-burdened threshold; future hikes will face affordability resistance.
Forward outlook
- Local home prices are declining (-3.0%/yr); year-one equity from $6k of loan paydown is wiped out by about $27k of value loss. Plan a longer hold.
- Maricopa County population projected at +38% by 2050 — long-run rental-demand tailwind backs the buy-and-hold thesis.
Negotiation context
- It's been on market 62 days — a 6% lower offer ($846k) is reasonable based on typical stale-listing flexibility.
- 10 sale attempts since 26y ago with the ask held roughly flat each time — persistent listings suggest the price (not the market) is what's stuck; bring a comps-based counter.
- Current owner paid $505k; list at $900k implies a 78% gain — meaningful room to come down on a strong offer.
Risks & watch-outs
- Climate carrying-cost: major wildfire risk; extreme-heat days projected 5→12/yr by 2055 (HVAC capex compounding) — expect insurance premiums to compound above CPI over the hold.
Questions for the listing agent
- What do current leases actually rent for vs. the listed asking? Can we see a recent rent roll and the last 12 months of T-12 income?
- It's been on market 62 days. Have you received any prior offers? Is the seller open to a 30% concession, seller financing, or rate buy-down credit?
- What does the HOA fee cover, when was the last increase, and are there any pending special assessments or reserve-fund shortfalls?
- Why hasn't it sold? Are there any deal-killer items the seller is aware of (foundation, flood, title, zoning, code violations)?
- Is there a deadline driving the sale (1031 exchange, divorce, estate, relocation)? That informs how much negotiation room exists.
- Schools are A-rated — typically a magnet for longer-tenancy family renters. What's the average tenant stay here, and is there a school-zone premium baked into asking?
- The area grade is low — what's the realistic commute time and amenity access for the typical tenant pool here? Any planned neighborhood developments (good or bad) we should know about?
- What's the average days-on-market for RENTAL listings here right now (not sales)? A rising rental-DOM trend means longer vacancies and softer asking-rent achievability than the comps imply.
- What's the recent tenant-quality profile in this submarket — average credit score on applications, eviction rate, late-payment / NSF rate, and stable-employment percentage? A property-management company in the area should have these aggregated.
- How much new for-sale + rental construction is in the pipeline within 1–3 miles? Heavy new supply typically softens prices + rents 12–24 months out; constrained supply supports both.
Investment metrics
- 1% rule
- 0.70% ✗
- Cap rate
- 5.77%
- Cash-on-cash
- -1.86%
- DSCR
- 0.92
- GRM
- 11.9
CMA / ARV
- ARV (median comp)
- $937,500
- List price
- $900,000
- Delta
- -4.00%
- Verdict
- FAIR
- Comps
- 20 within 1.0 mi
Show comp detail 12 sales within ~0.75 mi
| Address | Dist | Beds/Ba | Sqft | Sold | Price | $/sf | Match |
|---|---|---|---|---|---|---|---|
| 9414 E Sandy Vista Dr | 0.30mi | 3/3.0 | 2,025 (-1%) | 3mo | $915,000 | $452 | 82 |
| 35106 N 92nd Pl | 0.29mi | 3/2.0 | 2,044 (-0%) | 5mo | $950,000 | $465 | 78 |
| 9562 E Cavalry Dr | 0.36mi | 3/2.5 | 2,099 (+2%) | 0mo | $860,000 | $410 | 78 |
| 9422 E Sandy Vista Dr | 0.30mi | 3/2.5 | 2,099 (+2%) | 9mo | $895,000 | $426 | 73 |
| 9463 E Cavalry Dr | 0.19mi | 3/2.0 | 2,256 (+10%) | 1mo | $925,000 | $410 | 70 |
| 34748 N 93rd Pl #69 | 0.04mi | 2/2.0 (-1) | 2,256 (+10%) | 9mo | $950,000 | $421 | 65 |
| 9532 E Whitewing Dr | 0.55mi | 3/2.5 | 2,127 (+4%) | 5mo | $868,888 | $409 | 62 |
| 9508 E Chuckwagon Ln | 0.23mi | 3/2.0 | 1,832 (-11%) | 10mo | $725,000 | $396 | 59 |
| 9255 E Whitewing Dr | 0.32mi | 3/2.0 | 1,767 (-14%) | 0mo | $760,000 | $430 | 58 |
| 9604 E Chuckwagon Ln | 0.35mi | 3/2.0 | 1,832 (-11%) | 9mo | $791,000 | $432 | 54 |
| 9640 E Chuckwagon Ln | 0.40mi | 3/2.0 | 1,832 (-11%) | 8mo | $750,000 | $409 | 52 |
| 9706 E Chuckwagon Ln | 0.50mi | 3/2.0 | 1,832 (-11%) | 4mo | $750,000 | $409 | 51 |
Match score weights: distance 35% · size 25% · config 20% · recency 20%. Top-matched comps best support the ARV.
Projected returns pro-forma
-3.0% appreciation · 3.0% rent growth · sell at horizon
- IRR
- -19.4%
- Equity multiple
- 0.32×
- Total profit
- $-171,171
- Equity at exit
- $134,193
- IRR
- -12.3%
- Equity multiple
- 0.27×
- Total profit
- $-182,863
- Equity at exit
- $77,816
Cash invested: $252,000 (down + closing). Projections, not guarantees.
Landlord ↔ Tenant lean methodology
- Overall (STATE)
- 87 Strongly Landlord-Friendly
- State Arizona
- 87 Strongly Landlord-Friendly · R+3
- County
- — inherits STATE
- City
- — inherits STATE
ZIP-level market 85262
- Home prices YoY
- -12.2%
- Active inventory
- 588
- Price-to-rent
- 11.9×
Monthly cashflow live
- Estimated rent
- $6,299 high interval (Pro) →
- Mortgage (P&I)
- −$4,720
- Tax from tax record
- −$173 /mo · $2,074/yr
- Insurance
- −$375
- HOA
- −$100
- Vacancy / Maint / Mgmt
- −$1,323
- Net cashflow
- $-391
Break-even live
UW: 25.0% down · 7.5% · 30yr · 1.5% tax · 5.0% vac · 8.0% maint · 8.0% mgmt
Financing live
Cash to close
- Down payment
- $225,000
- Closing costs
- $27,000
- Reserves months
- —
- Total cash needed
- —
Loan-product check · same deal, 3 products live
Conventional
25% down · 7.5% · 30yr
- Down + closing
- —
- Monthly P&I
- —
- Monthly cashflow
- —
- DSCR
- —
- Eligible?
- —
Personal DTI + credit; lowest rate.
DSCR
20% down · 8.5% · 30yr
- Down + closing
- —
- Monthly P&I
- —
- Monthly cashflow
- —
- DSCR
- —
- Eligible?
- —
No personal income docs; deal must DSCR.
Hard money
10% down · 12.0% · 12mo
- Down + closing
- —
- Monthly P&I
- —
- Monthly cashflow
- —
- DSCR
- —
- Eligible?
- —
Short-term bridge; refi at stabilization.
Rent comps 13 comps
| Address | Beds | Baths | Sqft | Rent | $/sqft | DOM | Units | Dist |
|---|---|---|---|---|---|---|---|---|
| 34748 N 93rd Pl Scottsdale, AZ | 2.0 | 2.0 | 2256 | $8,500 | $3.77 | 44d | 1 | 0.06mi |
| 9255 E Broken Arrow Dr Scottsdale, AZ | 3.0 | 3.0 | 2127 | $6,850 | $3.22 | 44d | 1 | 0.18mi |
| 34938 N 92nd Pl Scottsdale, AZ | 3.0 | 2.0 | 1673 | $4,600 | $2.75 | 44d | 1 | 0.20mi |
| 9535 E Raindance Trl Scottsdale, AZ | 3.0 | 2.0 | 1832 | $7,500 | $4.09 | 44d | 1 | 0.25mi |
| 9338 E Prairie Cir Scottsdale, AZ | 3.0 | 2.5 | 2515 | $7,000 | $2.78 | 44d | 1 | 0.27mi |
| 9554 E Raindance Trl Scottsdale, AZ | 2.0 | 2.0 | 1832 | $6,500 | $3.55 | 24d | 1 | 0.29mi |
| 9583 E Raindance Trl Scottsdale, AZ | 2.0 | 2.0 | 1832 | $3,650 | $1.99 | 44d | 1 | 0.30mi |
| 9562 E Chuckwagon Ln Scottsdale, AZ | 2.0 | 2.0 | 1832 | $3,500 | $1.91 | 44d | 1 | 0.33mi |
| 9303 E Whitewing Dr Scottsdale, AZ | 3.0 | 2.0 | 2167 | $2,800 | $1.29 | 13d | 1 | 0.36mi |
| 34457 N Legend Trail Pkwy #1010 Scottsdale, AZ | 3.0 | 2.0 | 1463 | $4,400 | $3.01 | 44d | 1 | 0.36mi |
| 9616 E Chuckwagon Ln Scottsdale, AZ | 3.0 | 2.0 | 1832 | $7,000 | $3.82 | 44d | 1 | 0.39mi |
| 9632 E Superstition Ln Scottsdale, AZ | 2.0 | 2.0 | 1560 | $5,000 | $3.21 | 44d | 1 | 0.40mi |
| 9670 E Chuckwagon Ln Scottsdale, AZ | 2.0 | 2.0 | 1560 | $6,000 | $3.85 | 44d | 1 | 0.48mi |
HOA detail
- Monthly dues
- $100 · $1,200/yr
- Likely covers
- waterpool
Listing history 48 events
-
2026-06-18days on market $900,000 Active 62 DOM
-
2026-06-17days on market $900,000 Active 61 DOM
-
2026-06-16days on market $900,000 Active 60 DOM
-
2026-06-15days on market $900,000 Active 59 DOM
-
2026-06-13days on market $900,000 Active 57 DOM
-
2026-06-13days on market $900,000 Active 56 DOM
-
2026-06-09days on market $900,000 Active 53 DOM
-
2026-06-08days on market $900,000 Active 52 DOM
-
2026-06-07days on market $900,000 Active 51 DOM
-
2026-06-04days on market $900,000 Active 48 DOM
-
2026-06-03days on market $900,000 Active 47 DOM
-
2026-06-02days on market $900,000 Active 46 DOM
-
2026-06-01days on market $900,000 Active 45 DOM
-
2026-05-31days on market $900,000 Active 44 DOM
-
2026-04-29historical $6,150
-
2026-04-17$900,000 Active 751-char remark
Show marketing remark (751 chars)
Great room floor plan by Edmunds in The Legacy at Legend Trail. Perfect size at 2053 SF this 3 bedroom 2 bath layout has nicely appointed features, stacked stone accents, wonderful natural light from the multitude of windows. Tranquil backyard allows for optimal relaxation to enjoy the pebbletec pool w/ boulder waterfall, covered patio & 2 separate sun patios Great curb appeal w/painted stucco exterior, tile roof, side entry 2 car garage w/EV charger, fully owned solar panels to keep utilities very low. Enjoy all the amenities that Legend Trail has to offer from the golf course, community center, workout facilities, pickle ball, walking trails & so much more. Furnishings included for a true lock & leave or income rental property.
-
2025-11-19$6,150
-
2025-11-04historical
-
2025-10-02historical $5,475
-
2025-06-30price $898,900
-
2025-06-13price $5,475
-
2025-05-18$6,500
-
2025-05-17price $939,900
-
2025-04-29status Active
-
2025-04-25historical
-
2025-01-08historical $4,150
-
2024-08-20price $4,150
-
2024-01-23price $6,500
-
2023-11-01price $4,900
-
2023-08-09price $6,000
-
2019-07-26soldstatus $505,000 Closed
-
2019-07-26soldstatus $505,000
-
2019-07-15status Pending
-
2019-07-09historical Contract Contingent on Buyer Sale
-
2019-07-02price $514,900
-
2019-06-01$524,900 Active
-
2003-06-17soldstatus $279,000
-
2003-06-17soldstatus $279,000
-
2003-01-27$289,900
-
2003-01-15historical
-
2002-09-15$299,900
-
2002-09-03historical
-
2002-05-14$330,000
-
2002-05-07historical
-
2002-01-28$299,850
-
2001-03-08historical
-
2000-12-06$289,950
-
1996-04-30soldstatus $3,847,000
ⓘ Source: listings_history table (triggers on properties + properties_extension) + one-shot
backfill from property_details.listing_events for pre-trigger history.
Tax reassessment forecast AZ · Resets to sale price
- Current annual tax
- $2,074 · $173/mo
- Projected year-2 tax
- $5,940 · $495/mo
- Expected delta
- +$3,866/yr (+$322/mo · 186.4%)
ⓘ Screening estimate from a state-policy table — verify with the county assessor before closing.
Climate risk First Street
- Flood 1/10 Low FEMA zone X (unshaded) · 0% chance over 30 yrs
- Wildfire 6/10 Major
- Heat 7/10 Severe 5 d/yr ≥107°F today · 12 d/yr by 30 yrs out
- Wind 1/10 Low
- Air quality 3/10 Moderate 3 unhealthy d/yr today · 4 by 30 yrs out
Nearby sold comps map
Loading sold comps map…
Walkable amenities ~0.75 mi
Loading nearby amenities…
Taxation est. · year 1
- Rental income
- $75,592
- − Mortgage interest
- −$50,414
- − Property taxes
- −$2,074
- − Insurance
- −$4,500
- − Repairs & maintenance
- −$6,047
- − Management
- −$6,047
- − HOA
- −$1,200
- − Depreciation
- −$26,182
- Taxable loss
- −$20,872
- Est. tax savings @ 24.0%
- +$5,009
- After-tax cash flow
- $317/yr
For passive investors: Depreciation is non-cash, so a rental often shows a tax loss while cash-flowing — sheltering income. Rental losses are passive: they offset passive income freely, and up to $25,000/yr can offset ordinary (W-2) income if you actively participate and your MAGI is under $100k (phasing out to $0 by $150k); unused losses carry forward. On sale, claimed depreciation is recaptured at up to 25%, and gains may owe capital-gains tax (a 1031 exchange can defer both). Figures are a year-1 estimate at your 24.0% rate — not tax advice; consult a CPA.
Schools (NCES district)
- District
- Cave Creek Unified District (4244)
- NCES district ID
- 0400001
- Math proficiency
- 57% ▼ -9.00%
- Reading proficiency
- 59% ▼ -8.00%
- Median HH income
- $102,788
- Composite
- 54.46/100
- National rank
- #1351
- State rank
- #13 of 249 in AZ
Livability — Scottsdale
- Score
- 80/100
- State rank
- #4
- US rank
- #1756
Category grades
Schools grade is shown separately in the Schools card above.
Census & demographics
- Census place
- Scottsdale, AZ
- County
- Maricopa County · 4,537,380 people
- City population
- 290,846
- Metro
- Phoenix-Mesa-Chandler, AZ
- Population (ZIP)
- 14,329
- Household income
- $177,790
- Rent vs Own
- Severe rent burden
- 70.0
Population outlook (Maricopa County) Hauer SSP2
- Today (2025)
- 4,979,203 people
- By 2030
- 5,378,229 · +8.0%
- By 2040
- 6,156,598 · +23.6%
- By 2050
- 6,872,376 · +38.0%
- By 2075
- 8,401,270 · +68.7%
- By 2100
- 9,247,439 · +85.7%
Race, ethnicity, and origin ACS 2023
- Neighborhood character
- Predominantly White (89%)
- Race & ethnicity
- White 89% Two or more races 6% Hispanic / Latino 6% Black 1%
- Hispanic origin (detail)
- Mexican 1% Puerto Rican 2%
- Common ancestry
- Romanian 5% Portuguese 4% Lithuanian 3%
- Foreign-born
- 9% · Canada
- Languages at home
- 92% English-only · Spanish 4% Other Indo-European 2% Other Asian/Pacific 1%
Political lean MEDSL · Maricopa
- 2024 margin
- Toss-up / Even · D 47.7% · R 51.2% · Other 1.1%
- 2008→2024 swing
- +7.1pp toward D · 2008: -10.6pp · 2024: -3.5pp
- All cycles
- 2024: R+3.5 2020: D+2.2 2016: R+3.5 2012: R+12.0 2008: R+10.6
Not yet ingested
- Civics
- —
Market trends
- HPI YoY
- ▼ -39.65%
- Current HPI
- 286.3814
- Rent YoY
- —
- Metro
- Phoenix-Mesa-Chandler, AZ
- State GDP YoY
- ▲ 4.54%
- F500 in state
- 20
Industry mix (Fortune 500 HQ in AZ)
| Industry | F500 HQs | Revenue |
|---|---|---|
| Technology | 2 | $13B |
|
||
| Mining / Metals | 1 | $23B |
|
||
| Environmental Services | 1 | $16B |
|
||
| Metals / Steel | 1 | $14B |
|
||
| Technology Distribution | 1 | $9B |
|
||
| Homebuilding | 1 | $8B |
|
||
Price history
-99.8% since first listed34 events — show timeline
- 2026-04-29 Rental Removed $6,150 ARMLS
- 2026-04-17 Listed $900,000 ARMLS
- 2025-11-19 Listed for Rent $6,150 ARMLS
- 2025-11-04 Listing Removed — ARMLS
- 2025-10-02 Rental Removed $5,475 ARMLS
- 2025-06-30 Price Changed $898,900 ARMLS
- 2025-06-13 Price Changed $5,475 ARMLS
- 2025-05-18 Listed for Rent $6,500 ARMLS
- 2025-05-17 Price Changed $939,900 ARMLS
- 2025-04-29 Relisted — ARMLS
- 2025-04-25 Listing Removed — ARMLS
- 2025-01-08 Rental Removed $4,150 ARMLS
- 2024-08-20 Price Changed $4,150 ARMLS
- 2024-01-23 Price Changed $6,500 ARMLS
- 2023-11-01 Price Changed $4,900 ARMLS
- 2023-08-09 Price Changed $6,000 ARMLS
- 2019-07-26 Sold (Public Records) $505,000 Public Records
- 2019-07-26 Sold (MLS) $505,000 ARMLS
- 2019-07-15 Pending — ARMLS
- 2019-07-09 Contingent — ARMLS
- 2019-07-02 Price Changed $514,900 ARMLS
- 2019-06-01 Listed $524,900 ARMLS
- 2003-06-17 Sold (Public Records) $279,000 Public Records
- 2003-06-17 Sold (MLS) $279,000 ARMLS
- 2003-01-27 Listed $289,900 ARMLS
- 2003-01-15 Listing Removed — ARMLS
- 2002-09-15 Listed $299,900 ARMLS
- 2002-09-03 Listing Removed — ARMLS
- 2002-05-14 Listed $330,000 ARMLS
- 2002-05-07 Listing Removed — ARMLS
- 2002-01-28 Listed $299,850 ARMLS
- 2001-03-08 Listing Removed — ARMLS
- 2000-12-06 Listed $289,950 ARMLS
- 1996-04-30 Sold (Public Records) $3,847,000 Public Records
Property tax history
+1.4%/yrLatest (2025): $2,074 · +0.8% YoY. Source: county tax records.
Cash-flow waterfall
monthlySold comps — $/sqft
last 12 mo · ≤1 miLoading sold comps…