29 Delmar Street St · Binghamton, NY
Flood risk 1/10 · Minimal
- FEMA flood zone
- X
- Chance of flooding over 30 yrs
- 0.0%
- Est. flood insurance / yr
- $473 – $860
Fire risk 1/10 · Minimal
- Est. fire insurance / yr
- $691 – $1,283
Heat risk 3/10 · Minor
- Hot days now (above 92°F)
- 7 days/yr
- Hot days in 30 yrs
- 16 days/yr
Wind risk 2/10 · Minimal
- Chance of severe wind over 30 yrs
- 2.0%
Air-quality risk 2/10 · Minimal
- Unhealthy air days now
- 0 days/yr
- Unhealthy air days in 30 yrs
- 1 days/yr
Risk factors via First Street. Map © Google.
Why this score? — see what drove the D- grade
The composite is a weighted blend of 9 inputs, each scored 0–100. Each bar is that input's sub-score; the figure is the points it added to the 100-point composite (weight × sub-score).
- Appreciation +10.0/10.0
- Cash flow +8.0/30.0
- Livability +3.9/5.0
- 1% rule +3.8/10.0
- Schools +3.0/10.0
- Rent growth +2.5/5.0
- Condition / age +2.5/5.0
- DSCR +2.1/10.0
- ARV discount +0.0/15.0
$159,999
🖨 Deal sheet (PDF) 📄 Offer letter ✓ Due diligence
Listing remarks
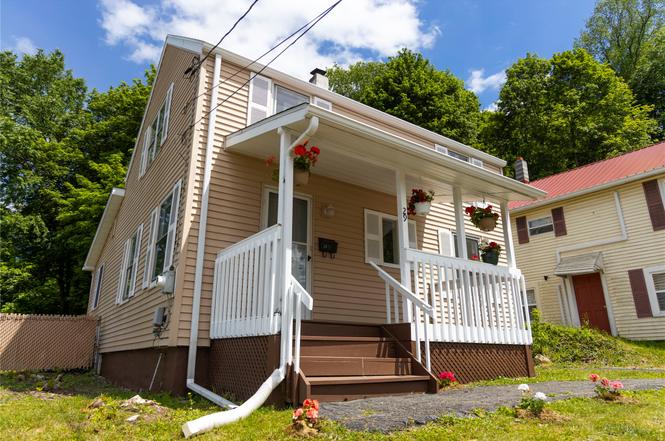
Located on a hill affords one of the best views - enjoy your favorite morning beverage on the front porch overlooking the city below. And enjoy being close to everything that Binghamton has to offer - restaurants, medical facilities, The Arena, easy on and off the Brandywine! This home leaves nothing to be done! All new floors and many walls. Both bathrooms were gutted and redone! All new kitchen including walls, floors, cabinets, and fixtures. The bedrooms were given a face lift as well! Contact your favorite real esate salesperson and come see it! Owner is a NYS licensed realtor.
Key facts
- New floors
- Close to restaurants
- Close to the arena
Tags
Property features AI
Finance
- Other: Property located in residential (Res) zoning
Exterior
- Parking: Driveway
- Utilities: Public water; Public sewer; Cable available
- Home design: Single-family residence; Residential property
- Construction: Aluminum siding
- Exterior features: Sloped yard
Interior
- Flooring: Laminate
- Bathrooms: 2 full bathrooms
- Heating & cooling: Forced air heating
- Interior features: Electric water heater; Laminate flooring; Basement
Neighborhood map
What this means for you Summary
Snapshot
- This is a 3-bed/2.0-bath single-family listed at $160k.
Deal economics
- At list price, monthly cash flow is $-164 ($-2k/yr) — negative.
- To cash-flow at today's rent, offer at most $131k (18.1% below list).
- To meet the 1% rule (rent ≥ 1% of price), the offer needs to be $140k (12.4% below list).
- Recommended offer: $131k (18.1% below list) — sets the bar for cash-flow.
- Cap rate 5.1% vs local median 6.4% in Binghamton — below-typical yield; the buyer is paying a premium for something (appreciation thesis, condition, location) that the cap rate doesn't capture.
Location & tenants
- Location reads 78/100 on livability (#174 in NY, #2,710 nationally) — a middle-class / working-renter tenant base. Strengths: amenities A+, commute A+, cost of living A+; Watch: crime F, employment F.
- Binghamton City School District (urban): math 30% / reading 44% proficiency, ranked #557 of 590 in NY (top 94%) — families likely to look elsewhere, expect single-tenant / working-renter base with shorter leases; 61% free/reduced lunch — lower-income household profile, screen leases tightly.
- Zoned schools: Benjamin Franklin Elementary School (math 17% / reading 32%, grade F, #1,846 of 2,108 statewide, top 91%, 399 students, 75% FRL); Binghamton High School (math 71% / reading 79%, grade A-, #631 of 1,100 statewide, top 58%, 1,341 students, 69% FRL).
- Zoned-school proficiency averages 50% at this address vs 37% district-wide (+13 pts) — the actual schools serving this property are materially stronger than the Binghamton City School District average implies; a family-tenant draw the district grade alone would hide.
- Market conditions: 112 active listings in the ZIP; 13 comparable units currently listed for rent nearby; rentals at typical pace (median 23d on market — plan ~3-4 weeks tenant-placement turnaround); 46% of comp listings sitting > 30 days — soft ceiling on asking rent; 340 units permitted in Broome County in 2024 (269 in 5+ unit buildings).
Forward outlook
- In year one you build about $17k of equity ($1k loan paydown + $16k appreciation (10.0% local appreciation)).
- Broome County population projected at -13% by 2050 — secular population decline; favor cash flow + early exit over multi-decade hold.
- By year 3, paydown + projected appreciation supports a ~$43k cash-out refi (75% LTV) — recoverable capital for the next deal without selling this one.
Negotiation context
- Only 10 days on market — expect competitive offers; lowballing is unlikely to land.
Risks & watch-outs
- Watch-outs: property tax is 2.7% of price; built in 1952 — expect roof / HVAC / electrical / plumbing capex.
Questions for the listing agent
- What do current leases actually rent for vs. the listed asking? Can we see a recent rent roll and the last 12 months of T-12 income?
- Built in 1952 — when were the roof, HVAC, electrical panel, plumbing, and water heater last replaced?
- Property tax is high relative to price — has the assessment been appealed recently, and will the sale trigger a re-assessment?
- Is there a deadline driving the sale (1031 exchange, divorce, estate, relocation)? That informs how much negotiation room exists.
- Schools are D-rated, which usually means shorter tenancies and higher turnover. Who's the typical renter profile here, and what's been the actual vacancy rate?
- Crime grade is F in this area — have there been break-ins, vandalism, or insurance claims at this property in the last 3 years? What carrier currently insures it and at what premium?
- The area grade is low — what's the realistic commute time and amenity access for the typical tenant pool here? Any planned neighborhood developments (good or bad) we should know about?
- What's the average days-on-market for RENTAL listings here right now (not sales)? A rising rental-DOM trend means longer vacancies and softer asking-rent achievability than the comps imply.
- What's the recent tenant-quality profile in this submarket — average credit score on applications, eviction rate, late-payment / NSF rate, and stable-employment percentage? A property-management company in the area should have these aggregated.
- How much new for-sale + rental construction is in the pipeline within 1–3 miles? Heavy new supply typically softens prices + rents 12–24 months out; constrained supply supports both.
Investment metrics
- 1% rule
- 0.88% ✗
- Cap rate
- 5.07%
- Cash-on-cash
- -4.38%
- DSCR
- 0.81
- GRM
- 9.5
CMA / ARV
- ARV (on-the-fly)
- $119,168
- Comps found
- 9
Show comp detail 9 sales within ~0.75 mi
| Address | Dist | Beds/Ba | Sqft | Sold | Price | $/sf | Match |
|---|---|---|---|---|---|---|---|
| 75 Homer St | 0.44mi | 3/2.0 | 1,126 (+6%) | 6mo | $131,000 | $116 | 65 |
| 89 & 91 Evans Street St | 0.58mi | 3/1.0 | 1,043 (-2%) | 1mo | $101,000 | $97 | 65 |
| 8 Gates St | 0.29mi | 3/1.0 | 1,034 (-3%) | 18mo | $120,000 | $116 | 62 |
| 5 Medford St | 0.18mi | 3/1.0 | 1,136 (+7%) | 22mo | $132,000 | $116 | 58 |
| 417 Conklin Ave | 0.37mi | 2/1.0 (-1) | 1,111 (+4%) | 23mo | $100,000 | $90 | 47 |
| 50 Powers Rd | 0.46mi | 4/1.0 (+1) | 1,008 (-5%) | 20mo | $70,000 | $69 | 44 |
| 19 Bigelow St | 0.69mi | 2/1.5 (-1) | 1,122 (+6%) | 14mo | $70,500 | $63 | 40 |
| 10 Howard Ave | 0.65mi | 3/1.5 | 1,208 (+14%) | 13mo | $135,000 | $112 | 34 |
| 5 Espial Dr | 0.58mi | 2/1.0 (-1) | 924 (-13%) | 22mo | $110,000 | $119 | 24 |
Match score weights: distance 35% · size 25% · config 20% · recency 20%. Top-matched comps best support the ARV.
Projected returns pro-forma
10.0% appreciation · 3.0% rent growth · sell at horizon
- IRR
- 21.2%
- Equity multiple
- 2.72×
- Total profit
- $76,847
- Equity at exit
- $144,140
- IRR
- 19.2%
- Equity multiple
- 6.24×
- Total profit
- $234,735
- Equity at exit
- $310,843
Cash invested: $44,800 (down + closing). Projections, not guarantees.
Landlord ↔ Tenant lean methodology
- Overall (STATE)
- 15 Strongly Tenant-Friendly
- State New York
- 15 Strongly Tenant-Friendly · D+10
- County
- — inherits STATE
- City
- — inherits STATE
ZIP-level market 13903
- Home prices YoY
- 4.3%
- Active inventory
- 112
- Price-to-rent
- 9.5×
Monthly cashflow live
- Estimated rent
- $1,401 high interval (Pro) →
- Mortgage (P&I)
- −$839
- Tax from tax record
- −$365 /mo · $4,375/yr
- Insurance
- −$67
- HOA
- −$0
- Vacancy / Maint / Mgmt
- −$294
- Net cashflow
- $-164
Break-even live
Sensitivity live
| Price | -10% $-73 | -5% $-118 | +0% $-164 | +5% $-209 | +10% $-254 |
|---|---|---|---|---|---|
| Rent | -10% $-274 | -5% $-219 | +0% $-164 | +5% $-108 | +10% $-53 |
| Rate | -1.0pp $-83 | -0.5pp $-123 | base $-164 | +0.5pp $-205 | +1.0pp $-247 |
UW: 25.0% down · 7.5% · 30yr · 1.5% tax · 5.0% vac · 8.0% maint · 8.0% mgmt
Financing live
Cash to close
- Down payment
- $40,000
- Closing costs
- $4,800
- Reserves months
- —
- Total cash needed
- —
Loan-product check · same deal, 3 products live
Conventional
25% down · 7.5% · 30yr
- Down + closing
- —
- Monthly P&I
- —
- Monthly cashflow
- —
- DSCR
- —
- Eligible?
- —
Personal DTI + credit; lowest rate.
DSCR
20% down · 8.5% · 30yr
- Down + closing
- —
- Monthly P&I
- —
- Monthly cashflow
- —
- DSCR
- —
- Eligible?
- —
No personal income docs; deal must DSCR.
Hard money
10% down · 12.0% · 12mo
- Down + closing
- —
- Monthly P&I
- —
- Monthly cashflow
- —
- DSCR
- —
- Eligible?
- —
Short-term bridge; refi at stabilization.
Rent comps 13 comps
| Address | Beds | Baths | Sqft | Rent | $/sqft | DOM | Units | Dist |
|---|---|---|---|---|---|---|---|---|
| 231 Conklin Ave #2 Binghamton, NY | 3.0 | 1.0 | 700 | $1,350 | $1.93 | 45d | 1 | 0.75mi |
| 27 Tompkins St Unit 9 Binghamton, NY | 2.0 | 1.0 | 950 | $950 | $1.00 | 45d | 1 | 0.76mi |
| 27 Tompkins St Unit 10 Binghamton, NY | 2.0 | 1.0 | 950 | $1,050 | $1.11 | 23d | 1 | 0.76mi |
| 37 Bigelow St Unit 1 Binghamton, NY | 3.0 | 1.5 | 854 | $1,500 | $1.76 | 15d | 1 | 0.78mi |
| 147 E Frederick St Binghamton, NY | 2.0 | 1.0 | 800 | $1,200 | $1.50 | 15d | 1 | 1.15mi |
| 33 Fayette St Unit 22 Binghamton, NY | 2.0 | 1.0 | 1350 | $1,100 | $0.81 | 15d | 1 | 1.24mi |
| 198 Court St Unit 10 Binghamton, NY | 2.0 | 1.0 | 700 | $1,200 | $1.71 | 23d | 1 | 1.25mi |
| 198 Court St Unit 6 Binghamton, NY | 2.0 | 1.0 | 700 | $1,350 | $1.93 | 23d | 1 | 1.25mi |
| 26 Doubleday St Binghamton, NY | 2.0 | 1.0 | 1000 | $1,350 | $1.35 | 45d | 1 | 1.34mi |
| 26 Doubleday St #2 Binghamton, NY | 2.0 | 1.0 | 850 | $1,400 | $1.65 | 46d | 1 | 1.34mi |
| 86 Conklin Ave Binghamton, NY | 3.0 | 1.0 | 1316 | $1,600 | $1.22 | 15d | 1 | 1.36mi |
| 1 Euclid Ave Unit 1 Binghamton, NY | 3.0 | 1.0 | 1100 | $1,500 | $1.36 | 45d | 1 | 1.40mi |
| 136 Court St Unit 2 Binghamton, NY | 4.0 | 1.0 | 1373 | $3,000 | $2.18 | 45d | 1 | 1.44mi |
Listing history 9 events
-
2026-06-21days on market $159,999 Active 10 DOM
-
2026-06-19days on market $159,999 Active 8 DOM
-
2026-06-18days on market $159,999 Active 7 DOM
-
2026-06-17days on market $159,999 Active 6 DOM
-
2026-06-16days on market $159,999 Active 5 DOM
-
2026-06-15days on market $159,999 Active 4 DOM
-
2026-06-14days on market $159,999 Active 2 DOM
-
2026-06-13remarks 594-char remark
-
2026-06-13$159,999 Active 1 DOM
ⓘ Source: listings_history table (triggers on properties + properties_extension) + one-shot
backfill from property_details.listing_events for pre-trigger history.
Tax reassessment forecast NY · Partial reset (capped growth)
- Current annual tax
- $4,375 · $365/mo
- Projected year-2 tax
- $4,375 · $365/mo
- Expected delta
- $0/yr ($0/mo · 0.0%)
ⓘ Screening estimate from a state-policy table — verify with the county assessor before closing.
Climate risk First Street
- Flood 1/10 Low FEMA zone X · 0% chance over 30 yrs
- Wildfire 1/10 Low
- Heat 3/10 Moderate 7 d/yr ≥92°F today · 16 d/yr by 30 yrs out
- Wind 2/10 Low 2% chance of damaging wind over 30 yrs
- Air quality 2/10 Low 0 unhealthy d/yr today · 1 by 30 yrs out
Nearby sold comps map
Loading sold comps map…
Walkable amenities ~0.75 mi
Loading nearby amenities…
Taxation est. · year 1
- Rental income
- $16,811
- − Mortgage interest
- −$8,962
- − Property taxes
- −$4,375
- − Insurance
- −$800
- − Repairs & maintenance
- −$1,345
- − Management
- −$1,345
- − Depreciation
- −$4,655
- Taxable loss
- −$4,670
- Est. tax savings @ 24.0%
- +$1,121
- After-tax cash flow
- $-841/yr
For passive investors: Depreciation is non-cash, so a rental often shows a tax loss while cash-flowing — sheltering income. Rental losses are passive: they offset passive income freely, and up to $25,000/yr can offset ordinary (W-2) income if you actively participate and your MAGI is under $100k (phasing out to $0 by $150k); unused losses carry forward. On sale, claimed depreciation is recaptured at up to 25%, and gains may owe capital-gains tax (a 1031 exchange can defer both). Figures are a year-1 estimate at your 24.0% rate — not tax advice; consult a CPA.
Schools (NCES district)
- District
- Binghamton City School District
- NCES district ID
- 3604870
- Math proficiency
- 30% ▬ 0.00%
- Reading proficiency
- 44% ▲ 15.00%
- Median HH income
- $30,475
- Composite
- 30.09/100
- National rank
- #6342
- State rank
- #557 of 590 in NY
Livability — Binghamton
- Score
- 78/100
- State rank
- #174
- US rank
- #2710
Category grades
Schools grade is shown separately in the Schools card above.
Census & demographics
- Census place
- Binghamton, NY
- County
- Broome County · 126,805 people
- City population
- 65,170
- Metro
- Binghamton, NY
- Population (ZIP)
- 17,569
- Household income
- $66,278
- Rent vs Own
- Severe rent burden
- 602.0
Population outlook (Broome County) Hauer SSP2
- Today (2025)
- 187,989 people
- By 2030
- 183,066 · -2.6%
- By 2040
- 172,228 · -8.4%
- By 2050
- 163,161 · -13.2%
- By 2075
- 153,641 · -18.3%
- By 2100
- 140,851 · -25.1%
Race, ethnicity, and origin ACS 2023
- Neighborhood character
- Predominantly White (80%)
- Race & ethnicity
- White 80% Black 9% Two or more races 6% Hispanic / Latino 4% Asian 1%
- Common ancestry
- Romanian 6% Slovak 2% Scotch-Irish 2%
- Foreign-born
- 5% · Canada
- Languages at home
- 94% English-only · Spanish 2% Other Indo-European 1% Arabic 1%
Political lean MEDSL · Broome
- 2024 margin
- Toss-up / Even · D 50.2% · R 49.8%
- 2008→2024 swing
- -7.6pp toward R · 2008: 8.0pp · 2024: 0.4pp
- All cycles
- 2024: D+0.4 2020: D+3.5 2016: R+3.7 2012: D+4.6 2008: D+8.0
Not yet ingested
- Civics
- —
Market trends
- HPI YoY
- ▲ 11.68%
- Current HPI
- 286.1001
- Rent YoY
- —
- Metro
- Binghamton, NY
- State GDP YoY
- ▲ 2.60%
- F500 in state
- 92
Industry mix (Fortune 500 HQ in NY)
| Industry | F500 HQs | Revenue |
|---|---|---|
| Financial Services | 10 | $950B |
|
||
| Consumer Goods | 9 | $162B |
|
||
| Insurance | 4 | $225B |
|
||
| Telecommunications | 2 | $144B |
|
||
| Pharmaceuticals | 2 | $112B |
|
||
| Media / Entertainment | 2 | $69B |
|
||
Price history
1 event — show timeline
- 2026-06-11 Listed $159,999 GBAOR
Property tax history
+12.4%/yrLatest (2025): $4,375 · +0.9% YoY. Source: county tax records.
Cash-flow waterfall
monthlySold comps — $/sqft
last 12 mo · ≤1 miLoading sold comps…