36200 Paradise Ranch Rd #120 · Hasley Canyon, CA
Flood risk 9/10 · Severe
- FEMA flood zone
- D
- Chance of flooding over 30 yrs
- 0.99%
- Est. flood insurance / yr
- $544 – $1,084
Fire risk 10/10 · Severe
- Est. fire insurance / yr
- $659 – $1,223
Heat risk 5/10 · Moderate
- Hot days now (above 96°F)
- 8 days/yr
- Hot days in 30 yrs
- 22 days/yr
Wind risk 1/10 · Minimal
- Chance of severe wind over 30 yrs
- —
Air-quality risk 7/10 · Major
- Unhealthy air days now
- 15 days/yr
- Unhealthy air days in 30 yrs
- 18 days/yr
Risk factors via First Street. Map © Google.
Why this score? — see what drove the B grade
The composite is a weighted blend of 9 inputs, each scored 0–100. Each bar is that input's sub-score; the figure is the points it added to the 100-point composite (weight × sub-score).
- Cash flow +30.0/30.0
- DSCR +10.0/10.0
- 1% rule +9.4/10.0
- ARV discount +7.5/15.0
- Schools +5.9/10.0
- Rent growth +2.5/5.0
- Livability +2.5/5.0
- Condition / age +2.5/5.0
- Appreciation +0.0/10.0
$230,000
🖨 Deal sheet 📄 Offer letter ✓ Due diligence
Listing remarks
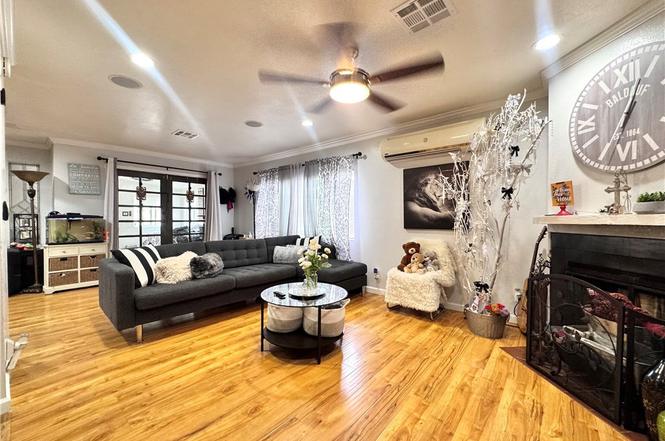
Welcome to Paradise Ranch and your new home! This spacious 4-bedroom, 2-bathroom manufactured home offers comfort and convenience for the whole family. Step inside and discover a bright living room, perfect for movie nights with its 5.1 surround sound system. Stay comfortable year-round with a 2-ton mini-split and a cozy wood-burning fireplace. Enjoy meals in the formal dining room, while the huge kitchen provides ample space for cooking and entertaining. Throughout the common areas, you'll find elegant crown molding and recessed lighting. In addition to the four bedrooms, there's a versatile bonus room/den, ideal for a home office, playroom, or media room. The master bedroom features slidi
Key facts
- Formal dining room
- Huge kitchen
- Crown molding
Tags
Property features AI
Finance
- Other: Park name: Paradise Ranch Mobile Home Park; Community features include hiking; Triple body type (multi-unit information noted)
- Financial info: Monthly land lease applies
- HOA & community: Located in a mobile home park (land lease applies)
Exterior
- Parking: Carport with space for 3 vehicles; Gravel road access; Located in Paradise Ranch Mobile Home Park
- Security: Manager approval required for park; Security cameras excluded from sale
- Utilities: 220V electrical throughout; Public/district water; Public sewer; Natural gas available; Electricity available; Water and sewer available
- Home design: Mobile home on lot (mobile remains); Turnkey, updated/remodeled condition; One story; Facing front entry
- Construction: Shingle roof; Drywall walls; Pier jacks foundation
- Exterior features: Rear porch; Awning; Community pool; Shed (1)
Interior
- Kitchen: Remodeled kitchen; Kitchen island; Granite counters; Microwave; Refrigerator; Gas oven; Dishwasher
- Bedrooms: Walk-in closet; Laundry room listed as a room (see Laundry & utility)
- Flooring: Tile; Carpet; Wood; Laminated
- Bathrooms: 2 full bathrooms; Bathtub and shower; Remodeled bathrooms
- Heating & cooling: Central furnace heating; Central cooling; Wall/window cooling units
- Interior features: Crown moldings; Ceiling fan; Recessed lighting; Storage space; Wired for sound; Sliding glass door(s); Carbon monoxide and smoke detectors; One-level living; Front entry
- Laundry & utility: Inside laundry room; Washer hookup; Gas dryer hookup; Individual laundry room
Neighborhood map
What this means for you Summary
Snapshot
- This is a 4-bed/2.0-bath manufactured listed at $230k.
Deal economics
- At list price, monthly cash flow is $963 ($12k/yr) — positive.
- The deal already cash-flows at list — no discount required.
- Meets the 1% rule at list price ($3k rent vs $230k).
- Recommended offer: $202k (12.0% below list) — sets the bar for market timing.
Location & tenants
- Location reads 49/100 on livability (#1,168 in CA) — a working-class tenant base; expect higher turnover. Strengths: crime A+, employment A+; Watch: housing C-, schools F, amenities F.
- William S. Hart Union High (suburban): math 52% / reading 72% proficiency, ranked #155 of 1,400 in CA (top 11%) — acceptable for families but not a draw, mixed tenant base, ~2y average lease; only 18% free/reduced lunch — higher-income household profile.
- Market conditions: 140 active listings in the ZIP; 19,697 units permitted in Los Angeles County in 2024 (9,426 in 5+ unit buildings).
Forward outlook
- Local home prices are declining (-3.0%/yr); year-one equity from $2k of loan paydown is wiped out by about $7k of value loss. Plan a longer hold.
- Los Angeles County population projected at +9% by 2050 — modest demand growth; plan on rents tracking national, not racing it.
- At projected returns (-3.0% appreciation + 3.0% rent growth), your $64k cash investment doubles in ~7 years — after that, you're playing with house money.
Negotiation context
- It's been on market 269 days — a 12% lower offer ($202k) is reasonable based on typical stale-listing flexibility.
Risks & watch-outs
- Watch-outs: flood insurance adds $68/mo.
- Climate carrying-cost: severe flood risk; severe wildfire risk; extreme-heat days projected 8→22/yr by 2055 (HVAC capex compounding) — expect insurance premiums to compound above CPI over the hold.
Questions for the listing agent
- It's been on market 269 days. Have you received any prior offers? Is the seller open to a 12% concession, seller financing, or rate buy-down credit?
- Built in 1978 — when were the roof, HVAC, electrical panel, plumbing, and water heater last replaced?
- What's the actual annual flood-insurance premium (NFIP or private), and is the property in a SFHA with mandatory coverage?
- Why hasn't it sold? Are there any deal-killer items the seller is aware of (foundation, flood, title, zoning, code violations)?
- Is there a deadline driving the sale (1031 exchange, divorce, estate, relocation)? That informs how much negotiation room exists.
- Schools are F-rated, which usually means shorter tenancies and higher turnover. Who's the typical renter profile here, and what's been the actual vacancy rate?
- What's the average days-on-market for RENTAL listings here right now (not sales)? A rising rental-DOM trend means longer vacancies and softer asking-rent achievability than the comps imply.
- What's the recent tenant-quality profile in this submarket — average credit score on applications, eviction rate, late-payment / NSF rate, and stable-employment percentage? A property-management company in the area should have these aggregated.
- How much new for-sale + rental construction is in the pipeline within 1–3 miles? Heavy new supply typically softens prices + rents 12–24 months out; constrained supply supports both.
Investment metrics
- 1% rule
- 1.44% ✓
- Cap rate
- 11.67%
- Cash-on-cash
- 19.22%
- DSCR
- 1.86
- GRM
- 5.8
CMA / ARV
- ARV (on-the-fly)
- $146,640
- Comps found
- 2
Show comp detail 2 sales within ~0.75 mi
| Address | Dist | Beds/Ba | Sqft | Sold | Price | $/sf | Match |
|---|---|---|---|---|---|---|---|
| 36200 Paradise Ranch Rd #8 | 0.00mi | 3/2.0 (-1) | 1,776 (-6%) | 9mo | $135,000 | $76 | 78 |
| 36200 Paradise Ranch Rd #104 | 0.00mi | 4/2.0 | 2,060 (+10%) | 10mo | $160,000 | $78 | 76 |
Match score weights: distance 35% · size 25% · config 20% · recency 20%. Top-matched comps best support the ARV.
Projected returns pro-forma
-3.0% appreciation · 3.0% rent growth · sell at horizon
- IRR
- 9.5%
- Equity multiple
- 1.38×
- Total profit
- $24,186
- Equity at exit
- $34,294
- IRR
- 18.7%
- Equity multiple
- 2.56×
- Total profit
- $100,450
- Equity at exit
- $19,886
Cash invested: $64,400 (down + closing). Projections, not guarantees.
Landlord ↔ Tenant lean methodology
- Overall (STATE)
- 18 Strongly Tenant-Friendly
- State California
- 18 Strongly Tenant-Friendly · D+13
- County
- — inherits STATE
- City
- — inherits STATE
ZIP-level market 91384
- Home prices YoY
- -28.3%
- Active inventory
- 140
- Price-to-rent
- 5.8×
Monthly cashflow live
- Estimated rent
- $3,317 medium interval (Pro) →
- Mortgage (P&I)
- −$1,206
- Tax est. 1.5%
- −$288 /mo · $3,450/yr
- Insurance
- −$96
- Flood insurance flood zone
- −$68 /mo · $814/yr
- HOA
- −$0
- Vacancy / Maint / Mgmt
- −$697
- Net cashflow
- $963
Break-even live
UW: 25.0% down · 7.5% · 30yr · 1.5% tax · 5.0% vac · 8.0% maint · 8.0% mgmt
Financing live
Cash to close
- Down payment
- $57,500
- Closing costs
- $6,900
- Reserves months
- —
- Total cash needed
- —
Loan-product check · same deal, 3 products live
Conventional
25% down · 7.5% · 30yr
- Down + closing
- —
- Monthly P&I
- —
- Monthly cashflow
- —
- DSCR
- —
- Eligible?
- —
Personal DTI + credit; lowest rate.
DSCR
20% down · 8.5% · 30yr
- Down + closing
- —
- Monthly P&I
- —
- Monthly cashflow
- —
- DSCR
- —
- Eligible?
- —
No personal income docs; deal must DSCR.
Hard money
10% down · 12.0% · 12mo
- Down + closing
- —
- Monthly P&I
- —
- Monthly cashflow
- —
- DSCR
- —
- Eligible?
- —
Short-term bridge; refi at stabilization.
Listing history 17 events
-
2026-06-18days on market $230,000 Active 269 DOM
-
2026-06-17days on market $230,000 Active 268 DOM
-
2026-06-16days on market $230,000 Active 267 DOM
-
2026-06-15days on market $230,000 Active 266 DOM
-
2026-06-13days on market $230,000 Active 264 DOM
-
2026-06-13days on market $230,000 Active 263 DOM
-
2026-06-09days on market $230,000 Active 260 DOM
-
2026-06-08days on market $230,000 Active 259 DOM
-
2026-06-07days on market $230,000 Active 258 DOM
-
2026-06-04days on market $230,000 Active 255 DOM
-
2026-06-03days on market $230,000 Active 254 DOM
-
2026-06-02days on market $230,000 Active 253 DOM
-
2026-06-01days on market $230,000 Active 252 DOM
-
2026-05-31days on market $230,000 Active 251 DOM
-
2026-04-01price $230,000
-
2026-02-17price $249,900
-
2025-09-22$259,900 Active
ⓘ Source: listings_history table (triggers on properties + properties_extension) + one-shot
backfill from property_details.listing_events for pre-trigger history.
Climate risk First Street
- Flood 9/10 Extreme FEMA zone D · 99% chance over 30 yrs
- Wildfire 10/10 Extreme
- Heat 5/10 Major 8 d/yr ≥96°F today · 22 d/yr by 30 yrs out
- Wind 1/10 Low
- Air quality 7/10 Severe 15 unhealthy d/yr today · 18 by 30 yrs out
Nearby sold comps map
Loading sold comps map…
Walkable amenities ~0.75 mi
Loading nearby amenities…
Taxation est. · year 1
- Rental income
- $39,809
- − Mortgage interest
- −$12,884
- − Property taxes
- −$3,450
- − Insurance
- −$1,964
- − Repairs & maintenance
- −$3,185
- − Management
- −$3,185
- − Depreciation
- −$6,691
- Taxable income
- $8,451
- Est. tax owed @ 24.0%
- −$2,028
- After-tax cash flow
- $9,533/yr
For passive investors: Depreciation is non-cash, so a rental often shows a tax loss while cash-flowing — sheltering income. Rental losses are passive: they offset passive income freely, and up to $25,000/yr can offset ordinary (W-2) income if you actively participate and your MAGI is under $100k (phasing out to $0 by $150k); unused losses carry forward. On sale, claimed depreciation is recaptured at up to 25%, and gains may owe capital-gains tax (a 1031 exchange can defer both). Figures are a year-1 estimate at your 24.0% rate — not tax advice; consult a CPA.
Schools (NCES district)
- District
- William S. Hart Union High
- NCES district ID
- 0642510
- Math proficiency
- 52% ▬ 0.00%
- Reading proficiency
- 72% ▲ 1.00%
- Median HH income
- $95,844
- Composite
- 58.6/100
- National rank
- #2030
- State rank
- #155 of 1400 in CA
Livability — Hasley Canyon
- Score
- 49/100
- State rank
- #1168
- US rank
- #25897
Category grades
Schools grade is shown separately in the Schools card above.
Census & demographics
- Population (ZIP)
- 27,278
Population outlook (Los Angeles County) Hauer SSP2
- Today (2025)
- 10,940,515 people
- By 2030
- 11,256,481 · +2.9%
- By 2040
- 11,729,929 · +7.2%
- By 2050
- 11,948,407 · +9.2%
- By 2075
- 11,818,114 · +8.0%
- By 2100
- 10,842,928 · -0.9%
Race, ethnicity, and origin ACS 2023
- Neighborhood character
- Diverse neighborhood (Simpson 0.67)
- Race & ethnicity
- Hispanic / Latino 43% White 37% Two or more races 22% Asian 9% Black 5% Native American 1%
- Hispanic origin (detail)
- Mexican 31%
- Common ancestry
- Italian 3% Lithuanian 2% Portuguese 2%
- Foreign-born
- 20% · Canada, South Korea, China
- Languages at home
- 62% English-only · Spanish 29% Other Indo-European 2% Tagalog/Filipino 2%
Political lean MEDSL · Los Angeles
- 2024 margin
- Solid D (+32.9) · D 64.8% · R 31.9% · Other 3.3%
- 2008→2024 swing
- -7.4pp toward R · 2008: 40.4pp · 2024: 32.9pp
- All cycles
- 2024: D+32.9 2020: D+44.2 2016: D+48.0 2012: D+40.0 2008: D+40.4
Not yet ingested
- Civics
- —
Market trends
- HPI YoY
- ▼ -126.54%
- Current HPI
- 319.9021
- Rent YoY
- —
- Metro
- —
- State GDP YoY
- ▲ 3.21%
- F500 in state
- 116
Industry mix (Fortune 500 HQ in CA)
| Industry | F500 HQs | Revenue |
|---|---|---|
| Technology | 27 | $1,492B |
|
||
| Financial Services | 3 | $174B |
|
||
| Retail | 3 | $44B |
|
||
| Insurance | 3 | $26B |
|
||
| Media / Entertainment | 2 | $115B |
|
||
| Pharmaceuticals / Biotech | 2 | $62B |
|
||
Price history
-11.5% since first listed3 events — show timeline
- 2026-04-01 Price Changed $230,000 CRMLS
- 2026-02-17 Price Changed $249,900 CRMLS
- 2025-09-22 Listed $259,900 CRMLS
Property tax history
+8.4%/yrLatest (2025): $403 · +8.4% YoY. Source: county tax records.
Cash-flow waterfall
monthlySold comps — $/sqft
last 12 mo · ≤1 miLoading sold comps…