520 S Chaparral St #204 · Corpus Christi, TX
Flood risk No data
- FEMA flood zone
- —
- Chance of flooding over 30 yrs
- —
- Est. flood insurance / yr
- —
Fire risk No data
- Est. fire insurance / yr
- —
Heat risk No data
- Hot days now (above threshold)
- —
- Hot days in 30 yrs
- —
Wind risk No data
- Chance of severe wind over 30 yrs
- —
Air-quality risk No data
- Unhealthy air days now
- —
- Unhealthy air days in 30 yrs
- —
Risk factors via First Street. Map © Google.
Why this score? — see what drove the D grade
The composite is a weighted blend of 9 inputs, each scored 0–100. Each bar is that input's sub-score; the figure is the points it added to the 100-point composite (weight × sub-score).
- ARV discount +15.0/15.0
- Appreciation +6.7/10.0
- 1% rule +6.5/10.0
- Livability +3.9/5.0
- Rent growth +2.9/5.0
- Schools +2.8/10.0
- Condition / age +2.5/5.0
- Cash flow +1.0/30.0
- DSCR +0.0/10.0
$114,000
🖨 Deal sheet (PDF) 📄 Offer letter ✓ Due diligence
Listing remarks MLS
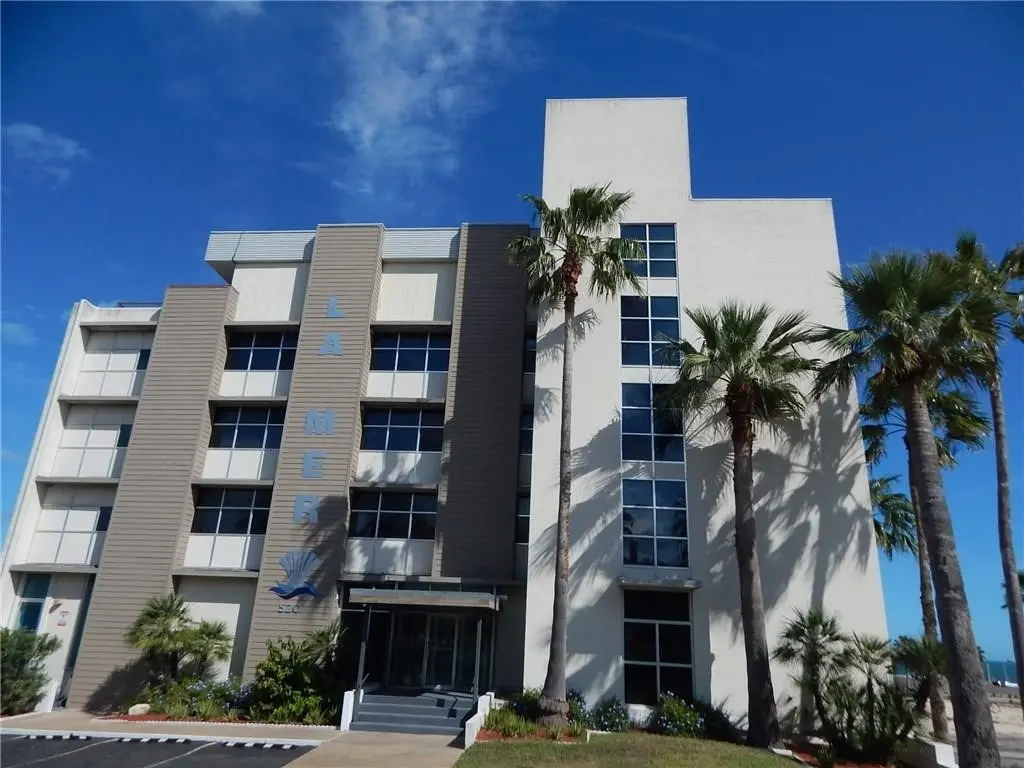
Located on the second floor (unit 204) of the contemporary condo building, La Mer which is situated on bluff with waterviews of beautiful Corpus Christi Bay. Short walk to public beach, city parks, marina, seawall and downtown. Private balcony with views. Convenient access to large pool with BBQ area. Attached parking garage with one parking space and storage room. Main entrance locked for security. Building has laundry room for owners. Quick access to Shoreline Dr, Ocean Drive, I37, Crosstown expressway, hospitals, tourist attractions and popular local restaurants (walking distance). Short term rentals allowed by HOA. Enjoy condo living with sunrises over the bay! Furnace replaced Jan 2025.
Key facts
- Storage room
- Private balcony
- Large pool
Tags
Neighborhood map
What this means for you Summary
Snapshot
- This is a 1-bed/1.0-bath townhouse listed at $114k.
Deal economics
- At list price, monthly cash flow is $-471 ($-6k/yr) — negative.
- To cash-flow at today's rent, offer at most $72k (37.1% below list).
- Meets the 1% rule at list price ($1k rent vs $114k).
- Recommended offer: $72k (37.1% below list) — sets the bar for cash-flow.
- Cap rate 1.3% vs local median 3.6% in Corpus Christi — below-typical yield; the buyer is paying a premium for something (appreciation thesis, condition, location) that the cap rate doesn't capture.
Location & tenants
- Location reads 78/100 on livability (#66 in TX, #2,404 nationally) — a middle-class / working-renter tenant base. Strengths: commute A+, cost of living A+, housing A+; Watch: crime F.
- Corpus Christi ISD (urban): math 31% / reading 35% proficiency, ranked #562 of 826 in TX (top 68%) — families likely to look elsewhere, expect single-tenant / working-renter base with shorter leases; 63% free/reduced lunch — lower-income household profile, screen leases tightly.
- Market conditions: Rents rising (+1.6%/yr); 41 active listings in the ZIP; 30 comparable units currently listed for rent nearby; rentals at typical pace (median 22d on market — plan ~3-4 weeks tenant-placement turnaround); lower-income renter base — watch delinquency; 1,397 units permitted in Nueces County in 2024 (47 in 5+ unit buildings).
- This rent runs 39% of the median local income ($41k/yr) — at the standard rent-burdened threshold; future hikes will face affordability resistance.
Forward outlook
- In year one you build about $5k of equity ($788 loan paydown + $4k appreciation (3.4% local appreciation)).
- Nueces County population projected at +36% by 2050 — long-run rental-demand tailwind backs the buy-and-hold thesis.
- By year 8, paydown + projected appreciation supports a ~$34k cash-out refi (75% LTV) — recoverable capital for the next deal without selling this one.
Negotiation context
- It's been on market 137 days — a 12% lower offer ($100k) is reasonable based on typical stale-listing flexibility.
- 5 sale attempts since 31y ago; this cycle's ask has dropped $16k (12%) from the opening price — seller is motivated, your offer sets the floor, not the list.
- Current owner paid $60k; list at $114k implies a 90% gain — meaningful room to come down on a strong offer.
Risks & watch-outs
- Watch-outs: property tax is 3.4% of price; HOA is 41% of rent; built in 1956 — expect roof / HVAC / electrical / plumbing capex.
Questions for the listing agent
- What do current leases actually rent for vs. the listed asking? Can we see a recent rent roll and the last 12 months of T-12 income?
- It's been on market 137 days. Have you received any prior offers? Is the seller open to a 37% concession, seller financing, or rate buy-down credit?
- Built in 1956 — when were the roof, HVAC, electrical panel, plumbing, and water heater last replaced?
- Property tax is high relative to price — has the assessment been appealed recently, and will the sale trigger a re-assessment?
- What does the HOA fee cover, when was the last increase, and are there any pending special assessments or reserve-fund shortfalls?
- Why hasn't it sold? Are there any deal-killer items the seller is aware of (foundation, flood, title, zoning, code violations)?
- Is there a deadline driving the sale (1031 exchange, divorce, estate, relocation)? That informs how much negotiation room exists.
- Crime grade is F in this area — have there been break-ins, vandalism, or insurance claims at this property in the last 3 years? What carrier currently insures it and at what premium?
- The area grade is low — what's the realistic commute time and amenity access for the typical tenant pool here? Any planned neighborhood developments (good or bad) we should know about?
- What's the average days-on-market for RENTAL listings here right now (not sales)? A rising rental-DOM trend means longer vacancies and softer asking-rent achievability than the comps imply.
- What's the recent tenant-quality profile in this submarket — average credit score on applications, eviction rate, late-payment / NSF rate, and stable-employment percentage? A property-management company in the area should have these aggregated.
- How much new for-sale + rental construction is in the pipeline within 1–3 miles? Heavy new supply typically softens prices + rents 12–24 months out; constrained supply supports both.
Investment metrics
- 1% rule
- 1.15% ✓
- Cap rate
- 1.33%
- Cash-on-cash
- -17.72%
- DSCR
- 0.21
- GRM
- 7.2
CMA / ARV
- ARV (median comp)
- $214,500
- List price
- $114,000
- Delta
- -46.85%
- Verdict
- UNDERPRICED
- Comps
- 17 within 1.0 mi
Show comp detail 7 sales within ~0.75 mi
| Address | Dist | Beds/Ba | Sqft | Sold | Price | $/sf | Match |
|---|---|---|---|---|---|---|---|
| 715 S Upper Broadway St #501 | 0.07mi | 2/2.0 (+1) | 1,125 (+12%) | 4mo | $214,500 | $191 | 66 |
| 715 S Upper Broadway St #804 | 0.07mi | 1/1.0 | 857 (-15%) | 8mo | $138,000 | $161 | 65 |
| 715 S Upper Broadway St #401 | 0.07mi | 2/2.0 (+1) | 1,125 (+12%) | 6mo | $187,000 | $166 | 64 |
| 1400 Ocean Dr Unit 802C | 0.72mi | 1/2.0 | 1,072 (+6%) | 15mo | $279,900 | $261 | 40 |
| 1400 Ocean Dr Unit 301C | 0.72mi | 2/2.0 (+1) | 1,072 (+6%) | 15mo | $275,000 | $257 | 34 |
| 1400 Ocean Dr Unit 304-B | 0.72mi | 2/2.0 (+1) | 1,108 (+10%) | 12mo | $245,900 | $222 | 31 |
| 1400 Ocean Dr Unit 903B | 0.72mi | 2/2.0 (+1) | 1,108 (+10%) | 21mo | $289,900 | $262 | 23 |
Match score weights: distance 35% · size 25% · config 20% · recency 20%. Top-matched comps best support the ARV.
Projected returns pro-forma
3.37% appreciation · 1.63% rent growth · sell at horizon
- IRR
- -8.1%
- Equity multiple
- 0.52×
- Total profit
- $-15,339
- Equity at exit
- $53,668
- IRR
- -3.3%
- Equity multiple
- 0.47×
- Total profit
- $-16,980
- Equity at exit
- $84,632
Cash invested: $31,920 (down + closing). Projections, not guarantees.
Landlord ↔ Tenant lean methodology
- Overall (STATE)
- 87 Strongly Landlord-Friendly
- State Texas
- 87 Strongly Landlord-Friendly · R+5
- County
- — inherits STATE
- City
- — inherits STATE
ZIP-level market 78401
- Home prices YoY
- 3.8%
- Rents YoY
- 1.6%
- Active inventory
- 41
- Price-to-rent
- 7.2×
Monthly cashflow live
- Estimated rent
- $1,313 high interval (Pro) →
- Mortgage (P&I)
- −$598
- Tax from tax record
- −$321 /mo · $3,857/yr
- Insurance
- −$48
- HOA
- −$542
- Vacancy / Maint / Mgmt
- −$276
- Net cashflow
- $-471
Break-even live
Sensitivity live
| Price | -10% $-407 | -5% $-439 | +0% $-471 | +5% $-503 | +10% $-536 |
|---|---|---|---|---|---|
| Rent | -10% $-575 | -5% $-523 | +0% $-471 | +5% $-419 | +10% $-367 |
| Rate | -1.0pp $-414 | -0.5pp $-442 | base $-471 | +0.5pp $-501 | +1.0pp $-531 |
UW: 25.0% down · 7.5% · 30yr · 1.5% tax · 5.0% vac · 8.0% maint · 8.0% mgmt
Financing live
Cash to close
- Down payment
- $28,500
- Closing costs
- $3,420
- Reserves months
- —
- Total cash needed
- —
Loan-product check · same deal, 3 products live
Conventional
25% down · 7.5% · 30yr
- Down + closing
- —
- Monthly P&I
- —
- Monthly cashflow
- —
- DSCR
- —
- Eligible?
- —
Personal DTI + credit; lowest rate.
DSCR
20% down · 8.5% · 30yr
- Down + closing
- —
- Monthly P&I
- —
- Monthly cashflow
- —
- DSCR
- —
- Eligible?
- —
No personal income docs; deal must DSCR.
Hard money
10% down · 12.0% · 12mo
- Down + closing
- —
- Monthly P&I
- —
- Monthly cashflow
- —
- DSCR
- —
- Eligible?
- —
Short-term bridge; refi at stabilization.
Rent comps 30 comps
| Address | Beds | Baths | Sqft | Rent | $/sqft | DOM | Units | Dist |
|---|---|---|---|---|---|---|---|---|
| 715 S Upper Broadway #903 Corpus Christi, TX | 1.0 | 1.5 | 892 | $1,700 | $1.91 | 45d | 1 | 0.12mi |
| 715 S Upper Broadway St Corpus Christi, TX | 1.0 | 1.0–1.5 | 772 | $1,650 | $2.14 | 22d | 2 | 0.13mi |
| 802 S Carancahua St Corpus Christi, TX | 2.0 | 1.0–2.0 | 869 | $1,260 | $1.45 | 14d | 68 | 0.18mi |
| 823 S Water St Corpus Christi, TX | 2.0 | 2.0 | 1243 | $2,000 | $1.61 | 14d | 1 | 0.21mi |
| 823 S Water St Unit 1A Corpus Christi, TX | 1.0 | 1.5 | 818 | $1,550 | $1.89 | 45d | 1 | 0.21mi |
| 522 Hancock Ave Corpus Christi, TX | 1.0–2.0 | 1.0–2.0 | 915 | $1,515 | $1.65 | 14d | 10 | 0.27mi |
| 522 Hancock Ave Unit 2-238 Corpus Christi, TX | 1.0 | 1.0 | 784 | $1,365 | $1.74 | 14d | 1 | 0.29mi |
| 522 Hancock Ave Unit 1-319 Corpus Christi, TX | 2.0 | 2.0 | 1133 | $1,625 | $1.43 | 22d | 1 | 0.29mi |
| 826 Hancock Ave Unit 3 Corpus Christi, TX | 1.0 | 1.0 | 700 | $800 | $1.14 | 22d | 1 | 0.38mi |
| 826 Hancock Ave Unit 1 Corpus Christi, TX | 1.0 | 1.0 | 700 | $850 | $1.21 | 22d | 1 | 0.38mi |
| 826 Hancock Ave Unit 2 Corpus Christi, TX | 2.0 | 1.0 | 1000 | $950 | $0.95 | 22d | 1 | 0.38mi |
| 1124 2nd St Corpus Christi, TX | 1.0 | 1.0 | 800 | $800 | $1.00 | 45d | 1 | 0.42mi |
| 1318 6th St Corpus Christi, TX | 2.0 | 1.0 | 900 | $900 | $1.00 | 14d | 1 | 0.63mi |
| 425 Schatzell St Unit C Corpus Christi, TX | 1.0 | 1.0 | 791 | $1,028 | $1.30 | 22d | 1 | 0.64mi |
| 425 Schatzell St Corpus Christi, TX | 1.0 | 1.0 | 825 | $1,358 | $1.65 | 45d | 1 | 0.64mi |
| 317 Peoples St Corpus Christi, TX | 2.0 | 1.0–2.0 | 768 | $1,438 | $1.87 | 14d | 1 | 0.68mi |
| 1124 Morgan Ave Unit 1268437P Corpus Christi, TX | 2.0 | 1.0 | 721 | $2,081 | $2.89 | 45d | 1 | 0.69mi |
| 1521 7th St Corpus Christi, TX | 2.0 | 2.0 | 850 | $1,250 | $1.47 | 14d | 1 | 0.79mi |
| 1433 12th St Corpus Christi, TX | 2.0 | 1.0 | 768 | $1,050 | $1.37 | 45d | 1 | 0.87mi |
| 1802 Morgan Ave Unit 1802 Corpus Christi, TX | 2.0 | 1.0 | 850 | $1,250 | $1.47 | 22d | 1 | 1.00mi |
| 206 Spruce St Corpus Christi, TX | 1.0 | 1.0 | 835 | $900 | $1.08 | 14d | 1 | 1.00mi |
| 1634 14th St Corpus Christi, TX | 2.0 | 1.5 | 980 | $1,090 | $1.11 | 45d | 1 | 1.10mi |
| 1628 18th St Corpus Christi, TX | 2.0 | 1.0 | 1112 | $1,000 | $0.90 | 45d | 1 | 1.29mi |
| 2333 Riggan St Corpus Christi, TX | 2.0 | 1.0 | 856 | $1,250 | $1.46 | 45d | 1 | 1.34mi |
| 330 Texas Ave Corpus Christi, TX | 2.0 | 1.0 | 806 | $1,300 | $1.61 | 45d | 1 | 1.42mi |
| 443 Indiana Ave Corpus Christi, TX | 2.0 | 1.0 | 968 | $1,650 | $1.70 | 45d | 1 | 1.46mi |
| 332 Rosebud Ave Corpus Christi, TX | 2.0 | 1.0 | 942 | $1,150 | $1.22 | 22d | 1 | 1.47mi |
| 309 Rosebud Ave Unit D Corpus Christi, TX | 2.0 | 1.0 | 882 | $1,100 | $1.25 | 22d | 1 | 1.48mi |
| 1114 25th St Corpus Christi, TX | 1.0–2.0 | 1.0 | 712 | $799 | $1.12 | 14d | 6 | 1.48mi |
| 2837 Santa Fe St Unit 2 Corpus Christi, TX | 2.0 | 1.0 | 1030 | $1,300 | $1.26 | 14d | 1 | 1.50mi |
HOA detail
- Monthly dues
- $542 · $6,504/yr
- Likely covers
- waterpoolsecurity
Listing history 30 events
-
2026-06-21days on market $114,000 Active 137 DOM
-
2026-06-18days on market $114,000 Active 134 DOM
-
2026-06-17days on market $114,000 Active 133 DOM
-
2026-06-16days on market $114,000 Active 132 DOM
-
2026-06-15days on market $114,000 Active 131 DOM
-
2026-06-14days on market $114,000 Active 129 DOM
-
2026-06-10days on market $114,000 Active 126 DOM
-
2026-06-09days on market $114,000 Active 125 DOM
-
2026-06-08days on market $114,000 Active 124 DOM
-
2026-06-07days on market $114,000 Active 123 DOM
-
2026-06-05days on market $114,000 Active 120 DOM
-
2026-06-03days on market $114,000 Active 119 DOM
-
2026-06-02days on market $114,000 Active 118 DOM
-
2026-06-01days on market $114,000 Active 117 DOM
-
2026-05-31days on market $114,000 Active 116 DOM
-
2026-05-30days on market $114,000 Active 115 DOM
-
2026-03-08price $114,000 700-char remark
Show marketing remark (700 chars)
Located on the second floor (unit 204) of the contemporary condo building, La Mer which is situated on bluff with waterviews of beautiful Corpus Christi Bay. Short walk to public beach, city parks, marina, seawall and downtown. Private balcony with views. Convenient access to large pool with BBQ area. Attached parking garage with one parking space and storage room. Main entrance locked for security. Building has laundry room for owners. Quick access to Shoreline Dr, Ocean Drive, I37, Crosstown expressway, hospitals, tourist attractions and popular local restaurants (walking distance). Short term rentals allowed by HOA. Enjoy condo living with sunrises over the bay! Furnace replaced Jan 2025.
-
2026-02-03$129,900 Active 700-char remark
Show marketing remark (700 chars)
Located on the second floor (unit 204) of the contemporary condo building, La Mer which is situated on bluff with waterviews of beautiful Corpus Christi Bay. Short walk to public beach, city parks, marina, seawall and downtown. Private balcony with views. Convenient access to large pool with BBQ area. Attached parking garage with one parking space and storage room. Main entrance locked for security. Building has laundry room for owners. Quick access to Shoreline Dr, Ocean Drive, I37, Crosstown expressway, hospitals, tourist attractions and popular local restaurants (walking distance). Short term rentals allowed by HOA. Enjoy condo living with sunrises over the bay! Furnace replaced Jan 2025.
-
2025-12-06price $129,900
-
2025-08-28price $135,000
-
2025-05-22price $142,950
-
2024-11-22$145,000 Active
-
2017-03-29soldstatus
-
2016-10-26historical
-
2016-07-22price $86,900
-
2016-01-19$89,900 Active
-
2004-08-31soldstatus
-
1999-02-03soldstatus $60,000
-
1997-05-01$63,500
-
1995-09-22$66,500
ⓘ Source: listings_history table (triggers on properties + properties_extension) + one-shot
backfill from property_details.listing_events for pre-trigger history.
Tax reassessment forecast TX · Resets to sale price
- Current annual tax
- $3,857 · $321/mo
- Projected year-2 tax
- $3,857 · $321/mo
- Expected delta
- $0/yr ($0/mo · 0.0%)
ⓘ Screening estimate from a state-policy table — verify with the county assessor before closing.
Nearby sold comps map
Loading sold comps map…
Walkable amenities ~0.75 mi
Loading nearby amenities…
Taxation est. · year 1
- Rental income
- $15,760
- − Mortgage interest
- −$6,386
- − Property taxes
- −$3,857
- − Insurance
- −$570
- − Repairs & maintenance
- −$1,261
- − Management
- −$1,261
- − HOA
- −$6,504
- − Depreciation
- −$3,316
- Taxable loss
- −$7,395
- Est. tax savings @ 24.0%
- +$1,775
- After-tax cash flow
- $-3,880/yr
For passive investors: Depreciation is non-cash, so a rental often shows a tax loss while cash-flowing — sheltering income. Rental losses are passive: they offset passive income freely, and up to $25,000/yr can offset ordinary (W-2) income if you actively participate and your MAGI is under $100k (phasing out to $0 by $150k); unused losses carry forward. On sale, claimed depreciation is recaptured at up to 25%, and gains may owe capital-gains tax (a 1031 exchange can defer both). Figures are a year-1 estimate at your 24.0% rate — not tax advice; consult a CPA.
Schools (NCES district)
- District
- Corpus Christi ISD
- NCES district ID
- 4815270
- Math proficiency
- 31% ▼ -18.00%
- Reading proficiency
- 35% ▼ -7.00%
- Median HH income
- $45,672
- Composite
- 28.27/100
- National rank
- #6793
- State rank
- #562 of 826 in TX
Livability — Corpus Christi
- Score
- 78/100
- State rank
- #66
- US rank
- #2404
Category grades
Schools grade is shown separately in the Schools card above.
Census & demographics
- Census place
- Corpus Christi, TX
- County
- Nueces County · 296,836 people
- City population
- 296,836
- Metro
- Corpus Christi, TX
- Population (ZIP)
- 4,344
- Household income
- $40,841
- Rent vs Own
- Severe rent burden
- 336.0
Population outlook (Nueces County) Hauer SSP2
- Today (2025)
- 418,037 people
- By 2030
- 447,123 · +7.0%
- By 2040
- 505,911 · +21.0%
- By 2050
- 567,522 · +35.8%
- By 2075
- 729,686 · +74.6%
- By 2100
- 847,087 · +102.6%
Race, ethnicity, and origin ACS 2023
- Neighborhood character
- Diverse neighborhood (Simpson 0.62)
- Race & ethnicity
- Hispanic / Latino 46% White 38% Two or more races 27% Black 13% Native American 2%
- Hispanic origin (detail)
- Mexican 43%
- Common ancestry
- Slovak 2% Portuguese 1% Lithuanian 1%
- Foreign-born
- 7% · Canada, South Korea
- Languages at home
- 71% English-only · Spanish 27% French/Haitian/Cajun 1%
Political lean MEDSL · Nueces
- 2024 margin
- R (+11.5) · D 43.8% · R 55.3%
- 2008→2024 swing
- -7.1pp toward R · 2008: -4.4pp · 2024: -11.5pp
- All cycles
- 2024: R+11.5 2020: R+2.9 2016: R+1.5 2012: R+3.2 2008: R+4.4
Not yet ingested
- Civics
- —
Market trends
- HPI YoY
- ▲ 3.37%
- Current HPI
- 92.634
- Rent YoY
- ▲ 1.63%
- Metro
- Corpus Christi, TX
- State GDP YoY
- ▲ 3.95%
- F500 in state
- 110
Industry mix (Fortune 500 HQ in TX)
| Industry | F500 HQs | Revenue |
|---|---|---|
| Energy | 16 | $1,198B |
|
||
| Technology | 5 | $198B |
|
||
| Engineering / Construction | 4 | $72B |
|
||
| Energy Services | 3 | $60B |
|
||
| Utilities | 3 | $41B |
|
||
| Healthcare | 2 | $330B |
|
||
Price history
+71.4% since first listed14 events — show timeline
- 2026-03-08 Price Changed $114,000 CBMLS
- 2026-02-03 Listed $129,900 CBMLS
- 2025-12-06 Price Changed $129,900 CBMLS
- 2025-08-28 Price Changed $135,000 CBMLS
- 2025-05-22 Price Changed $142,950 CBMLS
- 2024-11-22 Listed $145,000 CBMLS
- 2017-03-29 Sold (Public Records) — Public Records
- 2016-10-26 Delisted — CBMLS
- 2016-07-22 Price Changed $86,900 CBMLS
- 2016-01-19 Listed $89,900 CBMLS
- 2004-08-31 Sold (Public Records) — Public Records
- 1999-02-03 Sold (Public Records) $60,000 Public Records
- 1997-05-01 Listed $63,500 CBMLS
- 1995-09-22 Listed $66,500 CBMLS
Property tax history
+4.9%/yrLatest (2025): $3,857 · -0.7% YoY. Source: county tax records.
Cash-flow waterfall
monthlySold comps — $/sqft
last 12 mo · ≤1 miLoading sold comps…