22707 Watersedge Blvd #57 · Land O' Lakes, FL
Flood risk 1/10 · Minimal
- FEMA flood zone
- X (unshaded)
- Chance of flooding over 30 yrs
- 0.0%
- Est. flood insurance / yr
- $507 – $1,088
Fire risk 4/10 · Minor
- Est. fire insurance / yr
- $947 – $1,759
Heat risk 10/10 · Severe
- Hot days now (above 109°F)
- 7 days/yr
- Hot days in 30 yrs
- 27 days/yr
Wind risk 9/10 · Severe
- Chance of severe wind over 30 yrs
- 99.0%
Air-quality risk 2/10 · Minimal
- Unhealthy air days now
- 2 days/yr
- Unhealthy air days in 30 yrs
- 2 days/yr
Risk factors via First Street. Map © Google.
Why this score? — see what drove the C+ grade
The composite is a weighted blend of 9 inputs, each scored 0–100. Each bar is that input's sub-score; the figure is the points it added to the 100-point composite (weight × sub-score).
- Cash flow +22.0/30.0
- ARV discount +13.4/15.0
- 1% rule +8.2/10.0
- DSCR +7.0/10.0
- Schools +4.3/10.0
- Rent growth +2.7/5.0
- Livability +2.5/5.0
- Condition / age +2.5/5.0
- Appreciation +0.0/10.0
$147,900
🖨 Deal sheet 📄 Offer letter ✓ Due diligence
Listing remarks MLS
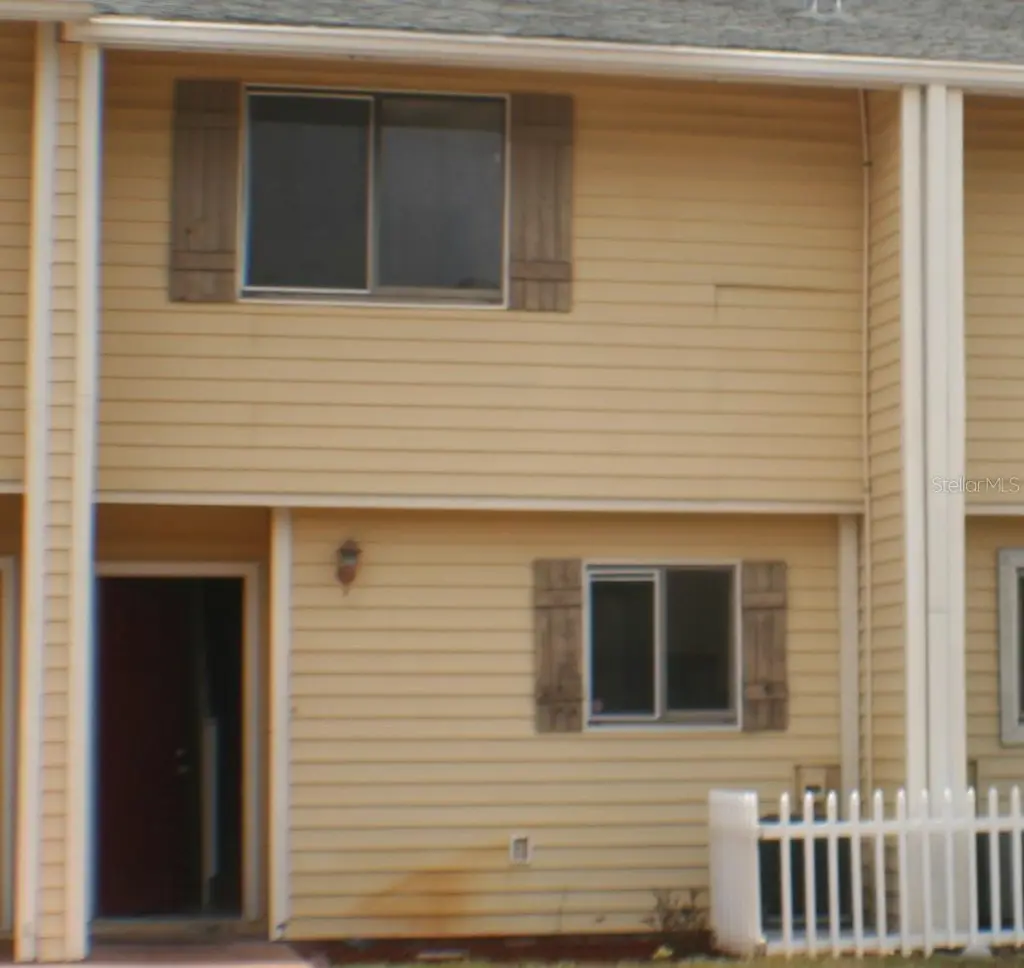
"Short Sale" 2 Bedroom, 1.5 Bath townhouse. Fenced in patio area. Great investment property. * This short sale is being negotiated by an experienced law firm to expedite the process. * Please see attachments.
Key facts
- Fenced patio
- Remodeled
- Upstairs rear deck
Tags
Property features AI
Finance
- Other: No home warranty; No lease restrictions indicated
- Financial info: Total monthly fees $325; Total annual fees $3,900
- HOA & community: Monthly HOA fee $325 (includes pool, recreational facilities, trash, water); Association name: Management and Associates; Community pool; Pets allowed (cats and dogs) up to 55 lbs
Exterior
- Utilities: Private water source; Public sewer; Cable available; Electricity connected; Sewer connected; Water connected
- Home design: Townhouse; Residential property; Two levels; Faces north; Condo land included
- Construction: Frame construction; Shingle roof; Slab foundation; Built footprint consistent with 1,032 square feet living area
- Exterior features: Balcony; Asphalt road access
Interior
- Kitchen: Dishwasher; Range; Microwave; Refrigerator
- Bedrooms: 2 bedrooms
- Flooring: Carpet; Ceramic tile; Laminate
- Bathrooms: 1 full bathroom; 1 half bathroom
- Heating & cooling: Heat pump heating; Central air conditioning
- Interior features: Living room and dining room combo; Thermostat
- Laundry & utility: Inside laundry in a laundry closet; Washer; Dryer
Neighborhood map
What this means for you Summary
Snapshot
- This is a 2-bed/2.0-bath townhouse listed at $148k.
Deal economics
- At list price, monthly cash flow is $235 ($3k/yr) — positive.
- The deal already cash-flows at list — no discount required.
- Meets the 1% rule at list price ($2k rent vs $148k).
- Cap rate 8.2% vs local median 3.7% in Land O' Lakes — top-decile yield for the area; either an underpriced asset or a hidden risk that comps aren't pricing in. Stress-test before assuming the spread holds.
Location & tenants
- Location reads: area grade C — affects rentability + tenant quality, not the cash-flow math above.
- Pasco (suburban): math 50% / reading 52% proficiency, ranked #32 of 73 in FL (top 44%) — acceptable for families but not a draw, mixed tenant base, ~2y average lease.
- Zoned schools: Pine View Elementary School (math 54% / reading 60%, grade C+, #781 of 2,144 statewide, top 38%, 573 students, 40% FRL); Pasco High School (math 40% / reading 40%, grade F, #296 of 667 statewide, top 45%, 1,639 students, 66% FRL) — zoned schools at 53% FRL track the district average.
- Market conditions: Rents flat; 173 active listings in the ZIP; 10 comparable units currently listed for rent nearby; rentals at typical pace (median 25d on market — plan ~3-4 weeks tenant-placement turnaround); solid renter incomes; 6,765 units permitted in Pasco County in 2024 (1,250 in 5+ unit buildings).
Forward outlook
- Local home prices are declining (-3.0%/yr); year-one equity from $1k of loan paydown is wiped out by about $4k of value loss. Plan a longer hold.
- Pasco County population projected at +29% by 2050 — long-run rental-demand tailwind backs the buy-and-hold thesis.
Negotiation context
- Only 13 days on market — expect competitive offers; lowballing is unlikely to land.
- 7 sale attempts since 19y ago with the ask held roughly flat each time — persistent listings suggest the price (not the market) is what's stuck; bring a comps-based counter.
- Current owner paid $16k; list at $148k implies a 824% gain — meaningful room to come down on a strong offer.
Risks & watch-outs
- Climate carrying-cost: severe wind risk, 99% chance of damaging wind over 30y; extreme-heat days projected 7→27/yr by 2055 (HVAC capex compounding) — expect insurance premiums to compound above CPI over the hold.
Questions for the listing agent
- What does the HOA fee cover, when was the last increase, and are there any pending special assessments or reserve-fund shortfalls?
- Is there a deadline driving the sale (1031 exchange, divorce, estate, relocation)? That informs how much negotiation room exists.
- What's the average days-on-market for RENTAL listings here right now (not sales)? A rising rental-DOM trend means longer vacancies and softer asking-rent achievability than the comps imply.
- What's the recent tenant-quality profile in this submarket — average credit score on applications, eviction rate, late-payment / NSF rate, and stable-employment percentage? A property-management company in the area should have these aggregated.
- How much new for-sale + rental construction is in the pipeline within 1–3 miles? Heavy new supply typically softens prices + rents 12–24 months out; constrained supply supports both.
Investment metrics
- 1% rule
- 1.32% ✓
- Cap rate
- 8.20%
- Cash-on-cash
- 6.81%
- DSCR
- 1.30
- GRM
- 6.3
CMA / ARV
- ARV (on-the-fly)
- $170,280
- Comps found
- 10
Show comp detail 10 sales within ~0.75 mi
| Address | Dist | Beds/Ba | Sqft | Sold | Price | $/sf | Match |
|---|---|---|---|---|---|---|---|
| 22630 Gage Loop #10 | 0.07mi | 2/1.5 | 1,032 (0%) | 2mo | $138,250 | $134 | 93 |
| 22706 Gage Loop #31 | 0.03mi | 2/2.0 | 1,032 (0%) | 6mo | $152,000 | $147 | 93 |
| 22701 Watersedge Blvd #14 | 0.04mi | 2/1.5 | 1,032 (0%) | 5mo | $147,900 | $143 | 92 |
| 22706 Gage Loop #34 | 0.03mi | 2/2.0 | 1,032 (0%) | 17mo | $147,000 | $142 | 84 |
| 22604 Watersedge Blvd #153 | 0.13mi | 2/1.5 | 1,032 (0%) | 13mo | $170,000 | $165 | 81 |
| 22706 Gage Loop #36 | 0.03mi | 2/1.5 | 1,032 (0%) | 19mo | $157,000 | $152 | 81 |
| 22604 Watersedge Blvd #155 | 0.13mi | 2/1.5 | 1,032 (0%) | 14mo | $200,000 | $194 | 80 |
| 4401 Dylan Loop #168 | 0.16mi | 2/1.5 | 1,032 (0%) | 14mo | $195,999 | $190 | 79 |
| 4427 Dylan Loop #181 | 0.21mi | 2/1.5 | 1,032 (0%) | 18mo | $191,000 | $185 | 74 |
| 4427 Dylan Loop #186 | 0.21mi | 2/1.5 | 1,032 (0%) | 24mo | $184,900 | $179 | 68 |
Match score weights: distance 35% · size 25% · config 20% · recency 20%. Top-matched comps best support the ARV.
Projected returns pro-forma
-3.0% appreciation · 0.87% rent growth · sell at horizon
- IRR
- -8.7%
- Equity multiple
- 0.69×
- Total profit
- $-12,879
- Equity at exit
- $22,052
- IRR
- -2.9%
- Equity multiple
- 0.83×
- Total profit
- $-7,204
- Equity at exit
- $12,788
Cash invested: $41,412 (down + closing). Projections, not guarantees.
Landlord ↔ Tenant lean methodology
- Overall (STATE)
- 87 Strongly Landlord-Friendly
- State Florida
- 87 Strongly Landlord-Friendly · R+3
- County
- — inherits STATE
- City
- — inherits STATE
ZIP-level market 34639
- Home prices YoY
- -21.9%
- Rents YoY
- 0.9%
- Active inventory
- 173
- Price-to-rent
- 6.3×
Monthly cashflow live
- Estimated rent
- $1,952 high interval (Pro) →
- Mortgage (P&I)
- −$776
- Tax from tax record
- −$145 /mo · $1,737/yr
- Insurance
- −$62
- HOA
- −$325
- Vacancy / Maint / Mgmt
- −$410
- Net cashflow
- $235
Break-even live
UW: 25.0% down · 7.5% · 30yr · 1.5% tax · 5.0% vac · 8.0% maint · 8.0% mgmt
Financing live
Cash to close
- Down payment
- $36,975
- Closing costs
- $4,437
- Reserves months
- —
- Total cash needed
- —
Loan-product check · same deal, 3 products live
Conventional
25% down · 7.5% · 30yr
- Down + closing
- —
- Monthly P&I
- —
- Monthly cashflow
- —
- DSCR
- —
- Eligible?
- —
Personal DTI + credit; lowest rate.
DSCR
20% down · 8.5% · 30yr
- Down + closing
- —
- Monthly P&I
- —
- Monthly cashflow
- —
- DSCR
- —
- Eligible?
- —
No personal income docs; deal must DSCR.
Hard money
10% down · 12.0% · 12mo
- Down + closing
- —
- Monthly P&I
- —
- Monthly cashflow
- —
- DSCR
- —
- Eligible?
- —
Short-term bridge; refi at stabilization.
Rent comps 10 comps
| Address | Beds | Baths | Sqft | Rent | $/sqft | DOM | Units | Dist |
|---|---|---|---|---|---|---|---|---|
| 22630 Gage Loop #7 Land O Lakes, FL | 2.0 | 1.5 | 1040 | $1,600 | $1.54 | 24d | 1 | 0.08mi |
| 4352 Banjo Lake Rd Land O Lakes, FL | 3.0 | 2.5 | 1380 | $2,400 | $1.74 | 24d | 1 | 0.15mi |
| 4401 Longshore Dr Land O Lakes, FL | 3.0 | 2.0 | 1021 | $1,850 | $1.81 | 24d | 1 | 0.34mi |
| 23117 Dover Dr Land O Lakes, FL | 1.0 | 1.0 | 1034 | $797 | $0.77 | 24d | 1 | 0.46mi |
| 23223 Club Villas Dr Unit 23223 Land O' Lakes, FL | 2.0 | 2.0 | 1192 | $1,800 | $1.51 | 15d | 1 | 0.59mi |
| 4201 Parkway Blvd Land O Lakes, FL | 3.0 | 2.0 | 1500 | $2,200 | $1.47 | 24d | 1 | 0.70mi |
| 21915 Bell Lake Rd Unit 2 Land O' Lakes, FL | 2.0 | 1.0 | 1000 | $2,150 | $2.15 | 3d | 1 | 0.93mi |
| 3819 Biscay Pl Land O Lakes, FL | 3.0 | 2.0 | 1184 | $1,995 | $1.68 | 12d | 1 | 1.27mi |
| 18781 Eden Ln Land O' Lakes, FL | 2.0–3.0 | 2.0–2.5 | 1231 | $2,495 | $2.03 | 5d | 1 | 1.34mi |
| 4934 Addessi Loop Land O' Lakes, FL | 1.0 | 1.0 | 713 | $1,950 | $2.73 | 5d | 1 | 1.40mi |
HOA detail
- Monthly dues
- $325 · $3,900/yr
Listing history 29 events
-
2026-06-18days on market $147,900 Active 13 DOM
-
2026-06-17days on market $147,900 Active 12 DOM
-
2026-06-16days on market $147,900 Active 11 DOM
-
2026-06-15price $147,900 Active 10 DOM
-
2026-06-15days on market $149,000 Active 10 DOM
-
2026-06-13statusdays on market $149,000 Active 8 DOM
-
2026-06-02remarks 604-char remark
-
2026-06-02status $149,000 Pending 6 DOM
-
2026-06-01days on market $149,000 Active 6 DOM
-
2026-05-31remarks 564-char remark
-
2026-05-31days on market $149,000 Active 5 DOM
-
2026-05-26$149,000 Active
-
2026-05-20historical
-
2026-05-18status Active
-
2026-05-04status Pending
-
2026-05-01status Active
-
2026-04-30historical
-
2026-01-28status Active
-
2026-01-13price $149,900
-
2025-11-20$159,900 Active
-
2015-03-26soldstatus $16,000
-
2015-02-27soldstatus $16,000 Sold 218-char remark
Show marketing remark (218 chars)
"Short Sale" 2 Bedroom, 1.5 Bath townhouse. Fenced in patio area. Great investment property. * This short sale is being negotiated by an experienced law firm to expedite the process. * Please see attachments.
-
2014-06-14status Pending 218-char remark
Show marketing remark (218 chars)
"Short Sale" 2 Bedroom, 1.5 Bath townhouse. Fenced in patio area. Great investment property. * This short sale is being negotiated by an experienced law firm to expedite the process. * Please see attachments.
-
2014-06-10historical 218-char remark
Show marketing remark (218 chars)
"Short Sale" 2 Bedroom, 1.5 Bath townhouse. Fenced in patio area. Great investment property. * This short sale is being negotiated by an experienced law firm to expedite the process. * Please see attachments.
-
2013-09-10$24,900 218-char remark
Show marketing remark (218 chars)
"Short Sale" 2 Bedroom, 1.5 Bath townhouse. Fenced in patio area. Great investment property. * This short sale is being negotiated by an experienced law firm to expedite the process. * Please see attachments.
-
2007-10-22soldstatus $120,000
-
2007-10-19soldstatus $120,000
-
2007-06-13$119,395
-
2006-06-01soldstatus $117,200
ⓘ Source: listings_history table (triggers on properties + properties_extension) + one-shot
backfill from property_details.listing_events for pre-trigger history.
Tax reassessment forecast FL · Resets to sale price
- Current annual tax
- $1,737 · $145/mo
- Projected year-2 tax
- $1,737 · $145/mo
- Expected delta
- $0/yr ($0/mo · 0.0%)
ⓘ Screening estimate from a state-policy table — verify with the county assessor before closing.
Climate risk First Street
- Flood 1/10 Low FEMA zone X (unshaded) · 0% chance over 30 yrs
- Wildfire 4/10 Moderate
- Heat 10/10 Extreme 7 d/yr ≥109°F today · 27 d/yr by 30 yrs out
- Wind 9/10 Extreme 99% chance of damaging wind over 30 yrs
- Air quality 2/10 Low 2 unhealthy d/yr today · 2 by 30 yrs out
Nearby sold comps map
Loading sold comps map…
Walkable amenities ~0.75 mi
Loading nearby amenities…
Taxation est. · year 1
- Rental income
- $23,425
- − Mortgage interest
- −$8,285
- − Property taxes
- −$1,737
- − Insurance
- −$740
- − Repairs & maintenance
- −$1,874
- − Management
- −$1,874
- − HOA
- −$3,900
- − Depreciation
- −$4,303
- Taxable income
- $713
- Est. tax owed @ 24.0%
- −$171
- After-tax cash flow
- $2,651/yr
For passive investors: Depreciation is non-cash, so a rental often shows a tax loss while cash-flowing — sheltering income. Rental losses are passive: they offset passive income freely, and up to $25,000/yr can offset ordinary (W-2) income if you actively participate and your MAGI is under $100k (phasing out to $0 by $150k); unused losses carry forward. On sale, claimed depreciation is recaptured at up to 25%, and gains may owe capital-gains tax (a 1031 exchange can defer both). Figures are a year-1 estimate at your 24.0% rate — not tax advice; consult a CPA.
Schools (NCES district)
- District
- Pasco
- NCES district ID
- 1201530
- Math proficiency
- 50% ▼ -10.00%
- Reading proficiency
- 52% ▼ -5.00%
- Median HH income
- $45,039
- Composite
- 43.14/100
- National rank
- #3074
- State rank
- #32 of 73 in FL
Livability — Land O' Lakes
No livability data for this city. (Only ~50 U.S. cities are tracked.)
Census & demographics
- Census place
- Land O' Lakes, FL
- County
- Pasco County · 524,098 people
- Metro
- Tampa-St. Petersburg-Clearwater, FL
- Population (ZIP)
- 30,831
- Household income
- $101,486
- Rent vs Own
- Severe rent burden
- 383.0
Population outlook (Pasco County) Hauer SSP2
- Today (2025)
- 570,045 people
- By 2030
- 605,844 · +6.3%
- By 2040
- 674,806 · +18.4%
- By 2050
- 736,022 · +29.1%
- By 2075
- 862,900 · +51.4%
- By 2100
- 906,364 · +59.0%
Race, ethnicity, and origin ACS 2023
- Neighborhood character
- Predominantly White (66%)
- Race & ethnicity
- White 66% Hispanic / Latino 20% Two or more races 11% Black 6% Asian 2%
- Hispanic origin (detail)
- Mexican 2% Puerto Rican 6% Cuban 4% Dominican 2%
- Common ancestry
- Romanian 4% Slovak 2% Lithuanian 2%
- Foreign-born
- 12% · Canada, Jamaica, Vietnam
- Languages at home
- 81% English-only · Spanish 12% Russian/Polish/Slavic 2% Arabic 1%
Political lean MEDSL · Pasco
- 2024 margin
- Strong R (+25.2) · D 36.9% · R 62.1% · Other 1.0%
- 2008→2024 swing
- -21.6pp toward R · 2008: -3.6pp · 2024: -25.2pp
- All cycles
- 2024: R+25.2 2020: R+20.1 2016: R+21.6 2012: R+6.7 2008: R+3.6
Not yet ingested
- Civics
- —
Market trends
- HPI YoY
- ▼ -78.35%
- Current HPI
- 280.2986
- Rent YoY
- ▲ 0.87%
- Metro
- Tampa-St. Petersburg-Clearwater, FL
- State GDP YoY
- ▲ 3.28%
- F500 in state
- 36
Industry mix (Fortune 500 HQ in FL)
| Industry | F500 HQs | Revenue |
|---|---|---|
| Industrial Technology | 2 | $29B |
|
||
| Insurance | 2 | $17B |
|
||
| Retail | 1 | $60B |
|
||
| Technology Distribution | 1 | $58B |
|
||
| Homebuilding | 1 | $35B |
|
||
| Technology Manufacturing | 1 | $35B |
|
||
Price history
+27.1% since first listed18 events — show timeline
- 2026-05-26 Listed $149,000 Stellar MLS as Distributed by MLS Grid
- 2026-05-20 Listing Removed — Stellar MLS as Distributed by MLS Grid
- 2026-05-18 Relisted — Stellar MLS as Distributed by MLS Grid
- 2026-05-04 Pending — Stellar MLS as Distributed by MLS Grid
- 2026-05-01 Relisted — Stellar MLS as Distributed by MLS Grid
- 2026-04-30 Listing Removed — Stellar MLS as Distributed by MLS Grid
- 2026-01-28 Relisted — Stellar MLS as Distributed by MLS Grid
- 2026-01-13 Price Changed $149,900 Stellar MLS as Distributed by MLS Grid
- 2025-11-20 Listed $159,900 Stellar MLS as Distributed by MLS Grid
- 2015-03-26 Sold (Public Records) $16,000 Public Records
- 2015-02-27 Sold (MLS) $16,000 Stellar MLS as Distributed by MLS Grid
- 2014-06-14 Pending — Stellar MLS as Distributed by MLS Grid
- 2014-06-10 Listing Removed — Stellar MLS as Distributed by MLS Grid
- 2013-09-10 Listed $24,900 Stellar MLS as Distributed by MLS Grid
- 2007-10-22 Sold (Public Records) $120,000 Public Records
- 2007-10-19 Sold (MLS) $120,000 Stellar MLS as Distributed by MLS Grid
- 2007-06-13 Listed $119,395 Stellar MLS as Distributed by MLS Grid
- 2006-06-01 Sold (Public Records) $117,200 Public Records
Property tax history
+25.1%/yrLatest (2025): $1,737 · -0.1% YoY. Source: county tax records.
Cash-flow waterfall
monthlySold comps — $/sqft
last 12 mo · ≤1 miLoading sold comps…