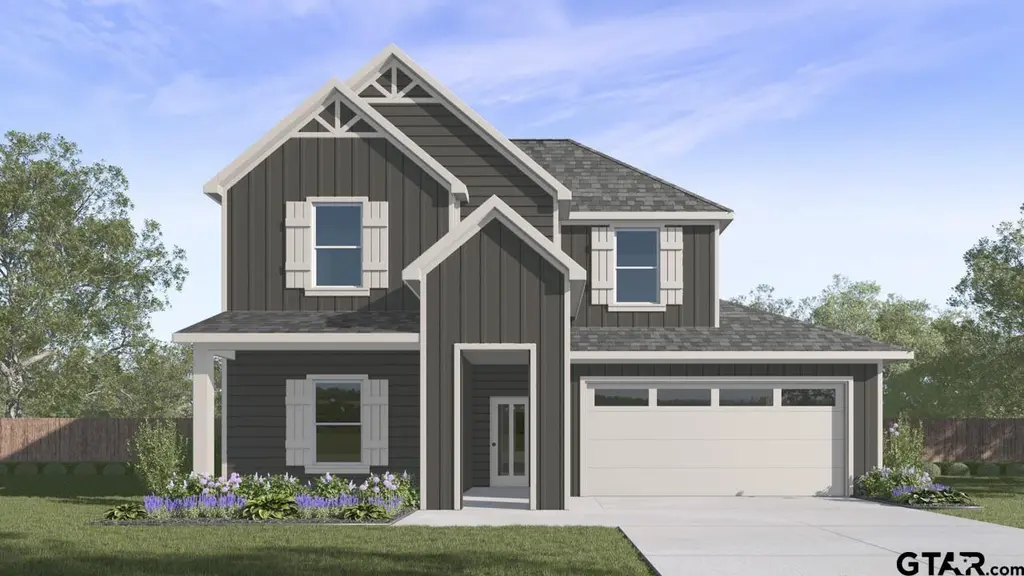
5024 Shumard Dr · Lindale, TX
Flood risk No data
- FEMA flood zone
- —
- Chance of flooding over 30 yrs
- —
- Est. flood insurance / yr
- —
Fire risk No data
- Est. fire insurance / yr
- —
Heat risk No data
- Hot days now (above threshold)
- —
- Hot days in 30 yrs
- —
Wind risk No data
- Chance of severe wind over 30 yrs
- —
Air-quality risk No data
- Unhealthy air days now
- —
- Unhealthy air days in 30 yrs
- —
Risk factors via First Street. Map © Google.
Why this score? — see what drove the D grade
The composite is a weighted blend of 9 inputs, each scored 0–100. Each bar is that input's sub-score; the figure is the points it added to the 100-point composite (weight × sub-score).
- Appreciation +8.4/10.0
- ARV discount +7.2/15.0
- Cash flow +7.1/30.0
- Schools +5.9/10.0
- Livability +4.0/5.0
- Rent growth +2.5/5.0
- Condition / age +2.5/5.0
- 1% rule +2.1/10.0
- DSCR +1.3/10.0
$316,490
🖨 Deal sheet (PDF) 📄 Offer letter ✓ Due diligence
Listing remarks MLS
Take a look at this beautiful new construction home. Situated in bustling Lindale TX, The Reserve at Timber Creek has excellent access to the Tyler and DFW metro areas and the ETX region. Come see what this community has to offer you and your family! Our homes are energy star rated and come with new construction warranties. All of our homes have quartz granite countertops, sod and landscaping, and sprinkler systems. Please call to ask about financing incentives!
Key facts
- Energy star rated
- Excellent access
- Sod and landscaping
Tags
Property features AI
Finance
- Other: Property listed by builder; Listing is active and for sale
- Financial info: Treat as clear loan type; No second mortgage indicated
- HOA & community: Mandatory HOA; Annual association fee of $550; HOA covers full use of facilities; HOA managed by Neighborhood Management
Exterior
- Parking: 2 covered parking spaces; Driveway; Attached 2-car garage (approx. 20' wide x 18' deep)
- Security: No accessibility features listed
- Utilities: City water; City sewer; Not in a municipal utility district
- Home design: Single-family residence; Residential property; One story; Builder listing (new construction); Year built 2026; Property not attached
- Construction: Built in 2026; No construction material or foundation details provided; No roof details provided
- Exterior features: Lot less than 0.5 acre; Subdivision: Reserve at Timber Creek; Directions available to property
Interior
- Kitchen: Dishwasher; Disposal; Electric oven; Microwave; Breakfast room adjacent to kitchen
- Bedrooms: 4 bedrooms (all on the main level)
- Flooring: No flooring details provided
- Bathrooms: 2 full bathrooms
- Heating & cooling: Natural gas heating; Electric cooling
- Interior features: High speed internet available; 7 total rooms; One-level floorplan
- Laundry & utility: No specific laundry details provided
Neighborhood map
What this means for you Summary
Snapshot
- This is a 4-bed/2.0-bath single-family listed at $316k.
Deal economics
- At list price, monthly cash flow is $-456 ($-5k/yr) — negative.
- To cash-flow at today's rent, offer at most $251k (20.8% below list).
- To meet the 1% rule (rent ≥ 1% of price), the offer needs to be $225k (28.9% below list).
- Recommended offer: $225k (28.9% below list) — sets the bar for 1% rule.
- Cap rate 4.6% vs local median 3.1% in Lindale — top-decile yield for the area; either an underpriced asset or a hidden risk that comps aren't pricing in. Stress-test before assuming the spread holds.
Location & tenants
- Location reads 79/100 on livability (#52 in TX, #2,100 nationally) — a middle-class / working-renter tenant base. Strengths: employment A+, cost of living A+, housing A+; Watch: amenities F, commute F.
- Lindale ISD (town): math 71% / reading 66% proficiency, ranked #20 of 826 in TX (top 2%) — acceptable for families but not a draw, mixed tenant base, ~2y average lease.
- Zoned schools: Velma Penny El (math 67% / reading 67%, grade B+, #199 of 4,322 statewide, top 5%, 541 students, 48% FRL); E J Moss Int (math 66% / reading 59%, grade B+, #128 of 1,662 statewide, top 8%, 981 students, 45% FRL); Lindale H S (math 79% / reading 75%, grade A-, #60 of 1,632 statewide, top 4%, 1,265 students, 38% FRL).
- Market conditions: 110 active listings in the ZIP; 1 comparable units currently listed for rent nearby; 595 units permitted in Smith County in 2024 (45 in 5+ unit buildings).
Forward outlook
- In year one you build about $23k of equity ($2k loan paydown + $21k appreciation (6.7% local appreciation)).
- Smith County population projected at +24% by 2050 — long-run rental-demand tailwind backs the buy-and-hold thesis.
- By year 2, paydown + projected appreciation supports a ~$38k cash-out refi (75% LTV) — recoverable capital for the next deal without selling this one.
Negotiation context
- Only 2 days on market — expect competitive offers; lowballing is unlikely to land.
- 2 sale attempts with the ask held roughly flat each time — persistent listings suggest the price (not the market) is what's stuck; bring a comps-based counter.
Questions for the listing agent
- What do current leases actually rent for vs. the listed asking? Can we see a recent rent roll and the last 12 months of T-12 income?
- What does the HOA fee cover, when was the last increase, and are there any pending special assessments or reserve-fund shortfalls?
- Is there a deadline driving the sale (1031 exchange, divorce, estate, relocation)? That informs how much negotiation room exists.
- The area grade is low — what's the realistic commute time and amenity access for the typical tenant pool here? Any planned neighborhood developments (good or bad) we should know about?
- What's the average days-on-market for RENTAL listings here right now (not sales)? A rising rental-DOM trend means longer vacancies and softer asking-rent achievability than the comps imply.
- What's the recent tenant-quality profile in this submarket — average credit score on applications, eviction rate, late-payment / NSF rate, and stable-employment percentage? A property-management company in the area should have these aggregated.
- How much new for-sale + rental construction is in the pipeline within 1–3 miles? Heavy new supply typically softens prices + rents 12–24 months out; constrained supply supports both.
Investment metrics
- 1% rule
- 0.71% ✗
- Cap rate
- 4.57%
- Cash-on-cash
- -6.17%
- DSCR
- 0.73
- GRM
- 11.7
CMA / ARV
- ARV (on-the-fly)
- $314,578
- Comps found
- 12
Show comp detail 12 sales within ~0.75 mi
| Address | Dist | Beds/Ba | Sqft | Sold | Price | $/sf | Match |
|---|---|---|---|---|---|---|---|
| 2005 Bobby Ashcraft Dr | 0.09mi | 4/2.0 | 1,738 (0%) | 2mo | $279,990 | $161 | 94 |
| 6013 Freedom Dr | 0.07mi | 4/2.0 | 1,607 (-8%) | 1mo | $267,660 | $167 | 83 |
| 2025 Bobby Ashcraft Dr | 0.10mi | 4/2.0 | 1,606 (-8%) | 1mo | $259,490 | $162 | 82 |
| 2049 Bobby Ashcraft Dr | 0.13mi | 4/2.0 | 1,607 (-8%) | 0mo | $256,490 | $160 | 81 |
| 16310 Crossing Cir | 0.44mi | 4/2.0 | 1,645 (-5%) | 5mo | $317,000 | $193 | 66 |
| 16513 Crossing Cir | 0.56mi | 3/2.0 (-1) | 1,700 (-2%) | 4mo | $307,700 | $181 | 62 |
| 16509 Crossing Cir | 0.56mi | 4/2.0 | 1,819 (+5%) | 8mo | $369,900 | $203 | 59 |
| 16609 Crossing Cir | 0.57mi | 4/2.0 | 1,865 (+7%) | 3mo | $349,687 | $187 | 59 |
| 16322 Crossing Cir | 0.47mi | 3/2.0 (-1) | 1,620 (-7%) | 10mo | $314,900 | $194 | 54 |
| 16426 Crossing Cir | 0.55mi | 4/2.5 | 1,906 (+10%) | 6mo | $369,900 | $194 | 51 |
| 15320 Country Acres Dr | 0.39mi | 3/2.0 (-1) | 1,976 (+14%) | 8mo | $309,900 | $157 | 48 |
| 15365 Spring Oaks Dr | 0.73mi | 4/2.5 | 1,901 (+9%) | 8mo | $345,000 | $181 | 42 |
Match score weights: distance 35% · size 25% · config 20% · recency 20%. Top-matched comps best support the ARV.
Projected returns pro-forma
6.72% appreciation · 3.0% rent growth · sell at horizon
- IRR
- 12.2%
- Equity multiple
- 1.86×
- Total profit
- $76,063
- Equity at exit
- $213,476
- IRR
- 12.8%
- Equity multiple
- 3.75×
- Total profit
- $243,585
- Equity at exit
- $400,323
Cash invested: $88,617 (down + closing). Projections, not guarantees.
Landlord ↔ Tenant lean methodology
- Overall (STATE)
- 87 Strongly Landlord-Friendly
- State Texas
- 87 Strongly Landlord-Friendly · R+5
- County
- — inherits STATE
- City
- — inherits STATE
ZIP-level market 75706
- Home prices YoY
- 2.9%
- Active inventory
- 110
- Price-to-rent
- 11.7×
Monthly cashflow live
- Estimated rent
- $2,250 medium interval (Pro) →
- Mortgage (P&I)
- −$1,660
- Tax est. 1.5%
- −$396 /mo · $4,747/yr
- Insurance
- −$132
- HOA
- −$46
- Vacancy / Maint / Mgmt
- −$472
- Net cashflow
- $-456
Break-even live
Sensitivity live
| Price | -10% $-237 | -5% $-346 | +0% $-456 | +5% $-565 | +10% $-674 |
|---|---|---|---|---|---|
| Rent | -10% $-633 | -5% $-545 | +0% $-456 | +5% $-367 | +10% $-278 |
| Rate | -1.0pp $-296 | -0.5pp $-375 | base $-456 | +0.5pp $-538 | +1.0pp $-621 |
UW: 25.0% down · 7.5% · 30yr · 1.5% tax · 5.0% vac · 8.0% maint · 8.0% mgmt
Financing live
Cash to close
- Down payment
- $79,122
- Closing costs
- $9,495
- Reserves months
- —
- Total cash needed
- —
Loan-product check · same deal, 3 products live
Conventional
25% down · 7.5% · 30yr
- Down + closing
- —
- Monthly P&I
- —
- Monthly cashflow
- —
- DSCR
- —
- Eligible?
- —
Personal DTI + credit; lowest rate.
DSCR
20% down · 8.5% · 30yr
- Down + closing
- —
- Monthly P&I
- —
- Monthly cashflow
- —
- DSCR
- —
- Eligible?
- —
No personal income docs; deal must DSCR.
Hard money
10% down · 12.0% · 12mo
- Down + closing
- —
- Monthly P&I
- —
- Monthly cashflow
- —
- DSCR
- —
- Eligible?
- —
Short-term bridge; refi at stabilization.
Rent comps 1 comps
| Address | Beds | Baths | Sqft | Rent | $/sqft | DOM | Units | Dist |
|---|---|---|---|---|---|---|---|---|
| 15614 Garden Ln Lindale, TX | 3.0 | 2.0 | 1607 | $2,250 | $1.40 | 45d | 1 | 0.72mi |
HOA detail
- Monthly dues
- $46 · $552/yr
- Likely covers
- landscaping
Listing history 2 events
-
2026-06-22remarks 470-char remark
-
2026-06-22$316,490 Active 2 DOM
ⓘ Source: listings_history table (triggers on properties + properties_extension) + one-shot
backfill from property_details.listing_events for pre-trigger history.
Nearby sold comps map
Loading sold comps map…
Walkable amenities ~0.75 mi
Loading nearby amenities…
Taxation est. · year 1
- Rental income
- $27,000
- − Mortgage interest
- −$17,728
- − Property taxes
- −$4,747
- − Insurance
- −$1,582
- − Repairs & maintenance
- −$2,160
- − Management
- −$2,160
- − HOA
- −$552
- − Depreciation
- −$9,207
- Taxable loss
- −$11,137
- Est. tax savings @ 24.0%
- +$2,673
- After-tax cash flow
- $-2,795/yr
For passive investors: Depreciation is non-cash, so a rental often shows a tax loss while cash-flowing — sheltering income. Rental losses are passive: they offset passive income freely, and up to $25,000/yr can offset ordinary (W-2) income if you actively participate and your MAGI is under $100k (phasing out to $0 by $150k); unused losses carry forward. On sale, claimed depreciation is recaptured at up to 25%, and gains may owe capital-gains tax (a 1031 exchange can defer both). Figures are a year-1 estimate at your 24.0% rate — not tax advice; consult a CPA.
Schools (NCES district)
- District
- Lindale ISD
- NCES district ID
- 4827510
- Math proficiency
- 71% ▼ -2.00%
- Reading proficiency
- 66% ▲ 4.00%
- Median HH income
- $57,325
- Composite
- 58.85/100
- National rank
- #974
- State rank
- #20 of 826 in TX
Livability — Lindale
- Score
- 79/100
- State rank
- #52
- US rank
- #2100
Category grades
Schools grade is shown separately in the Schools card above.
Census & demographics
- City population
- 21,238
- Population (ZIP)
- 10,975
Population outlook (Smith County) Hauer SSP2
- Today (2025)
- 248,890 people
- By 2030
- 261,665 · +5.1%
- By 2040
- 286,114 · +15.0%
- By 2050
- 308,006 · +23.8%
- By 2075
- 354,171 · +42.3%
- By 2100
- 372,828 · +49.8%
Race, ethnicity, and origin ACS 2023
- Neighborhood character
- Diverse neighborhood (Simpson 0.63)
- Race & ethnicity
- White 43% Hispanic / Latino 40% Black 14% Two or more races 13%
- Hispanic origin (detail)
- Mexican 38%
- Common ancestry
- Slovak 3% Lithuanian 2% Serbian 1%
- Foreign-born
- 13% · Canada
- Languages at home
- 68% English-only · Spanish 31% Tagalog/Filipino 1%
Political lean MEDSL · Smith
- 2024 margin
- Solid R (+45.1) · D 27.0% · R 72.1%
- 2008→2024 swing
- -5.6pp toward R · 2008: -39.5pp · 2024: -45.1pp
- All cycles
- 2024: R+45.1 2020: R+39.4 2016: R+43.9 2012: R+46.9 2008: R+39.5
Not yet ingested
- Civics
- —
Market trends
- HPI YoY
- ▲ 6.72%
- Current HPI
- 234.9412
- Rent YoY
- —
- Metro
- —
- State GDP YoY
- ▲ 3.95%
- F500 in state
- 110
Industry mix (Fortune 500 HQ in TX)
| Industry | F500 HQs | Revenue |
|---|---|---|
| Energy | 16 | $1,198B |
|
||
| Technology | 5 | $198B |
|
||
| Engineering / Construction | 4 | $72B |
|
||
| Energy Services | 3 | $60B |
|
||
| Utilities | 3 | $41B |
|
||
| Healthcare | 2 | $330B |
|
||
Price history
+23.4% since first listed3 events — show timeline
- 2026-06-19 Price Changed $316,490 GTAR
- 2026-06-19 Listed $316,490 NTREIS
- 2026-06-19 Listed $256,490 GTAR
Cash-flow waterfall
monthlySold comps — $/sqft
last 12 mo · ≤1 miLoading sold comps…