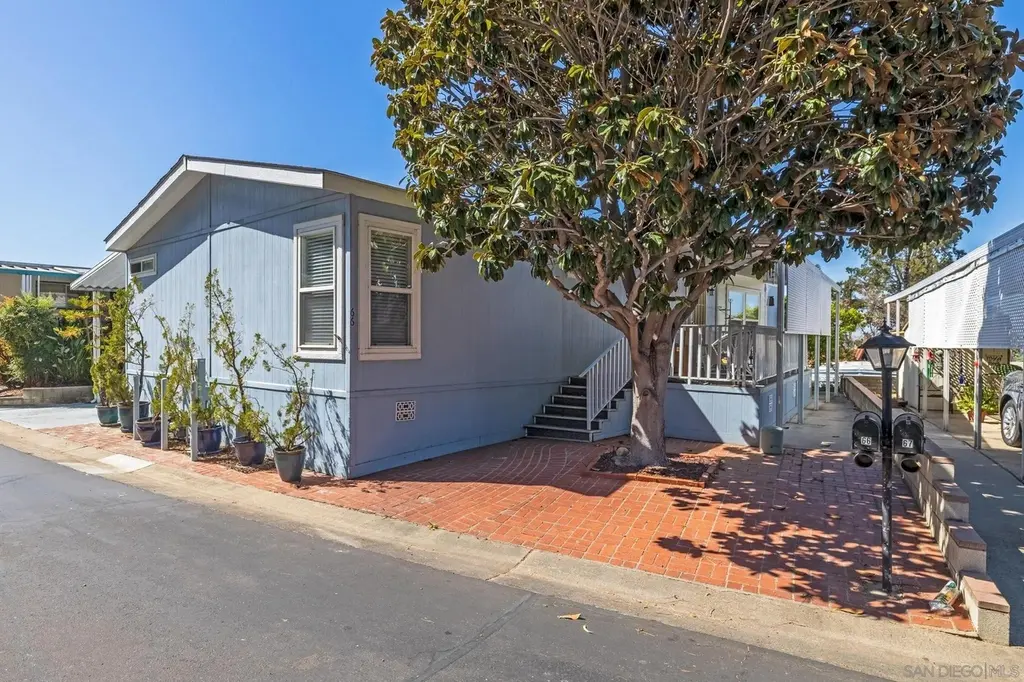
1440 S Orange Ave #66 · El Cajon, CA
Flood risk 1/10 · Minimal
- FEMA flood zone
- X (unshaded)
- Chance of flooding over 30 yrs
- 0.0%
- Est. flood insurance / yr
- $507 – $1,088
Fire risk 1/10 · Minimal
- Est. fire insurance / yr
- $659 – $1,223
Heat risk 5/10 · Moderate
- Hot days now (above 99°F)
- 6 days/yr
- Hot days in 30 yrs
- 18 days/yr
Wind risk 1/10 · Minimal
- Chance of severe wind over 30 yrs
- —
Air-quality risk 3/10 · Minor
- Unhealthy air days now
- 4 days/yr
- Unhealthy air days in 30 yrs
- 4 days/yr
Risk factors via First Street. Map © Google.
Why this score? — see what drove the C+ grade
The composite is a weighted blend of 9 inputs, each scored 0–100. Each bar is that input's sub-score; the figure is the points it added to the 100-point composite (weight × sub-score).
- Cash flow +30.0/30.0
- DSCR +10.0/10.0
- 1% rule +8.5/10.0
- Schools +4.0/10.0
- Livability +3.5/5.0
- Rent growth +3.0/5.0
- Condition / age +2.5/5.0
- ARV discount +0.0/15.0
- Appreciation +0.0/10.0
$195,000
🖨 Deal sheet 📄 Offer letter ✓ Due diligence
Listing remarks MLS
After entering,take the first left and this newer, lovely home is on the right! Original 3 bedrooms and 2 baths with the 3rd bedroom to be used as a study, retreat, office or workout room and is just a step off the master bdrm. Enjoy the wonderful park location close to plenty of visitor parking. Lovely view of mountains and hills and the park-like setting right across the street. The oversized dining area boasts beautiful custom built-in shelving. There is skylight in light, bright and efficient kitchen.
Key facts
- Large windows
- Ample cabinetry
- Natural light
Tags
Property features AI
Finance
- HOA & community: Located in a senior community (Villa Novia); Common-interest lot
Exterior
- Parking: 2 parking spaces
- Utilities: Public water; Sewer connected
- Home design: Manufactured home (residential); Single-story
- Construction: Shingle roof
- Exterior features: Community pool; Shed(s)
Interior
- Kitchen: Dishwasher; Disposal; Gas Range
- Bedrooms: 3 possible bedrooms
- Bathrooms: 2 full bathrooms
- Heating & cooling: Central air conditioning; Forced air heating (natural gas)
- Interior features: Dishwasher; Disposal; Gas Range
- Laundry & utility: Washer; Dryer
Neighborhood map
What this means for you Summary
Snapshot
- This is a 2-bed/2.0-bath manufactured listed at $195k.
Deal economics
- At list price, monthly cash flow is $817 ($10k/yr) — positive.
- The deal already cash-flows at list — no discount required.
- Meets the 1% rule at list price ($3k rent vs $195k).
- Recommended offer: $183k (6.0% below list) — sets the bar for market timing.
- Cap rate 11.3% vs local median 2.4% in El Cajon — top-decile yield for the area; either an underpriced asset or a hidden risk that comps aren't pricing in. Stress-test before assuming the spread holds.
Location & tenants
- Location reads 70/100 on livability (#230 in CA) — a middle-class / working-renter tenant base. Strengths: amenities A+, commute A+; Watch: health & safety C-, crime D+, cost of living F.
- Grossmont Union High (suburban): math 31% / reading 60% proficiency, ranked #173 of 517 in CA (top 34%) — families likely to look elsewhere, expect single-tenant / working-renter base with shorter leases; only 17% free/reduced lunch — higher-income household profile.
- Market conditions: Rents rising (+2.2%/yr); 158 active listings in the ZIP; 29 comparable units currently listed for rent nearby; rentals leasing fast (median 2d on market — plan ~1-2 weeks tenant-placement turnaround); solid renter incomes; 11,759 units permitted in San Diego County in 2024 (7,244 in 5+ unit buildings).
- This rent runs 42% of the median local income ($76k/yr) — at the standard rent-burdened threshold; future hikes will face affordability resistance.
Forward outlook
- Local home prices are declining (-3.0%/yr); year-one equity from $1k of loan paydown is wiped out by about $6k of value loss. Plan a longer hold.
- San Diego County population projected at +20% by 2050 — long-run rental-demand tailwind backs the buy-and-hold thesis.
- At projected returns (-3.0% appreciation + 2.2% rent growth), your $55k cash investment doubles in ~8 years — after that, you're playing with house money.
Negotiation context
- It's been on market 69 days — a 6% lower offer ($183k) is reasonable based on typical stale-listing flexibility.
- 3 sale attempts since 14y ago; this cycle's ask has dropped $30k (13%) from the opening price — seller is motivated, your offer sets the floor, not the list.
- Current owner paid $60k; list at $195k implies a 225% gain — meaningful room to come down on a strong offer.
Risks & watch-outs
- Climate carrying-cost: extreme-heat days projected 6→18/yr by 2055 (HVAC capex compounding) — expect insurance premiums to compound above CPI over the hold.
Questions for the listing agent
- It's been on market 69 days. Have you received any prior offers? Is the seller open to a 6% concession, seller financing, or rate buy-down credit?
- Why hasn't it sold? Are there any deal-killer items the seller is aware of (foundation, flood, title, zoning, code violations)?
- Is there a deadline driving the sale (1031 exchange, divorce, estate, relocation)? That informs how much negotiation room exists.
- Crime grade is D in this area — have there been break-ins, vandalism, or insurance claims at this property in the last 3 years? What carrier currently insures it and at what premium?
- What's the average days-on-market for RENTAL listings here right now (not sales)? A rising rental-DOM trend means longer vacancies and softer asking-rent achievability than the comps imply.
- What's the recent tenant-quality profile in this submarket — average credit score on applications, eviction rate, late-payment / NSF rate, and stable-employment percentage? A property-management company in the area should have these aggregated.
- How much new for-sale + rental construction is in the pipeline within 1–3 miles? Heavy new supply typically softens prices + rents 12–24 months out; constrained supply supports both.
Investment metrics
- 1% rule
- 1.35% ✓
- Cap rate
- 11.32%
- Cash-on-cash
- 17.95%
- DSCR
- 1.80
- GRM
- 6.2
CMA / ARV
- ARV (on-the-fly)
- $133,551
- Comps found
- 4
Show comp detail 4 sales within ~0.75 mi
| Address | Dist | Beds/Ba | Sqft | Sold | Price | $/sf | Match |
|---|---|---|---|---|---|---|---|
| 1490 S ORANGE #123 | 0.13mi | 2/2.0 | 1,440 (+7%) | 9mo | $135,000 | $94 | 76 |
| 1440 S Orange Ave Spc 28 | 0.00mi | 2/2.0 | 1,440 (+7%) | 21mo | $140,000 | $97 | 71 |
| 1440 S Orange Ave #85 | 0.00mi | 2/2.0 | 1,440 (+7%) | 23mo | $158,500 | $110 | 69 |
| 1440 S Orange Ave. #52 | 0.15mi | 2/2.0 | 1,440 (+7%) | 24mo | $142,500 | $99 | 62 |
Match score weights: distance 35% · size 25% · config 20% · recency 20%. Top-matched comps best support the ARV.
Projected returns pro-forma
-3.0% appreciation · 2.18% rent growth · sell at horizon
- IRR
- 8.6%
- Equity multiple
- 1.33×
- Total profit
- $18,250
- Equity at exit
- $29,075
- IRR
- 17.1%
- Equity multiple
- 2.36×
- Total profit
- $74,125
- Equity at exit
- $16,860
Cash invested: $54,600 (down + closing). Projections, not guarantees.
Landlord ↔ Tenant lean methodology
- Overall (STATE)
- 18 Strongly Tenant-Friendly
- State California
- 18 Strongly Tenant-Friendly · D+13
- County
- — inherits STATE
- City
- — inherits STATE
ZIP-level market 92020
- Rents YoY
- 2.2%
- Active inventory
- 158
- Price-to-rent
- 6.2×
Monthly cashflow live
- Estimated rent
- $2,631 high interval (Pro) →
- Mortgage (P&I)
- −$1,023
- Tax from tax record
- −$158 /mo · $1,898/yr
- Insurance
- −$81
- HOA
- −$0
- Vacancy / Maint / Mgmt
- −$553
- Net cashflow
- $817
Break-even live
UW: 25.0% down · 7.5% · 30yr · 1.5% tax · 5.0% vac · 8.0% maint · 8.0% mgmt
Financing live
Cash to close
- Down payment
- $48,750
- Closing costs
- $5,850
- Reserves months
- —
- Total cash needed
- —
Loan-product check · same deal, 3 products live
Conventional
25% down · 7.5% · 30yr
- Down + closing
- —
- Monthly P&I
- —
- Monthly cashflow
- —
- DSCR
- —
- Eligible?
- —
Personal DTI + credit; lowest rate.
DSCR
20% down · 8.5% · 30yr
- Down + closing
- —
- Monthly P&I
- —
- Monthly cashflow
- —
- DSCR
- —
- Eligible?
- —
No personal income docs; deal must DSCR.
Hard money
10% down · 12.0% · 12mo
- Down + closing
- —
- Monthly P&I
- —
- Monthly cashflow
- —
- DSCR
- —
- Eligible?
- —
Short-term bridge; refi at stabilization.
Rent comps 29 comps
| Address | Beds | Baths | Sqft | Rent | $/sqft | DOM | Units | Dist |
|---|---|---|---|---|---|---|---|---|
| 345 Dahlia Way El Cajon, CA | 3.0 | 2.5 | 1700 | $4,200 | $2.47 | 1d | 1 | 0.40mi |
| 1013 S Sunshine Ave Unit G El Cajon, CA | 2.0 | 1.0 | 918 | $2,500 | $2.72 | 21d | 1 | 0.42mi |
| 1013 S Sunshine Ave Unit I El Cajon, CA | 2.0 | 1.0 | 918 | $2,500 | $2.72 | 1d | 1 | 0.42mi |
| 948 S Sunshine Ave Unit 20 El Cajon, CA | 2.0 | 1.0 | 900 | $2,095 | $2.33 | 1d | 1 | 0.47mi |
| 923 S Sunshine Ave El Cajon, CA | 2.0 | 1.0 | 900 | $2,050 | $2.28 | 1d | 1 | 0.47mi |
| 921 S Sunshine Ave El Cajon, CA | 2.0 | 2.0 | 900 | $2,350 | $2.61 | 1d | 2 | 0.50mi |
| 761 S Orange Ave Unit B El Cajon, CA | 2.0 | 1.0 | 1000 | $2,095 | $2.10 | 1d | 1 | 0.74mi |
| 851 Taft Ave El Cajon, CA | 3.0 | 2.0 | 1792 | $3,850 | $2.15 | 1d | 1 | 0.81mi |
| 1036 S Mollison Ave El Cajon, CA | 3.0 | 2.5 | 1776 | $4,350 | $2.45 | 1d | 1 | 0.87mi |
| 1020 S Mollison Ave El Cajon, CA | 3.0 | 2.5 | 1768 | $4,100 | $2.32 | 1d | 1 | 0.87mi |
| 1026 S Mollison Ave El Cajon, CA | 3.0 | 2.5 | 1771 | $4,000 | $2.26 | 1d | 1 | 0.87mi |
| 633 S Johnson Ave El Cajon, CA | 2.0 | 1.0 | 840 | $2,400 | $2.86 | 1d | 4 | 0.92mi |
| 725 Franklin Ave Unit D El Cajon, CA | 2.0 | 2.0 | 1000 | $2,150 | $2.15 | 1d | 1 | 0.93mi |
| 553 S Magnolia Ave El Cajon, CA | 2.0 | 1.0 | 900 | $2,095 | $2.33 | 1d | 2 | 0.95mi |
| 802 Franklin Ave El Cajon, CA | 1.0–2.0 | 1.0 | 800 | $1,995 | $2.49 | 4d | 2 | 0.98mi |
| 802 Franklin Ave Unit 858 El Cajon, CA | 2.0 | 1.0 | 900 | $1,995 | $2.22 | 1d | 1 | 0.98mi |
| 758 S Mollison Ave El Cajon, CA | 2.0 | 1.0 | 875 | $1,945 | $2.22 | 1d | 3 | 1.05mi |
| 957 E Washington Ave El Cajon, CA | 2.0 | 2.0 | 900 | $2,295 | $2.55 | 1d | 1 | 1.19mi |
| 975 E Washington Ave Apt E El Cajon, CA | 2.0 | 1.0 | 900 | $2,100 | $2.33 | 21d | 1 | 1.22mi |
| 265 Richardson Ave El Cajon, CA | 2.0 | 1.0 | 1024 | $3,250 | $3.17 | 2d | 1 | 1.22mi |
| 447 S Lincoln Ave El Cajon, CA | 2.0 | 1.5 | 928 | $2,300 | $2.48 | 1d | 1 | 1.23mi |
| 602 S Mollison Ave Unit C El Cajon, CA | 2.0 | 2.0 | 1024 | $2,600 | $2.54 | 1d | 1 | 1.24mi |
| 351 S Lincoln Ave El Cajon, CA | 2.0 | 2.0 | 900 | $2,395 | $2.66 | 1d | 1 | 1.32mi |
| 620 E Lexington Ave #3 El Cajon, CA | 2.0 | 2.0 | 1000 | $2,900 | $2.90 | 1d | 1 | 1.32mi |
| 148 Taft Ave Unit 7 El Cajon, CA | 2.0 | 1.0 | 875 | $1,895 | $2.17 | 1d | 1 | 1.35mi |
| 1065 E Washington Ave El Cajon, CA | 3.0 | 2.0 | 1100 | $2,850 | $2.59 | 1d | 1 | 1.35mi |
| 1065 E Washington Ave Apt N El Cajon, CA | 3.0 | 2.0 | 1100 | $2,850 | $2.59 | 17d | 1 | 1.35mi |
| 800 E Lexington Ave El Cajon, CA | 2.0–3.0 | 2.0 | 1040 | $2,390 | $2.30 | 1d | 5 | 1.40mi |
| 200 S Mollison Ave El Cajon, CA | 2.0 | 1.0 | 950 | $1,995 | $2.10 | 1d | 1 | 1.45mi |
Listing history 23 events
-
2026-06-18days on market $195,000 Active 69 DOM
-
2026-06-17days on market $195,000 Active 68 DOM
-
2026-06-16days on market $195,000 Active 67 DOM
-
2026-06-15days on market $195,000 Active 66 DOM
-
2026-06-13days on market $195,000 Active 64 DOM
-
2026-06-13days on market $195,000 Active 63 DOM
-
2026-06-09days on market $195,000 Active 60 DOM
-
2026-06-08days on market $195,000 Active 59 DOM
-
2026-06-07days on market $195,000 Active 58 DOM
-
2026-06-04days on market $195,000 Active 55 DOM
-
2026-06-03days on market $195,000 Active 54 DOM
-
2026-06-02days on market $195,000 Active 53 DOM
-
2026-06-01days on market $195,000 Active 52 DOM
-
2026-05-31days on market $195,000 Active 51 DOM
-
2026-05-14price $195,000
-
2026-04-20price $205,000
-
2026-04-20price $210,000
-
2026-04-10$225,000 Active
-
2013-05-06soldstatus $60,000 Sold 510-char remark
Show marketing remark (510 chars)
After entering,take the first left and this newer, lovely home is on the right! Original 3 bedrooms and 2 baths with the 3rd bedroom to be used as a study, retreat, office or workout room and is just a step off the master bdrm. Enjoy the wonderful park location close to plenty of visitor parking. Lovely view of mountains and hills and the park-like setting right across the street. The oversized dining area boasts beautiful custom built-in shelving. There is skylight in light, bright and efficient kitchen.
-
2013-04-04status Pending 510-char remark
Show marketing remark (510 chars)
After entering,take the first left and this newer, lovely home is on the right! Original 3 bedrooms and 2 baths with the 3rd bedroom to be used as a study, retreat, office or workout room and is just a step off the master bdrm. Enjoy the wonderful park location close to plenty of visitor parking. Lovely view of mountains and hills and the park-like setting right across the street. The oversized dining area boasts beautiful custom built-in shelving. There is skylight in light, bright and efficient kitchen.
-
2013-03-01$75,000 Active 510-char remark
Show marketing remark (510 chars)
After entering,take the first left and this newer, lovely home is on the right! Original 3 bedrooms and 2 baths with the 3rd bedroom to be used as a study, retreat, office or workout room and is just a step off the master bdrm. Enjoy the wonderful park location close to plenty of visitor parking. Lovely view of mountains and hills and the park-like setting right across the street. The oversized dining area boasts beautiful custom built-in shelving. There is skylight in light, bright and efficient kitchen.
-
2012-11-16historical
-
2012-05-17$90,000 Active
ⓘ Source: listings_history table (triggers on properties + properties_extension) + one-shot
backfill from property_details.listing_events for pre-trigger history.
Tax reassessment forecast CA · Resets to sale price
- Current annual tax
- $1,898 · $158/mo
- Projected year-2 tax
- $1,898 · $158/mo
- Expected delta
- $0/yr ($0/mo · 0.0%)
ⓘ Screening estimate from a state-policy table — verify with the county assessor before closing.
Climate risk First Street
- Flood 1/10 Low FEMA zone X (unshaded) · 0% chance over 30 yrs
- Wildfire 1/10 Low
- Heat 5/10 Major 6 d/yr ≥99°F today · 18 d/yr by 30 yrs out
- Wind 1/10 Low
- Air quality 3/10 Moderate 4 unhealthy d/yr today · 4 by 30 yrs out
Nearby sold comps map
Loading sold comps map…
Walkable amenities ~0.75 mi
Loading nearby amenities…
Taxation est. · year 1
- Rental income
- $31,575
- − Mortgage interest
- −$10,923
- − Property taxes
- −$1,898
- − Insurance
- −$975
- − Repairs & maintenance
- −$2,526
- − Management
- −$2,526
- − Depreciation
- −$5,673
- Taxable income
- $7,054
- Est. tax owed @ 24.0%
- −$1,693
- After-tax cash flow
- $8,107/yr
For passive investors: Depreciation is non-cash, so a rental often shows a tax loss while cash-flowing — sheltering income. Rental losses are passive: they offset passive income freely, and up to $25,000/yr can offset ordinary (W-2) income if you actively participate and your MAGI is under $100k (phasing out to $0 by $150k); unused losses carry forward. On sale, claimed depreciation is recaptured at up to 25%, and gains may owe capital-gains tax (a 1031 exchange can defer both). Figures are a year-1 estimate at your 24.0% rate — not tax advice; consult a CPA.
Schools (NCES district)
- District
- Grossmont Union High
- NCES district ID
- 0616230
- Math proficiency
- 31% ▼ -1.00%
- Reading proficiency
- 60% ▲ 5.00%
- Median HH income
- $61,801
- Composite
- 40.07/100
- National rank
- #3810
- State rank
- #173 of 517 in CA
Livability — El Cajon
- Score
- 70/100
- State rank
- #230
- US rank
- #7531
Category grades
Schools grade is shown separately in the Schools card above.
Census & demographics
- Census place
- El Cajon, CA
- County
- San Diego County · 3,178,799 people
- City population
- 173,694
- Metro
- San Diego-Chula Vista-Carlsbad, CA
- Population (ZIP)
- 57,842
- Household income
- $76,032
- Rent vs Own
- Severe rent burden
- 3892.0
Population outlook (San Diego County) Hauer SSP2
- Today (2025)
- 3,678,185 people
- By 2030
- 3,856,546 · +4.8%
- By 2040
- 4,171,407 · +13.4%
- By 2050
- 4,421,607 · +20.2%
- By 2075
- 4,831,599 · +31.4%
- By 2100
- 4,832,502 · +31.4%
Race, ethnicity, and origin ACS 2023
- Neighborhood character
- Diverse neighborhood (Simpson 0.61)
- Race & ethnicity
- White 55% Hispanic / Latino 28% Two or more races 13% Black 6% Asian 4%
- Hispanic origin (detail)
- Mexican 25%
- Common ancestry
- Arab 7% Italian 2% Lithuanian 2%
- Foreign-born
- 28% · Canada, China, Vietnam
- Languages at home
- 56% English-only · Spanish 21% Arabic 10% Other Indo-European 3%
Political lean MEDSL · San Diego
- 2024 margin
- D (+16.8) · D 56.9% · R 40.1% · Other 2.9%
- 2008→2024 swing
- +6.6pp toward D · 2008: 10.2pp · 2024: 16.8pp
- All cycles
- 2024: D+16.8 2020: D+22.8 2016: D+17.8 2012: D+5.1 2008: D+10.2
Not yet ingested
- Civics
- —
Market trends
- HPI YoY
- ▼ -724.49%
- Current HPI
- 361.2373
- Rent YoY
- ▲ 2.18%
- Metro
- San Diego-Chula Vista-Carlsbad, CA
- State GDP YoY
- ▲ 3.21%
- F500 in state
- 116
Industry mix (Fortune 500 HQ in CA)
| Industry | F500 HQs | Revenue |
|---|---|---|
| Technology | 27 | $1,492B |
|
||
| Financial Services | 3 | $174B |
|
||
| Retail | 3 | $44B |
|
||
| Insurance | 3 | $26B |
|
||
| Media / Entertainment | 2 | $115B |
|
||
| Pharmaceuticals / Biotech | 2 | $62B |
|
||
Price history
+116.7% since first listed9 events — show timeline
- 2026-05-14 Price Changed $195,000 SDMLS
- 2026-04-20 Price Changed $205,000 SDMLS
- 2026-04-20 Price Changed $210,000 SDMLS
- 2026-04-10 Listed $225,000 SDMLS
- 2013-05-06 Sold (MLS) $60,000 SDMLS
- 2013-04-04 Pending — SDMLS
- 2013-03-01 Listed $75,000 SDMLS
- 2012-11-16 Listing Removed — SDMLS
- 2012-05-17 Listed $90,000 SDMLS
Property tax history
+3.2%/yrLatest (2013): $1,898 · +5.5% YoY. Source: county tax records.
Cash-flow waterfall
monthlySold comps — $/sqft
last 12 mo · ≤1 miLoading sold comps…