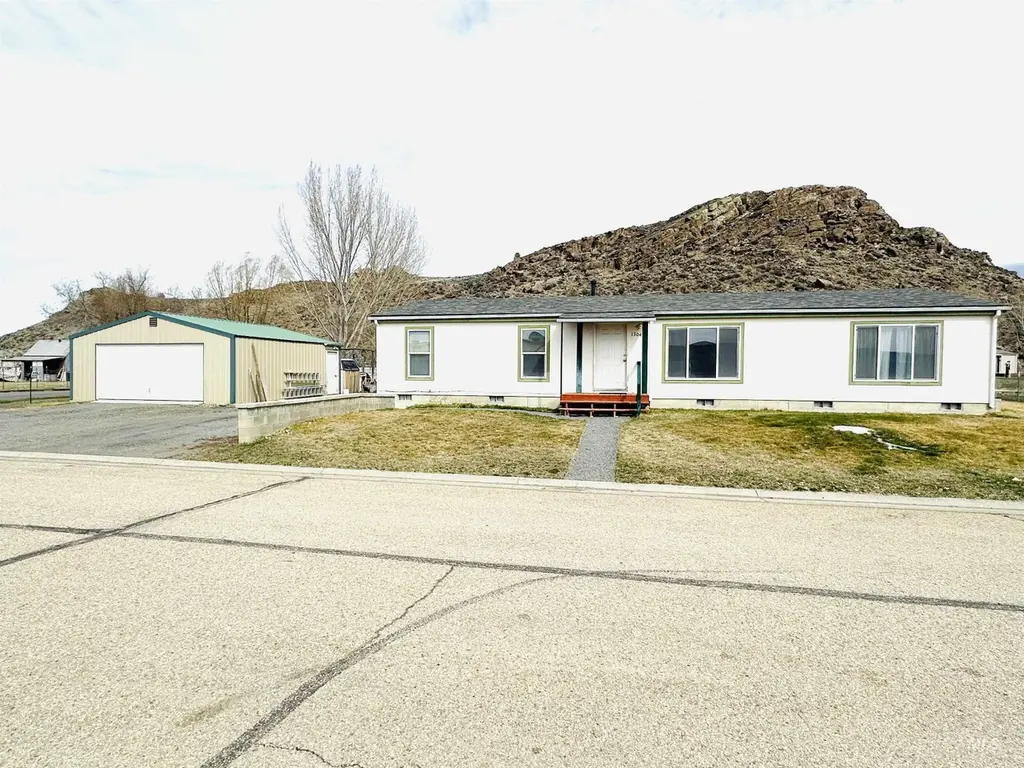
1304 Young Field Ave · Jordan Valley, OR
Flood risk 1/10 · Minimal
- FEMA flood zone
- X (shaded)
- Chance of flooding over 30 yrs
- 0.0%
- Est. flood insurance / yr
- $507 – $1,088
Fire risk 8/10 · Major
- Est. fire insurance / yr
- $498 – $926
Heat risk 3/10 · Minor
- Hot days now (above 92°F)
- 7 days/yr
- Hot days in 30 yrs
- 19 days/yr
Wind risk 1/10 · Minimal
- Chance of severe wind over 30 yrs
- —
Air-quality risk 6/10 · Moderate
- Unhealthy air days now
- 7 days/yr
- Unhealthy air days in 30 yrs
- 11 days/yr
Risk factors via First Street. Map © Google.
Why this score? — see what drove the C grade
The composite is a weighted blend of 9 inputs, each scored 0–100. Each bar is that input's sub-score; the figure is the points it added to the 100-point composite (weight × sub-score).
- Cash flow +20.5/30.0
- ARV discount +7.5/15.0
- DSCR +6.5/10.0
- Appreciation +5.0/10.0
- Schools +4.4/10.0
- 1% rule +4.1/10.0
- Livability +3.4/5.0
- Rent growth +2.5/5.0
- Condition / age +2.5/5.0
$189,900
🖨 Deal sheet (PDF) 📄 Offer letter ✓ Due diligence
Listing remarks
This 4-bedroom, 2-bathroom manufactured home offers 1,512 square feet of living space and is situated on a foundation on a . 23-acre lot in Jordan Valley, Oregon. The home features a new roof installed just a year ago and home has electric central air and heating. Inside, you'll find an open kitchen and dining area complete with an island breakfast bar, perfect for entertaining. The covered back porch is great for gatherings and barbecues. Additionally, there is a detached 2-car garage with ample room for RV parking and your outdoor toys. Experience the charm of small-town living, surrounded by some of the best outdoor recreational activities in the West. Enjoy upland game bird hunting and
Key facts
- Rv parking
- New roof
- Open kitchen
Tags
Neighborhood map
What this means for you Summary
Snapshot
- This is a 4-bed/2.0-bath manufactured listed at $190k.
Deal economics
- At list price, monthly cash flow is $251 ($3k/yr) — positive.
- The deal already cash-flows at list — no discount required.
- To meet the 1% rule (rent ≥ 1% of price), the offer needs to be $174k (8.6% below list).
- Recommended offer: $174k (8.6% below list) — sets the bar for 1% rule.
Location & tenants
- Location reads 68/100 on livability (#153 in OR) — a middle-class / working-renter tenant base. Strengths: cost of living A+, housing A+; Watch: employment C-, crime F, amenities F.
- Jordan Valley SD 3 (rural): math 21% / reading 80% proficiency, ranked #40 of 183 in OR (top 22%) — acceptable for families but not a draw, mixed tenant base, ~2y average lease.
- Zoned schools: Jordan Valley Elementary School (math 75% / reading 75%, 26 students, 0% FRL); Jordan Valley High School (math 24% / reading 75%, grade D+, #32 of 143 statewide, top 34%, 31 students, 0% FRL) — zoned schools average 0% FRL vs 40% district-wide (40 pts lower); this property's tenant base skews higher-income than the district average.
- Market conditions: 6 active listings in the ZIP; 44 units permitted in Malheur County in 2024 (0 in 5+ unit buildings).
Forward outlook
- In year one you build about $7k of equity ($1k loan paydown + $6k appreciation (3.0% local appreciation)).
- Malheur County population projected at -20% by 2050 — secular population decline; favor cash flow + early exit over multi-decade hold.
- At projected returns (3.0% appreciation + 3.0% rent growth), your $53k cash investment doubles in ~5 years — after that, you're playing with house money.
- By year 5, paydown + projected appreciation supports a ~$30k cash-out refi (75% LTV) — recoverable capital for the next deal without selling this one.
Negotiation context
- Only 7 days on market — expect competitive offers; lowballing is unlikely to land.
- 2 sale attempts since 19y ago with the ask held roughly flat each time — persistent listings suggest the price (not the market) is what's stuck; bring a comps-based counter.
- Current owner paid $96k; list at $190k implies a 99% gain — meaningful room to come down on a strong offer.
Risks & watch-outs
- Climate carrying-cost: severe wildfire risk — expect insurance premiums to compound above CPI over the hold.
Questions for the listing agent
- Is there a deadline driving the sale (1031 exchange, divorce, estate, relocation)? That informs how much negotiation room exists.
- Schools are B-rated — typically a magnet for longer-tenancy family renters. What's the average tenant stay here, and is there a school-zone premium baked into asking?
- Crime grade is F in this area — have there been break-ins, vandalism, or insurance claims at this property in the last 3 years? What carrier currently insures it and at what premium?
- What's the average days-on-market for RENTAL listings here right now (not sales)? A rising rental-DOM trend means longer vacancies and softer asking-rent achievability than the comps imply.
- What's the recent tenant-quality profile in this submarket — average credit score on applications, eviction rate, late-payment / NSF rate, and stable-employment percentage? A property-management company in the area should have these aggregated.
- How much new for-sale + rental construction is in the pipeline within 1–3 miles? Heavy new supply typically softens prices + rents 12–24 months out; constrained supply supports both.
Investment metrics
- 1% rule
- 0.91% ✗
- Cap rate
- 7.88%
- Cash-on-cash
- 5.67%
- DSCR
- 1.25
- GRM
- 9.1
CMA / ARV
No comps found within radius.
Projected returns pro-forma
3.0% appreciation · 3.0% rent growth · sell at horizon
- IRR
- 12.8%
- Equity multiple
- 1.73×
- Total profit
- $38,774
- Equity at exit
- $85,387
- IRR
- 14.7%
- Equity multiple
- 3.17×
- Total profit
- $115,526
- Equity at exit
- $131,592
Cash invested: $53,172 (down + closing). Projections, not guarantees.
Landlord ↔ Tenant lean methodology
- Overall (STATE)
- 28 Tenant-Leaning
- State Oregon
- 28 Tenant-Leaning · D+6
- County
- — inherits STATE
- City
- — inherits STATE
ZIP-level market 97910
- Active inventory
- 6
- Price-to-rent
- 9.1×
Monthly cashflow live
- Estimated rent
- $1,736 medium interval (Pro) →
- Mortgage (P&I)
- −$996
- Tax from tax record
- −$45 /mo · $540/yr
- Insurance
- −$79
- HOA
- −$0
- Vacancy / Maint / Mgmt
- −$364
- Net cashflow
- $251
Break-even live
Sensitivity live
| Price | -10% $359 | -5% $305 | +0% $251 | +5% $197 | +10% $144 |
|---|---|---|---|---|---|
| Rent | -10% $114 | -5% $183 | +0% $251 | +5% $320 | +10% $388 |
| Rate | -1.0pp $347 | -0.5pp $299 | base $251 | +0.5pp $202 | +1.0pp $152 |
UW: 25.0% down · 7.5% · 30yr · 1.5% tax · 5.0% vac · 8.0% maint · 8.0% mgmt
Financing live
Cash to close
- Down payment
- $47,475
- Closing costs
- $5,697
- Reserves months
- —
- Total cash needed
- —
Loan-product check · same deal, 3 products live
Conventional
25% down · 7.5% · 30yr
- Down + closing
- —
- Monthly P&I
- —
- Monthly cashflow
- —
- DSCR
- —
- Eligible?
- —
Personal DTI + credit; lowest rate.
DSCR
20% down · 8.5% · 30yr
- Down + closing
- —
- Monthly P&I
- —
- Monthly cashflow
- —
- DSCR
- —
- Eligible?
- —
No personal income docs; deal must DSCR.
Hard money
10% down · 12.0% · 12mo
- Down + closing
- —
- Monthly P&I
- —
- Monthly cashflow
- —
- DSCR
- —
- Eligible?
- —
Short-term bridge; refi at stabilization.
Listing history 6 events
-
2026-03-25status Pending
-
2026-03-18$189,900 Active
-
2008-07-24soldstatus
-
2008-07-23soldstatus $95,500
-
2007-12-11$99,900
-
2003-02-01soldstatus $52,000
ⓘ Source: listings_history table (triggers on properties + properties_extension) + one-shot
backfill from property_details.listing_events for pre-trigger history.
Tax reassessment forecast OR · Resets to sale price
- Current annual tax
- $540 · $45/mo
- Projected year-2 tax
- $1,842 · $154/mo
- Expected delta
- +$1,302/yr (+$108/mo · 241.0%)
ⓘ Screening estimate from a state-policy table — verify with the county assessor before closing.
Climate risk First Street
- Flood 1/10 Low FEMA zone X (shaded) · 0% chance over 30 yrs
- Wildfire 8/10 Severe
- Heat 3/10 Moderate 7 d/yr ≥92°F today · 19 d/yr by 30 yrs out
- Wind 1/10 Low
- Air quality 6/10 Major 7 unhealthy d/yr today · 11 by 30 yrs out
Nearby sold comps map
Loading sold comps map…
Walkable amenities ~0.75 mi
Loading nearby amenities…
Taxation est. · year 1
- Rental income
- $20,826
- − Mortgage interest
- −$10,637
- − Property taxes
- −$540
- − Insurance
- −$950
- − Repairs & maintenance
- −$1,666
- − Management
- −$1,666
- − Depreciation
- −$5,524
- Taxable loss
- −$157
- Est. tax savings @ 24.0%
- +$38
- After-tax cash flow
- $3,050/yr
For passive investors: Depreciation is non-cash, so a rental often shows a tax loss while cash-flowing — sheltering income. Rental losses are passive: they offset passive income freely, and up to $25,000/yr can offset ordinary (W-2) income if you actively participate and your MAGI is under $100k (phasing out to $0 by $150k); unused losses carry forward. On sale, claimed depreciation is recaptured at up to 25%, and gains may owe capital-gains tax (a 1031 exchange can defer both). Figures are a year-1 estimate at your 24.0% rate — not tax advice; consult a CPA.
Schools (NCES district)
- District
- Jordan Valley SD 3
- NCES district ID
- 4106820
- Math proficiency
- 21% ▬ 0.00%
- Reading proficiency
- 80% ▲ 40.00%
- Median HH income
- $41,291
- Composite
- 44.25/100
- National rank
- #6182
- State rank
- #40 of 183 in OR
Livability — Jordan Valley
- Score
- 68/100
- State rank
- #153
- US rank
- #9086
Category grades
Schools grade is shown separately in the Schools card above.
Census & demographics
- Census place
- Jordan Valley, OR
- Population (ZIP)
- 675
Population outlook (Malheur County) Hauer SSP2
- Today (2025)
- 28,275 people
- By 2030
- 27,112 · -4.1%
- By 2040
- 24,731 · -12.5%
- By 2050
- 22,507 · -20.4%
- By 2075
- 17,168 · -39.3%
- By 2100
- 11,382 · -59.7%
Race, ethnicity, and origin ACS 2023
- Neighborhood character
- Predominantly White (94%)
- Race & ethnicity
- White 94% Hispanic / Latino 5% Two or more races 5%
- Common ancestry
- Portuguese 7% Slovak 4% Dutch 3%
- Foreign-born
- 1%
- Languages at home
- 98% English-only · Russian/Polish/Slavic 1% Spanish 1%
Political lean MEDSL · Malheur
- 2024 margin
- Solid R (+44.4) · D 26.4% · R 70.7% · Other 2.9%
- 2008→2024 swing
- -4.0pp toward R · 2008: -40.3pp · 2024: -44.4pp
- All cycles
- 2024: R+44.4 2020: R+41.7 2016: R+49.5 2012: R+41.7 2008: R+40.3
Not yet ingested
- Civics
- —
Market trends
- HPI YoY
- —
- Current HPI
- —
- Rent YoY
- —
- Metro
- —
- State GDP YoY
- ▲ 2.05%
- F500 in state
- 2
Industry mix (Fortune 500 HQ in OR)
| Industry | F500 HQs | Revenue |
|---|---|---|
| Consumer Goods | 1 | $51B |
|
||
Price history
+265.2% since first listed6 events — show timeline
- 2026-03-25 Pending — IMLS
- 2026-03-18 Listed $189,900 IMLS
- 2008-07-24 Sold (MLS) — IMLS
- 2008-07-23 Sold (Public Records) $95,500 Public Records
- 2007-12-11 Listed $99,900 IMLS
- 2003-02-01 Sold (Public Records) $52,000 Public Records
Property tax history
+1.9%/yrLatest (2025): $540 · +2.9% YoY. Source: county tax records.
Cash-flow waterfall
monthlySold comps — $/sqft
last 12 mo · ≤1 miLoading sold comps…