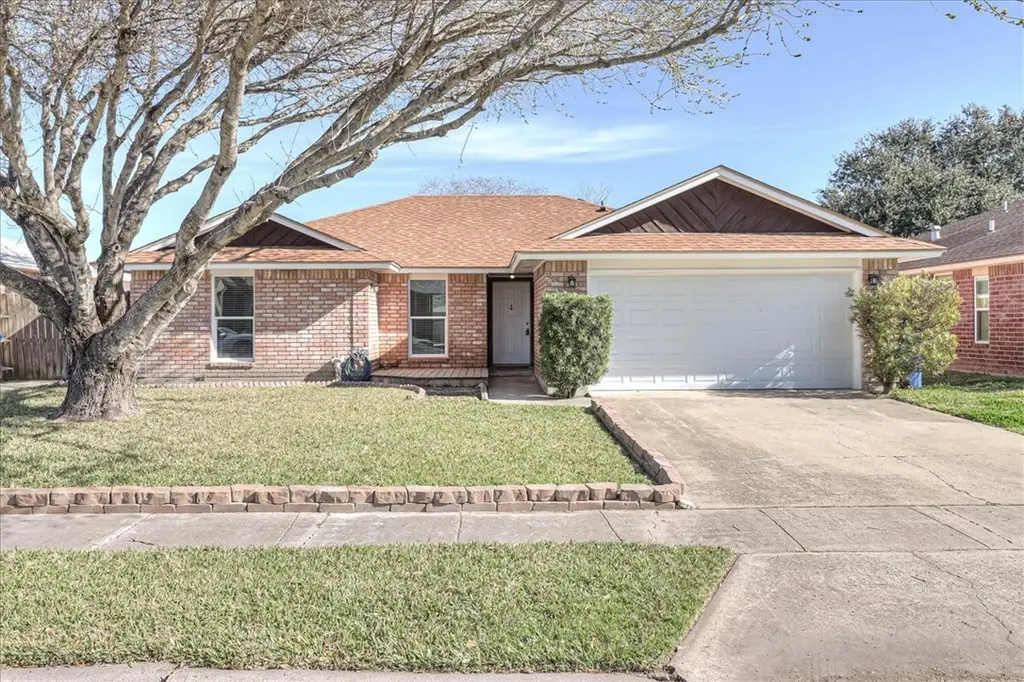
7314 Ottawa · Corpus Christi, TX
Flood risk 3/10 · Minor
- FEMA flood zone
- X (unshaded)
- Chance of flooding over 30 yrs
- 0.12%
- Est. flood insurance / yr
- $507 – $1,088
Fire risk 4/10 · Minor
- Est. fire insurance / yr
- $1,222 – $2,270
Heat risk 10/10 · Severe
- Hot days now (above 108°F)
- 7 days/yr
- Hot days in 30 yrs
- 27 days/yr
Wind risk 9/10 · Severe
- Chance of severe wind over 30 yrs
- 99.0%
Air-quality risk 1/10 · Minimal
- Unhealthy air days now
- 0 days/yr
- Unhealthy air days in 30 yrs
- 0 days/yr
Risk factors via First Street. Map © Google.
Why this score? — see what drove the D+ grade
The composite is a weighted blend of 9 inputs, each scored 0–100. Each bar is that input's sub-score; the figure is the points it added to the 100-point composite (weight × sub-score).
- ARV discount +13.5/15.0
- Cash flow +12.6/30.0
- 1% rule +4.2/10.0
- Livability +3.9/5.0
- DSCR +3.8/10.0
- Rent growth +3.0/5.0
- Schools +2.8/10.0
- Condition / age +2.5/5.0
- Appreciation +0.0/10.0
$225,000
🖨 Deal sheet (PDF) 📄 Offer letter ✓ Due diligence
Listing remarks MLS
CALL FIRST APPT. W/ OWNER PG#889-8163 TERRY WRIGHT OR LISTOR JO ANDERSON 992-1630 OR 855-4041 CEILING FAN, LG BKYD, GOOD CENTS LOW UTILITIES QUIET CUL DE SAC WALKG DISTANCE ELLA BARNES ELEMENTARY-CALL FIRST OWNER OR LISTOR
Key facts
- Beautiful flooring
- Beautiful fireplace
- Cathedral ceiling
Tags
Neighborhood map
What this means for you Summary
Snapshot
- This is a 3-bed/2.0-bath single-family listed at $225k.
Deal economics
- At list price, monthly cash flow is $-27 ($-324/yr) — negative.
- To cash-flow at today's rent, offer at most $220k (2.1% below list).
- To meet the 1% rule (rent ≥ 1% of price), the offer needs to be $207k (8.0% below list).
- Recommended offer: $207k (8.0% below list) — sets the bar for 1% rule.
- Cap rate 6.1% vs local median 3.6% in Corpus Christi — top-decile yield for the area; either an underpriced asset or a hidden risk that comps aren't pricing in. Stress-test before assuming the spread holds.
Location & tenants
- Location reads 78/100 on livability (#66 in TX, #2,404 nationally) — a middle-class / working-renter tenant base. Strengths: commute A+, cost of living A+, housing A+; Watch: crime F.
- Corpus Christi ISD (urban): math 31% / reading 35% proficiency, ranked #562 of 826 in TX (top 68%) — families likely to look elsewhere, expect single-tenant / working-renter base with shorter leases; 63% free/reduced lunch — lower-income household profile, screen leases tightly.
- Market conditions: Rents rising (+1.9%/yr); 621 active listings in the ZIP; 40 comparable units currently listed for rent nearby; rentals lingering (median 45d on market — plan ~5-8 weeks vacancy on turnover, expect pricing pressure); 55% of comp listings sitting > 30 days — soft ceiling on asking rent; solid renter incomes; 1,397 units permitted in Nueces County in 2024 (47 in 5+ unit buildings).
Forward outlook
- Local home prices are declining (-3.0%/yr); year-one equity from $2k of loan paydown is wiped out by about $7k of value loss. Plan a longer hold.
- Nueces County population projected at +36% by 2050 — long-run rental-demand tailwind backs the buy-and-hold thesis.
Negotiation context
- Only 7 days on market — expect competitive offers; lowballing is unlikely to land.
- 5 sale attempts since 30y ago with the ask held roughly flat each time — persistent listings suggest the price (not the market) is what's stuck; bring a comps-based counter.
- Current owner paid $80k; list at $225k implies a 181% gain — meaningful room to come down on a strong offer.
Risks & watch-outs
- Climate carrying-cost: severe wind risk, 99% chance of damaging wind over 30y; extreme-heat days projected 7→27/yr by 2055 (HVAC capex compounding) — expect insurance premiums to compound above CPI over the hold.
Questions for the listing agent
- What do current leases actually rent for vs. the listed asking? Can we see a recent rent roll and the last 12 months of T-12 income?
- Is there a deadline driving the sale (1031 exchange, divorce, estate, relocation)? That informs how much negotiation room exists.
- Crime grade is F in this area — have there been break-ins, vandalism, or insurance claims at this property in the last 3 years? What carrier currently insures it and at what premium?
- The area grade is low — what's the realistic commute time and amenity access for the typical tenant pool here? Any planned neighborhood developments (good or bad) we should know about?
- What's the average days-on-market for RENTAL listings here right now (not sales)? A rising rental-DOM trend means longer vacancies and softer asking-rent achievability than the comps imply.
- What's the recent tenant-quality profile in this submarket — average credit score on applications, eviction rate, late-payment / NSF rate, and stable-employment percentage? A property-management company in the area should have these aggregated.
- How much new for-sale + rental construction is in the pipeline within 1–3 miles? Heavy new supply typically softens prices + rents 12–24 months out; constrained supply supports both.
Investment metrics
- 1% rule
- 0.92% ✗
- Cap rate
- 6.15%
- Cash-on-cash
- -0.51%
- DSCR
- 0.98
- GRM
- 9.1
CMA / ARV
- ARV (on-the-fly)
- $259,624
- Comps found
- 12
Show comp detail 12 sales within ~0.75 mi
| Address | Dist | Beds/Ba | Sqft | Sold | Price | $/sf | Match |
|---|---|---|---|---|---|---|---|
| 2814 Quebec Dr | 0.19mi | 3/2.0 | 1,366 (-3%) | 3mo | $199,000 | $146 | 84 |
| 2818 Lake Rhapsody Dr | 0.21mi | 3/2.0 | 1,381 (-2%) | 6mo | $271,000 | $196 | 82 |
| 2709 Parkgreen Dr | 0.16mi | 3/2.0 | 1,327 (-6%) | 2mo | $246,000 | $185 | 81 |
| 7205 Lake Placid Dr | 0.23mi | 3/2.0 | 1,498 (+6%) | 2mo | $275,000 | $184 | 77 |
| 2721 Thunder Bay Ct | 0.22mi | 3/2.5 | 1,566 (+11%) | 1mo | $269,900 | $172 | 69 |
| 7425 Diamond Dr | 0.44mi | 3/2.0 | 1,539 (+9%) | 1mo | $310,000 | $201 | 63 |
| 7658 Granite Dr | 0.64mi | 3/2.0 | 1,482 (+5%) | 3mo | $290,000 | $196 | 59 |
| 7502 Brush Creek Dr | 0.60mi | 3/2.0 | 1,496 (+6%) | 3mo | $249,999 | $167 | 59 |
| 2210 Diamond Dr | 0.53mi | 3/2.0 | 1,523 (+8%) | 5mo | $309,900 | $203 | 58 |
| 2625 Las Brisas St | 0.71mi | 3/2.0 | 1,528 (+8%) | 2mo | $258,000 | $169 | 51 |
| 3201 Keltic Dr | 0.63mi | 3/2.0 | 1,243 (-12%) | 3mo | $228,000 | $183 | 48 |
| 3150 Quail Springs Rd | 0.69mi | 3/2.0 | 1,587 (+12%) | 6mo | $183,000 | $115 | 42 |
Match score weights: distance 35% · size 25% · config 20% · recency 20%. Top-matched comps best support the ARV.
Projected returns pro-forma
-3.0% appreciation · 1.94% rent growth · sell at horizon
- IRR
- -18.4%
- Equity multiple
- 0.36×
- Total profit
- $-40,268
- Equity at exit
- $33,548
- IRR
- -13.0%
- Equity multiple
- 0.28×
- Total profit
- $-45,660
- Equity at exit
- $19,454
Cash invested: $63,000 (down + closing). Projections, not guarantees.
Landlord ↔ Tenant lean methodology
- Overall (STATE)
- 87 Strongly Landlord-Friendly
- State Texas
- 87 Strongly Landlord-Friendly · R+5
- County
- — inherits STATE
- City
- — inherits STATE
ZIP-level market 78414
- Home prices YoY
- -18.1%
- Rents YoY
- 1.9%
- Active inventory
- 621
- Price-to-rent
- 9.1×
Monthly cashflow live
- Estimated rent
- $2,070 high interval (Pro) →
- Mortgage (P&I)
- −$1,180
- Tax from tax record
- −$389 /mo · $4,662/yr
- Insurance
- −$94
- HOA
- −$0
- Vacancy / Maint / Mgmt
- −$435
- Net cashflow
- $-27
Break-even live
Sensitivity live
| Price | -10% $100 | -5% $37 | +0% $-27 | +5% $-91 | +10% $-154 |
|---|---|---|---|---|---|
| Rent | -10% $-191 | -5% $-109 | +0% $-27 | +5% $55 | +10% $137 |
| Rate | -1.0pp $86 | -0.5pp $30 | base $-27 | +0.5pp $-85 | +1.0pp $-145 |
UW: 25.0% down · 7.5% · 30yr · 1.5% tax · 5.0% vac · 8.0% maint · 8.0% mgmt
Financing live
Cash to close
- Down payment
- $56,250
- Closing costs
- $6,750
- Reserves months
- —
- Total cash needed
- —
Loan-product check · same deal, 3 products live
Conventional
25% down · 7.5% · 30yr
- Down + closing
- —
- Monthly P&I
- —
- Monthly cashflow
- —
- DSCR
- —
- Eligible?
- —
Personal DTI + credit; lowest rate.
DSCR
20% down · 8.5% · 30yr
- Down + closing
- —
- Monthly P&I
- —
- Monthly cashflow
- —
- DSCR
- —
- Eligible?
- —
No personal income docs; deal must DSCR.
Hard money
10% down · 12.0% · 12mo
- Down + closing
- —
- Monthly P&I
- —
- Monthly cashflow
- —
- DSCR
- —
- Eligible?
- —
Short-term bridge; refi at stabilization.
Rent comps 40 comps
| Address | Beds | Baths | Sqft | Rent | $/sqft | DOM | Units | Dist |
|---|---|---|---|---|---|---|---|---|
| 2809 Quebec Dr Corpus Christi, TX | 3.0 | 2.0 | 1576 | $1,995 | $1.27 | 14d | 1 | 0.18mi |
| 2621 Bruin Corpus Christi, TX | 3.0 | 2.0 | 1802 | $2,350 | $1.30 | 44d | 1 | 0.19mi |
| 7510 Wooldridge Rd Corpus Christi, TX | 1.0–3.0 | 1.0–2.0 | 1148 | $2,335 | $2.03 | 44d | 1 | 0.23mi |
| 2842 Quebec Dr Corpus Christi, TX | 3.0 | 2.0 | 1453 | $2,200 | $1.51 | 44d | 1 | 0.24mi |
| 7214 Lake Melody Dr Corpus Christi, TX | 3.0 | 2.5 | 1636 | $2,350 | $1.44 | 44d | 1 | 0.26mi |
| 7237 Lake Tranquility Dr Corpus Christi, TX | 4.0 | 2.0 | 1593 | $2,100 | $1.32 | 44d | 1 | 0.34mi |
| 2813 Lake Tranquility Cir Corpus Christi, TX | 3.0 | 2.0 | 1595 | $2,350 | $1.47 | 44d | 1 | 0.35mi |
| 7252 The Mansions Dr Unit G4 Corpus Christi, TX | 2.0 | 2.0 | 1200 | $1,450 | $1.21 | 14d | 1 | 0.37mi |
| 7252 The Mansions Dr Unit H2 Corpus Christi, TX | 3.0 | 2.0 | 1479 | $1,850 | $1.25 | 44d | 1 | 0.37mi |
| 7252 Mansions Dr Corpus Christi, TX | 2.0 | 2.0 | 1200 | $1,500 | $1.25 | 44d | 1 | 0.39mi |
| 7252 Mansions Dr Unit D3 Corpus Christi, TX | 2.0 | 2.0 | 1057 | $1,600 | $1.51 | 44d | 1 | 0.41mi |
| 7033 Premont Dr Corpus Christi, TX | 3.0 | 3.0 | 1856 | $2,150 | $1.16 | 14d | 1 | 0.46mi |
| 2221 Crystal Bay Dr Corpus Christi, TX | 4.0 | 2.0 | 1705 | $2,200 | $1.29 | 14d | 1 | 0.49mi |
| 7202 Mansions Dr Unit J3 1 Corpus Christi, TX | 2.0 | 2.0 | 1057 | $1,695 | $1.60 | 44d | 1 | 0.50mi |
| 7610 Quartz Dr Corpus Christi, TX | 3.0 | 2.0 | 1538 | $2,195 | $1.43 | 44d | 1 | 0.57mi |
| 2805 Summer Ridge Dr Corpus Christi, TX | 3.0 | 2.0 | 1420 | $1,800 | $1.27 | 44d | 1 | 0.60mi |
| 7454 Seal Beach Ct Corpus Christi, TX | 3.0 | 2.0 | 1571 | $2,250 | $1.43 | 22d | 1 | 0.62mi |
| 7454 Seal Beach Ct Corpus Christi, TX | 3.0 | 2.0 | 1571 | $2,250 | $1.43 | 14d | 1 | 0.62mi |
| 2529 Las Brisas St Corpus Christi, TX | 4.0 | 2.0 | 1572 | $2,250 | $1.43 | 22d | 1 | 0.69mi |
| 3009 Las Brisas St Corpus Christi, TX | 3.0 | 2.0 | 1487 | $2,000 | $1.34 | 14d | 1 | 0.70mi |
| 2617 Whirlwind St Corpus Christi, TX | 3.0 | 2.0 | 1596 | $2,050 | $1.28 | 14d | 1 | 0.74mi |
| 7430 Cessna Dr Corpus Christi, TX | 3.0 | 2.0 | 1370 | $2,000 | $1.46 | 44d | 1 | 0.74mi |
| 2530 Windrose Dr Corpus Christi, TX | 4.0 | 2.0 | 1745 | $2,350 | $1.35 | 44d | 1 | 0.76mi |
| 2706 Grace Cir Unit B Corpus Christi, TX | 3.0 | 2.0 | 1369 | $2,095 | $1.53 | 22d | 1 | 0.81mi |
| 3310 Rodd Field Rd Corpus Christi, TX | 1.0–2.0 | 1.0–2.0 | 847 | $1,629 | $1.92 | 14d | 35 | 0.91mi |
| 7021 San Benito Dr Corpus Christi, TX | 3.0 | 2.0 | 1829 | $2,145 | $1.17 | 14d | 1 | 0.94mi |
| 8033 Cormorant Dr Corpus Christi, TX | 3.0 | 2.0 | 1199 | $2,100 | $1.75 | 14d | 1 | 0.94mi |
| 1818 Rodd Field Rd Unit B2 Corpus Christi, TX | 2.0 | 2.0 | 1200 | $1,850 | $1.54 | 14d | 1 | 0.98mi |
| 2230 Spoonbill Dr Corpus Christi, TX | 3.0 | 2.0 | 1364 | $2,000 | $1.47 | 44d | 1 | 0.99mi |
| 2337 Nautical Wind Dr Corpus Christi, TX | 3.0 | 2.0 | 1555 | $2,100 | $1.35 | 22d | 1 | 1.03mi |
| 2333 Nautical Wind Dr Corpus Christi, TX | 3.0 | 2.0 | 1273 | $1,950 | $1.53 | 44d | 1 | 1.03mi |
| 2921 Airline Rd Corpus Christi, TX | 1.0–2.0 | 1.0–2.0 | 982 | $1,664 | $1.69 | 44d | 1 | 1.05mi |
| 2509 Wool Dr Corpus Christi, TX | 3.0 | 2.0 | 1785 | $2,600 | $1.46 | 14d | 1 | 1.08mi |
| 1966 Ennis Joslin Rd Corpus Christi, TX | 2.0 | 2.0 | 986 | $1,767 | $1.79 | 14d | 53 | 1.09mi |
| 6617 Meadowbreeze Pkwy Corpus Christi, TX | 3.0 | 2.0 | 1284 | $1,800 | $1.40 | 45d | 1 | 1.11mi |
| 6606 Riding Wind Dr Corpus Christi, TX | 3.0 | 2.0 | 1325 | $1,950 | $1.47 | 44d | 1 | 1.12mi |
| 6845 Rhine Dr Corpus Christi, TX | 3.0 | 1.5 | 1518 | $1,695 | $1.12 | 44d | 1 | 1.19mi |
| 3617 Garnet Ct Corpus Christi, TX | 4.0 | 2.0 | 1758 | $2,125 | $1.21 | 44d | 1 | 1.19mi |
| 6706 Rhonda Dr Corpus Christi, TX | 2.0 | 1.0 | 1002 | $1,375 | $1.37 | 22d | 1 | 1.24mi |
| 6822 Wall St Corpus Christi, TX | 4.0 | 2.0 | 1846 | $1,995 | $1.08 | 44d | 1 | 1.27mi |
Listing history 14 events
-
2026-05-02status Pending
-
2026-05-01historical
-
2026-04-30status Pending
-
2026-04-21historical
-
2026-04-13$225,000 Active
-
2026-04-11historical $1,995
-
2026-04-03$1,995
-
2026-04-03historical $1,995
-
2026-04-02$1,995
-
2021-11-12soldstatus
-
1998-06-15soldstatus 222-char remark
Show marketing remark (222 chars)
CALL FIRST APPT. W/ OWNER PG#889-8163 TERRY WRIGHT OR LISTOR JO ANDERSON 992-1630 OR 855-4041 CEILING FAN, LG BKYD, GOOD CENTS LOW UTILITIES QUIET CUL DE SAC WALKG DISTANCE ELLA BARNES ELEMENTARY-CALL FIRST OWNER OR LISTOR
-
1998-06-15soldstatus $80,000
Show marketing remark (222 chars)
CALL FIRST APPT. W/ OWNER PG#889-8163 TERRY WRIGHT OR LISTOR JO ANDERSON 992-1630 OR 855-4041 CEILING FAN, LG BKYD, GOOD CENTS LOW UTILITIES QUIET CUL DE SAC WALKG DISTANCE ELLA BARNES ELEMENTARY-CALL FIRST OWNER OR LISTOR
-
1998-02-01$82,500 222-char remark
Show marketing remark (222 chars)
CALL FIRST APPT. W/ OWNER PG#889-8163 TERRY WRIGHT OR LISTOR JO ANDERSON 992-1630 OR 855-4041 CEILING FAN, LG BKYD, GOOD CENTS LOW UTILITIES QUIET CUL DE SAC WALKG DISTANCE ELLA BARNES ELEMENTARY-CALL FIRST OWNER OR LISTOR
-
1996-11-12$82,500
ⓘ Source: listings_history table (triggers on properties + properties_extension) + one-shot
backfill from property_details.listing_events for pre-trigger history.
Tax reassessment forecast TX · Resets to sale price
- Current annual tax
- $4,662 · $389/mo
- Projected year-2 tax
- $4,662 · $389/mo
- Expected delta
- $0/yr ($0/mo · 0.0%)
ⓘ Screening estimate from a state-policy table — verify with the county assessor before closing.
Climate risk First Street
- Flood 3/10 Moderate FEMA zone X (unshaded) · 12% chance over 30 yrs
- Wildfire 4/10 Moderate
- Heat 10/10 Extreme 7 d/yr ≥108°F today · 27 d/yr by 30 yrs out
- Wind 9/10 Extreme 99% chance of damaging wind over 30 yrs
- Air quality 1/10 Low 0 unhealthy d/yr today · 0 by 30 yrs out
Nearby sold comps map
Loading sold comps map…
Walkable amenities ~0.75 mi
Loading nearby amenities…
Taxation est. · year 1
- Rental income
- $24,838
- − Mortgage interest
- −$12,603
- − Property taxes
- −$4,662
- − Insurance
- −$1,125
- − Repairs & maintenance
- −$1,987
- − Management
- −$1,987
- − Depreciation
- −$6,545
- Taxable loss
- −$4,072
- Est. tax savings @ 24.0%
- +$977
- After-tax cash flow
- $653/yr
For passive investors: Depreciation is non-cash, so a rental often shows a tax loss while cash-flowing — sheltering income. Rental losses are passive: they offset passive income freely, and up to $25,000/yr can offset ordinary (W-2) income if you actively participate and your MAGI is under $100k (phasing out to $0 by $150k); unused losses carry forward. On sale, claimed depreciation is recaptured at up to 25%, and gains may owe capital-gains tax (a 1031 exchange can defer both). Figures are a year-1 estimate at your 24.0% rate — not tax advice; consult a CPA.
Schools (NCES district)
- District
- Corpus Christi ISD
- NCES district ID
- 4815270
- Math proficiency
- 31% ▼ -18.00%
- Reading proficiency
- 35% ▼ -7.00%
- Median HH income
- $45,672
- Composite
- 28.27/100
- National rank
- #6793
- State rank
- #562 of 826 in TX
Livability — Corpus Christi
- Score
- 78/100
- State rank
- #66
- US rank
- #2404
Category grades
Schools grade is shown separately in the Schools card above.
Census & demographics
- Census place
- Corpus Christi, TX
- County
- Nueces County · 296,836 people
- City population
- 296,836
- Metro
- Corpus Christi, TX
- Population (ZIP)
- 54,263
- Household income
- $98,771
- Rent vs Own
- Severe rent burden
- 1167.0
Population outlook (Nueces County) Hauer SSP2
- Today (2025)
- 418,037 people
- By 2030
- 447,123 · +7.0%
- By 2040
- 505,911 · +21.0%
- By 2050
- 567,522 · +35.8%
- By 2075
- 729,686 · +74.6%
- By 2100
- 847,087 · +102.6%
Race, ethnicity, and origin ACS 2023
- Neighborhood character
- Diverse neighborhood (Simpson 0.60)
- Race & ethnicity
- Hispanic / Latino 52% White 35% Two or more races 33% Asian 6% Black 3%
- Hispanic origin (detail)
- Mexican 46% Puerto Rican 1%
- Common ancestry
- Lithuanian 1% Slovak 1% Romanian 1%
- Foreign-born
- 9% · Canada, China, South Korea
- Languages at home
- 70% English-only · Spanish 24% Other Indo-European 2% Chinese 1%
Political lean MEDSL · Nueces
- 2024 margin
- R (+11.5) · D 43.8% · R 55.3%
- 2008→2024 swing
- -7.1pp toward R · 2008: -4.4pp · 2024: -11.5pp
- All cycles
- 2024: R+11.5 2020: R+2.9 2016: R+1.5 2012: R+3.2 2008: R+4.4
Not yet ingested
- Civics
- —
Market trends
- HPI YoY
- ▼ -40.16%
- Current HPI
- 182.3229
- Rent YoY
- ▲ 1.94%
- Metro
- Corpus Christi, TX
- State GDP YoY
- ▲ 3.95%
- F500 in state
- 110
Industry mix (Fortune 500 HQ in TX)
| Industry | F500 HQs | Revenue |
|---|---|---|
| Energy | 16 | $1,198B |
|
||
| Technology | 5 | $198B |
|
||
| Engineering / Construction | 4 | $72B |
|
||
| Energy Services | 3 | $60B |
|
||
| Utilities | 3 | $41B |
|
||
| Healthcare | 2 | $330B |
|
||
Price history
+172.7% since first listed14 events — show timeline
- 2026-05-02 Pending — CBMLS
- 2026-05-01 Delisted — CBMLS
- 2026-04-30 Pending — CBMLS
- 2026-04-21 Delisted — CBMLS
- 2026-04-13 Listed $225,000 CBMLS
- 2026-04-11 Rental Removed $1,995 CBMLS
- 2026-04-03 Listed for Rent $1,995 CBMLS
- 2026-04-03 Rental Removed $1,995 APPFOLIO
- 2026-04-02 Listed for Rent $1,995 APPFOLIO
- 2021-11-12 Sold (Public Records) — Public Records
- 1998-06-15 Sold (Public Records) $80,000 Public Records
- 1998-06-15 Sold (MLS) — CBMLS
- 1998-02-01 Listed $82,500 CBMLS
- 1996-11-12 Listed $82,500 CBMLS
Property tax history
+3.5%/yrLatest (2025): $4,662 · -2.0% YoY. Source: county tax records.
Cash-flow waterfall
monthlySold comps — $/sqft
last 12 mo · ≤1 miLoading sold comps…