 🏗️ New Construction
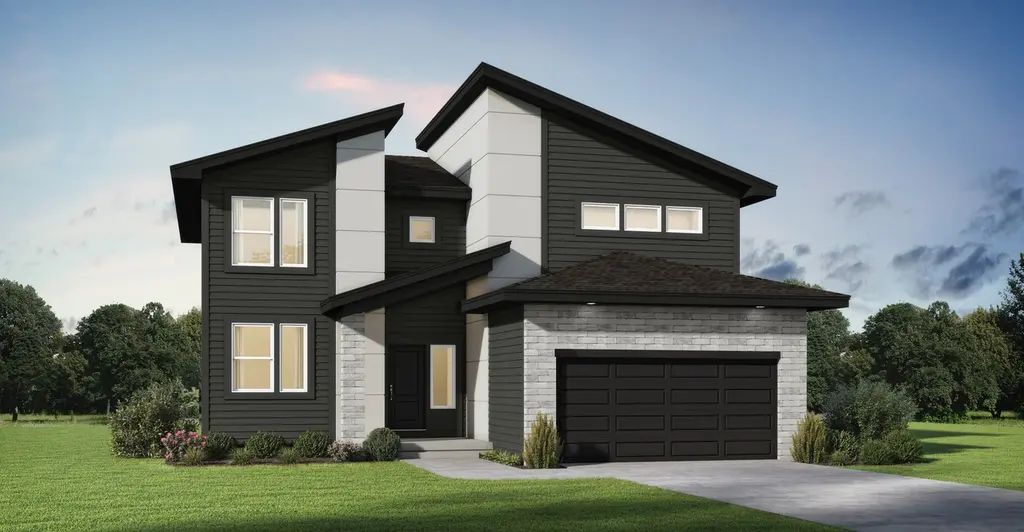
Riverside Plan · Kansas City, MO
Flood risk 1/10 · Minimal
- FEMA flood zone
- X (unshaded)
- Chance of flooding over 30 yrs
- 0.0%
- Est. flood insurance / yr
- $507 – $1,088
Fire risk 4/10 · Minor
- Est. fire insurance / yr
- $1,054 – $1,958
Heat risk 4/10 · Minor
- Hot days now (above 105°F)
- 7 days/yr
- Hot days in 30 yrs
- 16 days/yr
Wind risk 2/10 · Minimal
- Chance of severe wind over 30 yrs
- —
Air-quality risk 3/10 · Minor
- Unhealthy air days now
- 3 days/yr
- Unhealthy air days in 30 yrs
- 4 days/yr
Risk factors via First Street. Map © Google.
Why this score? — see what drove the F grade
The composite is a weighted blend of 9 inputs, each scored 0–100. Each bar is that input's sub-score; the figure is the points it added to the 100-point composite (weight × sub-score).
- ARV discount +7.5/15.0
- Cash flow +6.0/30.0
- Rent growth +4.9/5.0
- Schools +4.5/10.0
- Condition / age +4.0/5.0
- Livability +3.9/5.0
- 1% rule +1.3/10.0
- DSCR +0.3/10.0
- Appreciation +0.0/10.0
$431,200
🖨 Deal sheet 📄 Offer letter ✓ Due diligence
Listing remarks MLS
Our Riverside home plan is a stylish 2-story lifestyle plan featuring 5 bedrooms and 3 bathrooms. Through the front door, you're greeted by a lovely foyer that to an open layout that seamlessly connects the great room, dining area, and kitchen with a walk-in pantry. In addition, the main floor has a full bedroom and bathroom. Upstairs, you'll find the primary suite, three additional bedrooms, and a convenient laundry room that connects directly to the primary closet for easy access. Looking for additional space? Consider finishing the lower level to include a rec room, another bedroom, and an extra bathroom, enhancing the versatility and functionality of your home.
Key facts
- 3 parking spots
- Listed 196 days
Neighborhood map
What this means for you Summary
Snapshot
- This is a 5-bed/3.0-bath single-family listed at $431k. Condition is rated good.
Deal economics
- At list price, monthly cash flow is $-937 ($-11k/yr) — negative.
- To cash-flow at today's rent, offer at most $353k (18.1% below list).
- To meet the 1% rule (rent ≥ 1% of price), the offer needs to be $309k (28.3% below list).
- Recommended offer: $309k (28.3% below list) — sets the bar for 1% rule.
Location & tenants
- Location reads 78/100 on livability (#28 in MO, #2,671 nationally) — a middle-class / working-renter tenant base. Strengths: amenities A+, commute A+, cost of living A+; Watch: schools C-, crime F.
- Liberty 53 (suburban): math 41% / reading 59% proficiency, ranked #24 of 324 in MO (top 7%) — acceptable for families but not a draw, mixed tenant base, ~2y average lease; only 15% free/reduced lunch — higher-income household profile.
- Market conditions: Rents rising fast (+9.5%/yr); 240 active listings in the ZIP; high-income renter base; 341 units permitted in Clay County in 2024 (40 in 5+ unit buildings).
Forward outlook
- Local home prices are declining (-3.0%/yr); year-one equity from $3k of loan paydown is wiped out by about $15k of value loss. Plan a longer hold.
- Clay County population projected at +24% by 2050 — long-run rental-demand tailwind backs the buy-and-hold thesis.
Negotiation context
- It's been on market 196 days — a 12% lower offer ($379k) is reasonable based on typical stale-listing flexibility.
Questions for the listing agent
- What do current leases actually rent for vs. the listed asking? Can we see a recent rent roll and the last 12 months of T-12 income?
- It's been on market 196 days. Have you received any prior offers? Is the seller open to a 28% concession, seller financing, or rate buy-down credit?
- Why hasn't it sold? Are there any deal-killer items the seller is aware of (foundation, flood, title, zoning, code violations)?
- Is there a deadline driving the sale (1031 exchange, divorce, estate, relocation)? That informs how much negotiation room exists.
- Crime grade is F in this area — have there been break-ins, vandalism, or insurance claims at this property in the last 3 years? What carrier currently insures it and at what premium?
- The area grade is low — what's the realistic commute time and amenity access for the typical tenant pool here? Any planned neighborhood developments (good or bad) we should know about?
- What's the average days-on-market for RENTAL listings here right now (not sales)? A rising rental-DOM trend means longer vacancies and softer asking-rent achievability than the comps imply.
- What's the recent tenant-quality profile in this submarket — average credit score on applications, eviction rate, late-payment / NSF rate, and stable-employment percentage? A property-management company in the area should have these aggregated.
- How much new for-sale + rental construction is in the pipeline within 1–3 miles? Heavy new supply typically softens prices + rents 12–24 months out; constrained supply supports both.
Investment metrics
- 1% rule
- 0.63% ✗
- Cap rate
- 3.99%
- Cash-on-cash
- -8.21%
- DSCR
- 0.63
- GRM
- 13.2
CMA / ARV
- ARV (median comp)
- $488,945
- List price
- $431,200
- Delta
- -11.81%
- Verdict
- UNDERPRICED
- Comps
- 20 within 1.0 mi
Show comp detail 12 sales within ~0.75 mi
| Address | Dist | Beds/Ba | Sqft | Sold | Price | $/sf | Match |
|---|---|---|---|---|---|---|---|
| 11112 N Glenwood Ave | 0.04mi | 4/3.5 (-1) | 2,362 (-7%) | 4mo | $472,000 | $200 | 77 |
| 9003 NE 111th Pl | 0.30mi | 4/3.0 (-1) | 2,652 (+4%) | 0mo | $525,000 | $198 | 73 |
| 9406 NE 111th Ter | 0.08mi | 4/3.0 (-1) | 2,329 (-8%) | 6mo | $489,950 | $210 | 72 |
| 11014 N Crescent Ct | 0.06mi | 4/2.5 (-1) | 2,251 (-11%) | 4mo | $433,000 | $192 | 68 |
| 9214 NE 110th Ter | 0.15mi | 4/3.5 (-1) | 2,323 (-8%) | 4mo | $480,000 | $207 | 68 |
| 9421 NE 111th Pl | 0.09mi | 4/2.5 (-1) | 2,251 (-11%) | 3mo | $455,699 | $202 | 68 |
| 9110 NE 111th Pl | 0.18mi | 4/3.0 (-1) | 2,329 (-8%) | 6mo | $430,500 | $185 | 68 |
| 11024 N Glenwood Ave | 0.07mi | 4/2.5 (-1) | 2,251 (-11%) | 6mo | $438,950 | $195 | 66 |
| 9004 NE 111th Pl | 0.31mi | 5/3.5 | 2,803 (+10%) | 1mo | $555,000 | $198 | 66 |
| 10900 N Oxford Ave | 0.46mi | 4/3.0 (-1) | 2,500 (-2%) | 7mo | $399,999 | $160 | 65 |
| 11021 N Crescent Ct | 0.11mi | 4/2.5 (-1) | 2,251 (-11%) | 6mo | $477,939 | $212 | 64 |
| 9304 NE 109th Ter | 0.27mi | 5/3.0 | 2,872 (+13%) | 6mo | $479,000 | $167 | 60 |
Match score weights: distance 35% · size 25% · config 20% · recency 20%. Top-matched comps best support the ARV.
Projected returns pro-forma
-3.0% appreciation · 8.0% rent growth · sell at horizon
- IRR
- -25.4%
- Equity multiple
- 0.11×
- Total profit
- $-122,527
- Equity at exit
- $72,903
- IRR
- -11.0%
- Equity multiple
- 0.20×
- Total profit
- $-109,000
- Equity at exit
- $42,275
Cash invested: $136,905 (down + closing). Projections, not guarantees.
Landlord ↔ Tenant lean methodology
- Overall (STATE)
- 81 Strongly Landlord-Friendly
- State Missouri
- 81 Strongly Landlord-Friendly · R+10
- County
- — inherits STATE
- City
- — inherits STATE
ZIP-level market 64157
- Home prices YoY
- -18.1%
- Rents YoY
- 9.5%
- Active inventory
- 240
- Price-to-rent
- 11.6×
Monthly cashflow live
- Estimated rent
- $3,091 medium interval (Pro) →
- Mortgage (P&I)
- −$2,564
- Tax est. 1.5%
- −$611 /mo · $7,334/yr
- Insurance
- −$204
- HOA
- −$0
- Vacancy / Maint / Mgmt
- −$649
- Net cashflow
- $-937
Break-even live
UW: 25.0% down · 7.5% · 30yr · 1.5% tax · 5.0% vac · 8.0% maint · 8.0% mgmt
Financing live
Cash to close
- Down payment
- $122,236
- Closing costs
- $14,668
- Reserves months
- —
- Total cash needed
- —
Loan-product check · same deal, 3 products live
Conventional
25% down · 7.5% · 30yr
- Down + closing
- —
- Monthly P&I
- —
- Monthly cashflow
- —
- DSCR
- —
- Eligible?
- —
Personal DTI + credit; lowest rate.
DSCR
20% down · 8.5% · 30yr
- Down + closing
- —
- Monthly P&I
- —
- Monthly cashflow
- —
- DSCR
- —
- Eligible?
- —
No personal income docs; deal must DSCR.
Hard money
10% down · 12.0% · 12mo
- Down + closing
- —
- Monthly P&I
- —
- Monthly cashflow
- —
- DSCR
- —
- Eligible?
- —
Short-term bridge; refi at stabilization.
Listing history 14 events
-
2026-06-18days on market $431,200 Active 196 DOM
-
2026-06-17days on market $431,200 Active 195 DOM
-
2026-06-16days on market $431,200 Active 194 DOM
-
2026-06-15days on market $431,200 Active 193 DOM
-
2026-06-13days on market $431,200 Active 191 DOM
-
2026-06-09days on market $431,200 Active 187 DOM
-
2026-06-08days on market $431,200 Active 186 DOM
-
2026-06-07days on market $431,200 Active 185 DOM
-
2026-06-03days on market $431,200 Active 181 DOM
-
2026-06-02days on market $431,200 Active 180 DOM
-
2026-06-01days on market $431,200 Active 179 DOM
-
2026-05-31days on market $431,200 Active 178 DOM
-
2026-01-02price $431,200 673-char remark
Show marketing remark (673 chars)
Our Riverside home plan is a stylish 2-story lifestyle plan featuring 5 bedrooms and 3 bathrooms. Through the front door, you're greeted by a lovely foyer that to an open layout that seamlessly connects the great room, dining area, and kitchen with a walk-in pantry. In addition, the main floor has a full bedroom and bathroom. Upstairs, you'll find the primary suite, three additional bedrooms, and a convenient laundry room that connects directly to the primary closet for easy access. Looking for additional space? Consider finishing the lower level to include a rec room, another bedroom, and an extra bathroom, enhancing the versatility and functionality of your home.
-
2025-12-04$447,300 Active 673-char remark
Show marketing remark (673 chars)
Our Riverside home plan is a stylish 2-story lifestyle plan featuring 5 bedrooms and 3 bathrooms. Through the front door, you're greeted by a lovely foyer that to an open layout that seamlessly connects the great room, dining area, and kitchen with a walk-in pantry. In addition, the main floor has a full bedroom and bathroom. Upstairs, you'll find the primary suite, three additional bedrooms, and a convenient laundry room that connects directly to the primary closet for easy access. Looking for additional space? Consider finishing the lower level to include a rec room, another bedroom, and an extra bathroom, enhancing the versatility and functionality of your home.
ⓘ Source: listings_history table (triggers on properties + properties_extension) + one-shot
backfill from property_details.listing_events for pre-trigger history.
Climate risk First Street
- Flood 1/10 Low FEMA zone X (unshaded) · 0% chance over 30 yrs
- Wildfire 4/10 Moderate
- Heat 4/10 Moderate 7 d/yr ≥105°F today · 16 d/yr by 30 yrs out
- Wind 2/10 Low
- Air quality 3/10 Moderate 3 unhealthy d/yr today · 4 by 30 yrs out
Nearby sold comps map
Loading sold comps map…
Walkable amenities ~0.75 mi
Loading nearby amenities…
Taxation est. · year 1
- Rental income
- $37,093
- − Mortgage interest
- −$27,389
- − Property taxes
- −$7,334
- − Insurance
- −$2,445
- − Repairs & maintenance
- −$2,967
- − Management
- −$2,967
- − Depreciation
- −$14,224
- Taxable loss
- −$20,233
- Est. tax savings @ 24.0%
- +$4,856
- After-tax cash flow
- $-6,388/yr
For passive investors: Depreciation is non-cash, so a rental often shows a tax loss while cash-flowing — sheltering income. Rental losses are passive: they offset passive income freely, and up to $25,000/yr can offset ordinary (W-2) income if you actively participate and your MAGI is under $100k (phasing out to $0 by $150k); unused losses carry forward. On sale, claimed depreciation is recaptured at up to 25%, and gains may owe capital-gains tax (a 1031 exchange can defer both). Figures are a year-1 estimate at your 24.0% rate — not tax advice; consult a CPA.
Condition & rehab AI · 12 photos
This well-maintained, modern home with a good condition score is ready for immediate occupancy. It offers a good return on investment with minor updates that can significantly enhance its value.
Value-add opportunities
- Both Painting the exterior and interior walls — Fresh paint enhances curb appeal and interior aesthetics.
- Both Landscaping improvements — Enhances curb appeal and adds value to the property.
- Resale Upgrading the kitchen appliances — Modern appliances improve the home's appeal to potential buyers.
- Both Adding smart home features — Enhances convenience and adds value to the property.
- Both Upgrading the HVAC system — Improved comfort and energy efficiency attract buyers and renters alike.
Renovation cost estimate screening
Value-add ROI direction
- Both Painting the exterior and interior walls — Fresh paint enhances curb appeal and interior aesthetics. ↑
- Both Landscaping improvements — Enhances curb appeal and adds value to the property. ↑
- Resale Upgrading the kitchen appliances — Modern appliances improve the home's appeal to potential buyers. ↑
- Both Adding smart home features — Enhances convenience and adds value to the property. ↑
- Both Upgrading the HVAC system — Improved comfort and energy efficiency attract buyers and renters alike. ↑
ⓘ Cost ranges are severity-bucket heuristics (US national rule-of-thumb). Get contractor quotes + a written scope before underwriting a rehab budget.
Schools (NCES district)
- District
- Liberty 53
- NCES district ID
- 2918540
- Math proficiency
- 41% ▼ -9.00%
- Reading proficiency
- 59% ▼ -3.00%
- Median HH income
- $78,226
- Composite
- 45.41/100
- National rank
- #2624
- State rank
- #24 of 324 in MO
Livability — Kansas City
- Score
- 78/100
- State rank
- #28
- US rank
- #2671
Category grades
Schools grade is shown separately in the Schools card above.
Census & demographics
- Census place
- Kansas City, MO
- County
- Clay County · 220,651 people
- City population
- 439,467
- Metro
- Kansas City, MO-KS
- Population (ZIP)
- 23,030
- Household income
- $149,526
- Rent vs Own
- Severe rent burden
- 87.0
Population outlook (Clay County) Hauer SSP2
- Today (2025)
- 266,022 people
- By 2030
- 280,057 · +5.3%
- By 2040
- 306,153 · +15.1%
- By 2050
- 328,630 · +23.5%
- By 2075
- 375,182 · +41.0%
- By 2100
- 392,861 · +47.7%
Race, ethnicity, and origin ACS 2023
- Neighborhood character
- Predominantly White (82%)
- Race & ethnicity
- White 82% Asian 7% Two or more races 6% Hispanic / Latino 5% Black 3%
- Common ancestry
- Slovak 3% Italian 2% Lithuanian 2%
- Foreign-born
- 6% · Canada, Vietnam, China
- Languages at home
- 92% English-only · Spanish 3% Other Asian/Pacific 2% Vietnamese 1%
Political lean MEDSL · Clay
- 2024 margin
- Lean R (+5.6) · D 46.4% · R 52.0% · Other 1.6%
- 2008→2024 swing
- -4.9pp toward R · 2008: -0.7pp · 2024: -5.6pp
- All cycles
- 2024: R+5.6 2020: R+4.1 2016: R+11.1 2012: R+8.4 2008: R+0.7
Not yet ingested
- Civics
- —
Market trends
- HPI YoY
- ▼ -43.38%
- Current HPI
- 195.9921
- Rent YoY
- ▲ 9.50%
- Metro
- Kansas City, MO-KS
- State GDP YoY
- ▲ 1.84%
- F500 in state
- 20
Industry mix (Fortune 500 HQ in MO)
| Industry | F500 HQs | Revenue |
|---|---|---|
| Healthcare | 1 | $163B |
|
||
| Insurance | 1 | $21B |
|
||
| Industrial Technology | 1 | $17B |
|
||
| Retail | 1 | $16B |
|
||
| Industrial Distribution | 1 | $10B |
|
||
| Utilities | 1 | $9B |
|
||
Price history
-3.6% since first listed2 events — show timeline
- 2026-01-02 Price Changed $431,200 Zillow
- 2025-12-04 Listed $447,300 Zillow
Cash-flow waterfall
monthlySold comps — $/sqft
last 12 mo · ≤1 miLoading sold comps…