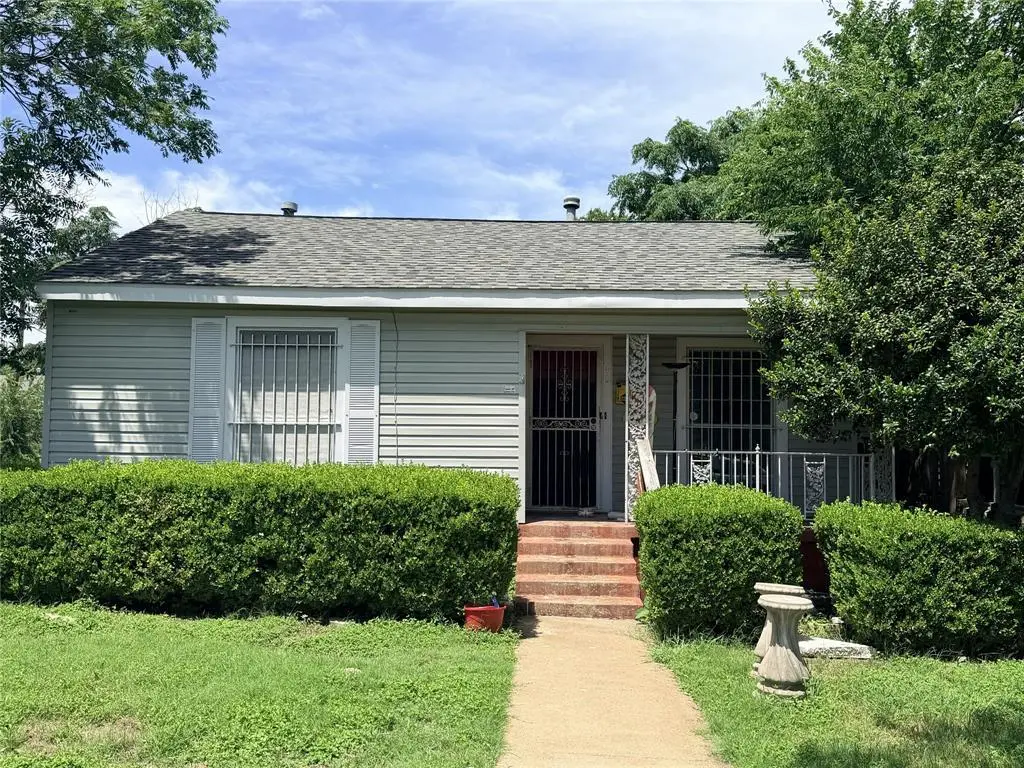
4044 Stanley Ave · Fort Worth, TX
Flood risk 1/10 · Minimal
- FEMA flood zone
- X (unshaded)
- Chance of flooding over 30 yrs
- 0.0%
- Est. flood insurance / yr
- $507 – $1,088
Fire risk 1/10 · Minimal
- Est. fire insurance / yr
- $1,222 – $2,270
Heat risk 7/10 · Major
- Hot days now (above 109°F)
- 7 days/yr
- Hot days in 30 yrs
- 23 days/yr
Wind risk 4/10 · Minor
- Chance of severe wind over 30 yrs
- 24.0%
Air-quality risk 3/10 · Minor
- Unhealthy air days now
- 3 days/yr
- Unhealthy air days in 30 yrs
- 4 days/yr
Risk factors via First Street. Map © Google.
Why this score? — see what drove the B+ grade
The composite is a weighted blend of 9 inputs, each scored 0–100. Each bar is that input's sub-score; the figure is the points it added to the 100-point composite (weight × sub-score).
- Cash flow +30.0/30.0
- ARV discount +15.0/15.0
- 1% rule +10.0/10.0
- DSCR +10.0/10.0
- Livability +4.0/5.0
- Rent growth +2.7/5.0
- Condition / age +2.5/5.0
- Schools +2.0/10.0
- Appreciation +0.0/10.0
$120,000
🖨 Deal sheet (PDF) 📄 Offer letter ✓ Due diligence
Listing remarks MLS
Great property and in great condition on a oversized corner lot. This home has large bedrooms, laminate floors, and a back den that would make a great game room. There is a patio in back and a covered front porch. Property is also located near the local park
Key facts
- Sizable backyard
- Garage
- Built 1949
Tags
Property features AI
Finance
- Other: Deed restrictions and unknown encumbrance(s) noted
- Financial info: Listing terms: Cash; Special listing conditions: Short sale (standard); Loan type: Treat as clear; Second mortgage: None
- HOA & community: No homeowners association; Community features include curbs and sidewalks
Exterior
- Parking: Driveway; On-street parking; Covered parking (1 space); Carport (1 space); Attached garage with 1 garage space and a single 2-car door
- Security: Security features: Unknown
- Utilities: City water; City sewer; Cable available; Underground utilities; All-weather road access; Concrete, curbs and sidewalks present
- Home design: Single-family residence; Residential property; One story; Preowned (built 1949)
- Construction: Siding exterior; Composition/shingle roof; Pillar/post/pier foundation; Year built 1949
- Exterior features: Corner lot; Large backyard with grass; Subdivision setting; Wood fencing; Easements for utilities; Grassed vegetation
Interior
- Kitchen: Disposal; Kitchen approximately 14 x 10
- Bedrooms: Three bedrooms (all on the main level); Primary bedroom approximately 9 x 13; Second bedroom approximately 10 x 13; Third bedroom approximately 13 x 11
- Flooring: Ceramic tile; Laminate
- Bathrooms: Two full bathrooms
- Heating & cooling: Central heating; Central air; Ceiling fan(s)
- Interior features: High-speed internet available; Five total rooms; Two living areas; One dining area; One-level home
- Laundry & utility: Full-size washer/dryer area; Washer hookup; Electric dryer hookup; Utility room
Neighborhood map
What this means for you Summary
Snapshot
- This is a 3-bed/2.0-bath single-family listed at $120k.
Deal economics
- At list price, monthly cash flow is $823 ($10k/yr) — positive.
- The deal already cash-flows at list — no discount required.
- Meets the 1% rule at list price ($2k rent vs $120k).
- Cap rate 14.5% vs local median 3.9% in Fort Worth — top-decile yield for the area; either an underpriced asset or a hidden risk that comps aren't pricing in. Stress-test before assuming the spread holds.
Location & tenants
- Location reads 80/100 on livability (#49 in TX, #1,954 nationally) — a professional / high-income tenant draw. Strengths: amenities A+, cost of living A+, housing A+; Watch: schools D+, crime F.
- Fort Worth ISD (urban): math 18% / reading 28% proficiency, ranked #742 of 826 in TX (top 90%) — low school quality limits family demand, transient renter base, plan for 1-2y turnover; 73% free/reduced lunch — lower-income household profile, screen leases tightly.
- Market conditions: Rents flat; 151 active listings in the ZIP; 40 comparable units currently listed for rent nearby; rentals at typical pace (median 25d on market — plan ~3-4 weeks tenant-placement turnaround); 40% of comp listings sitting > 30 days — soft ceiling on asking rent; 18,938 units permitted in Tarrant County in 2024 (8,336 in 5+ unit buildings).
- This rent runs 39% of the median local income ($70k/yr) — at the standard rent-burdened threshold; future hikes will face affordability resistance.
Forward outlook
- Local home prices are declining (-3.0%/yr); year-one equity from $830 of loan paydown is wiped out by about $4k of value loss. Plan a longer hold.
- Tarrant County population projected at +41% by 2050 — long-run rental-demand tailwind backs the buy-and-hold thesis.
- At projected returns (-3.0% appreciation + 0.7% rent growth), your $34k cash investment doubles in ~5 years — after that, you're playing with house money.
Negotiation context
- Only 3 days on market — expect competitive offers; lowballing is unlikely to land.
- 2 sale attempts since 16y ago with the ask held roughly flat each time — persistent listings suggest the price (not the market) is what's stuck; bring a comps-based counter.
Risks & watch-outs
- Watch-outs: property tax is 2.9% of price; built in 1949 — expect roof / HVAC / electrical / plumbing capex.
- Climate carrying-cost: extreme-heat days projected 7→23/yr by 2055 (HVAC capex compounding) — expect insurance premiums to compound above CPI over the hold.
Questions for the listing agent
- Built in 1949 — when were the roof, HVAC, electrical panel, plumbing, and water heater last replaced?
- Property tax is high relative to price — has the assessment been appealed recently, and will the sale trigger a re-assessment?
- Is there a deadline driving the sale (1031 exchange, divorce, estate, relocation)? That informs how much negotiation room exists.
- Schools are D-rated, which usually means shorter tenancies and higher turnover. Who's the typical renter profile here, and what's been the actual vacancy rate?
- Crime grade is F in this area — have there been break-ins, vandalism, or insurance claims at this property in the last 3 years? What carrier currently insures it and at what premium?
- What's the average days-on-market for RENTAL listings here right now (not sales)? A rising rental-DOM trend means longer vacancies and softer asking-rent achievability than the comps imply.
- What's the recent tenant-quality profile in this submarket — average credit score on applications, eviction rate, late-payment / NSF rate, and stable-employment percentage? A property-management company in the area should have these aggregated.
- How much new for-sale + rental construction is in the pipeline within 1–3 miles? Heavy new supply typically softens prices + rents 12–24 months out; constrained supply supports both.
Investment metrics
- 1% rule
- 1.89% ✓
- Cap rate
- 14.52%
- Cash-on-cash
- 29.38%
- DSCR
- 2.31
- GRM
- 4.4
CMA / ARV
- ARV (on-the-fly)
- $233,160
- Comps found
- 12
Show comp detail 12 sales within ~0.75 mi
| Address | Dist | Beds/Ba | Sqft | Sold | Price | $/sf | Match |
|---|---|---|---|---|---|---|---|
| 3758 Wayside Ave | 0.50mi | 3/2.0 | 1,336 (-0%) | 2mo | $299,999 | $225 | 74 |
| 4113 Wayside Ave | 0.30mi | 3/2.0 | 1,301 (-3%) | 11mo | $194,999 | $150 | 71 |
| 3600 Gordon Ave | 0.58mi | 3/2.0 | 1,288 (-4%) | 7mo | $269,900 | $210 | 60 |
| 3901 Frazier Ave | 0.32mi | 3/1.5 | 1,483 (+11%) | 7mo | $220,000 | $148 | 60 |
| 4213 6th Ave | 0.40mi | 4/2.0 (+1) | 1,495 (+12%) | 7mo | $259,900 | $174 | 51 |
| 3829 Willing Ave | 0.41mi | 3/2.0 | 1,168 (-13%) | 10mo | $199,000 | $170 | 51 |
| 4132 Merida Ave | 0.55mi | 4/2.0 (+1) | 1,396 (+4%) | 15mo | $259,999 | $186 | 50 |
| 1345 W Boyce Ave | 0.68mi | 3/1.0 | 1,320 (-2%) | 18mo | $189,999 | $144 | 47 |
| 4233 Lubbock Ave | 0.60mi | 3/2.0 | 1,509 (+13%) | 6mo | $268,500 | $178 | 46 |
| 1600 W Felix St | 0.70mi | 3/2.0 | 1,404 (+5%) | 17mo | $180,000 | $128 | 45 |
| 3759 S Adams St | 0.69mi | 3/2.0 | 1,478 (+10%) | 14mo | $260,000 | $176 | 39 |
| 3545 Ryan Ave | 0.65mi | 2/1.0 (-1) | 1,160 (-13%) | 8mo | $190,000 | $164 | 31 |
Match score weights: distance 35% · size 25% · config 20% · recency 20%. Top-matched comps best support the ARV.
Projected returns pro-forma
-3.0% appreciation · 0.7% rent growth · sell at horizon
- IRR
- 21.0%
- Equity multiple
- 1.83×
- Total profit
- $27,944
- Equity at exit
- $17,892
- IRR
- 27.5%
- Equity multiple
- 3.15×
- Total profit
- $72,186
- Equity at exit
- $10,375
Cash invested: $33,600 (down + closing). Projections, not guarantees.
Landlord ↔ Tenant lean methodology
- Overall (STATE)
- 87 Strongly Landlord-Friendly
- State Texas
- 87 Strongly Landlord-Friendly · R+5
- County
- — inherits STATE
- City
- — inherits STATE
ZIP-level market 76110
- Rents YoY
- 0.7%
- Active inventory
- 151
- Price-to-rent
- 4.4×
Monthly cashflow live
- Estimated rent
- $2,268 high interval (Pro) →
- Mortgage (P&I)
- −$629
- Tax from tax record
- −$290 /mo · $3,481/yr
- Insurance
- −$50
- HOA
- −$0
- Vacancy / Maint / Mgmt
- −$476
- Net cashflow
- $823
Break-even live
Sensitivity live
| Price | -10% $891 | -5% $857 | +0% $823 | +5% $789 | +10% $755 |
|---|---|---|---|---|---|
| Rent | -10% $644 | -5% $733 | +0% $823 | +5% $912 | +10% $1,002 |
| Rate | -1.0pp $883 | -0.5pp $853 | base $823 | +0.5pp $792 | +1.0pp $760 |
UW: 25.0% down · 7.5% · 30yr · 1.5% tax · 5.0% vac · 8.0% maint · 8.0% mgmt
Financing live
Cash to close
- Down payment
- $30,000
- Closing costs
- $3,600
- Reserves months
- —
- Total cash needed
- —
Loan-product check · same deal, 3 products live
Conventional
25% down · 7.5% · 30yr
- Down + closing
- —
- Monthly P&I
- —
- Monthly cashflow
- —
- DSCR
- —
- Eligible?
- —
Personal DTI + credit; lowest rate.
DSCR
20% down · 8.5% · 30yr
- Down + closing
- —
- Monthly P&I
- —
- Monthly cashflow
- —
- DSCR
- —
- Eligible?
- —
No personal income docs; deal must DSCR.
Hard money
10% down · 12.0% · 12mo
- Down + closing
- —
- Monthly P&I
- —
- Monthly cashflow
- —
- DSCR
- —
- Eligible?
- —
Short-term bridge; refi at stabilization.
Rent comps 40 comps
| Address | Beds | Baths | Sqft | Rent | $/sqft | DOM | Units | Dist |
|---|---|---|---|---|---|---|---|---|
| 4201 William Fleming Ct W Fort Worth, TX | 2.0 | 1.5–2.0 | 865 | $1,450 | $1.68 | 2d | 104 | 0.20mi |
| 3437 Stanley Ave Fort Worth, TX | 2.0 | 1.0 | 1000 | $1,500 | $1.50 | 44d | 1 | 0.77mi |
| 1000 W Hammond St Fort Worth, TX | 2.0 | 1.0 | 900 | $1,600 | $1.78 | 25d | 1 | 0.81mi |
| 3445 Frazier Ave Fort Worth, TX | 3.0 | 2.5 | 1540 | $2,200 | $1.43 | 44d | 1 | 0.84mi |
| 3411 8th Ave Fort Worth, TX | 3.0 | 2.0 | 1280 | $1,700 | $1.33 | 5d | 1 | 0.84mi |
| 2800 W Fuller Ave Fort Worth, TX | 3.0 | 1.5 | 1161 | $1,650 | $1.42 | 44d | 1 | 0.91mi |
| 3500 College Ave Fort Worth, TX | 3.0 | 1.0 | 1012 | $1,650 | $1.63 | 44d | 1 | 0.96mi |
| 2809 South Hills Ave Fort Worth, TX | 3.0 | 2.0 | 1203 | $1,650 | $1.37 | 44d | 1 | 0.96mi |
| 2809 South Hills Ave Fort Worth, TX | 3.0 | 2.0 | 1203 | $1,650 | $1.37 | 19d | 1 | 0.96mi |
| 3303 8th Ave Fort Worth, TX | 3.0 | 2.0 | 1348 | $2,000 | $1.48 | 25d | 1 | 0.99mi |
| 2716 W Biddison St Fort Worth, TX | 4.0 | 3.0 | 1572 | $4,000 | $2.54 | 13d | 1 | 1.00mi |
| 2908 Binyon Ave Fort Worth, TX | 3.0 | 1.0 | 1249 | $1,775 | $1.42 | 25d | 1 | 1.01mi |
| 3553 Mission St Fort Worth, TX | 4.0 | 2.0 | 1510 | $2,950 | $1.95 | 7d | 1 | 1.02mi |
| 2505 Benbrook Blvd Unit 503 Fort Worth, TX | 3.0 | 3.0 | 1367 | $2,495 | $1.83 | 44d | 1 | 1.04mi |
| 2509 Benbrook Blvd Unit 902 Fort Worth, TX | 3.0 | 3.0 | 1756 | $2,595 | $1.48 | 44d | 1 | 1.05mi |
| 2521 Benbrook Blvd Fort Worth, TX | 3.0 | 3.0 | 1849 | $4,000 | $2.16 | 5d | 1 | 1.05mi |
| 3605 Jeanette Dr Fort Worth, TX | 3.0 | 2.0 | 1660 | $3,200 | $1.93 | 25d | 1 | 1.08mi |
| 3104 Medina Ave Fort Worth, TX | 3.0 | 2.0 | 1355 | $1,850 | $1.37 | 23d | 1 | 1.11mi |
| 3241 Sandage Ave Fort Worth, TX | 3.0 | 2.0 | 1115 | $3,000 | $2.69 | 19d | 1 | 1.12mi |
| 1246 Lowe St Fort Worth, TX | 3.0 | 2.5 | 1752 | $1,895 | $1.08 | 15d | 1 | 1.16mi |
| 3201 Forest Park Blvd Fort Worth, TX | 4.0 | 4.0 | 1772 | $3,750 | $2.12 | 19d | 1 | 1.16mi |
| 3419 S University Dr Unit D Fort Worth, TX | 2.0 | 1.0 | 900 | $1,095 | $1.22 | 17d | 1 | 1.17mi |
| 3417 S University Dr Unit A Fort Worth, TX | 2.0 | 1.0 | 1059 | $1,095 | $1.03 | 5d | 1 | 1.18mi |
| 3417 S University Dr Unit D Fort Worth, TX | 2.0 | 1.0 | 900 | $1,235 | $1.37 | 44d | 1 | 1.18mi |
| 3136 Wayside Ave Fort Worth, TX | 3.0 | 2.5 | 1875 | $3,000 | $1.60 | 7d | 1 | 1.19mi |
| 3259 Binyon Ave Fort Worth, TX | 3.0 | 1.0 | 1260 | $2,200 | $1.75 | 14d | 1 | 1.20mi |
| 3616 Harwen Ter Fort Worth, TX | 3.0 | 2.0 | 1664 | $3,300 | $1.98 | 44d | 1 | 1.21mi |
| 205 E Fogg St Fort Worth, TX | 4.0 | 2.0 | 1350 | $2,100 | $1.56 | 44d | 1 | 1.22mi |
| 3229 Waits Ave Fort Worth, TX | 4.0 | 3.0 | 1830 | $3,900 | $2.13 | 44d | 1 | 1.22mi |
| 3217 Lubbock Ave Unit B Fort Worth, TX | 3.0 | 3.0 | 1856 | $3,150 | $1.70 | 19d | 1 | 1.23mi |
| 4256 Standish Rd Fort Worth, TX | 3.0 | 2.0 | 1392 | $1,650 | $1.19 | 25d | 1 | 1.23mi |
| 3324 S University Dr Unit Down Fort Worth, TX | 2.0 | 2.0 | 1312 | $1,600 | $1.22 | 5d | 1 | 1.24mi |
| 3329 Hemphill St Fort Worth, TX | 3.0 | 2.0 | 1425 | $2,950 | $2.07 | 44d | 1 | 1.24mi |
| 2800 Sadler Ave Fort Worth, TX | 3.0 | 2.0 | 1811 | $2,300 | $1.27 | 44d | 1 | 1.25mi |
| 4129 Winfield Ave Fort Worth, TX | 3.0 | 2.0 | 1465 | $2,580 | $1.76 | 3d | 1 | 1.25mi |
| 3245 Cockrell Ave Fort Worth, TX | 2.0 | 1.0 | 1402 | $2,500 | $1.78 | 44d | 1 | 1.26mi |
| 4012 Boyd Ave Fort Worth, TX | 3.0 | 2.0 | 1565 | $2,695 | $1.72 | 5d | 1 | 1.27mi |
| 3259 S University Dr Unit A Fort Worth, TX | 3.0 | 3.0 | 1490 | $2,495 | $1.67 | 44d | 1 | 1.27mi |
| 3263 Bilglade Rd Fort Worth, TX | 3.0 | 2.5 | 1687 | $1,995 | $1.18 | 25d | 1 | 1.28mi |
| 3315 Rogers Ave Fort Worth, TX | 3.0 | 1.0 | 1532 | $3,300 | $2.15 | 44d | 1 | 1.28mi |
Listing history 5 events
-
2026-06-07status $120,000 Pending 3 DOM
-
2026-06-04days on market $120,000 Active 3 DOM
-
2026-06-03days on market $120,000 Active 2 DOM
-
2026-06-02remarks 699-char remark
-
2026-06-02$120,000 Active 1 DOM
ⓘ Source: listings_history table (triggers on properties + properties_extension) + one-shot
backfill from property_details.listing_events for pre-trigger history.
Tax reassessment forecast TX · Resets to sale price
- Current annual tax
- $3,481 · $290/mo
- Projected year-2 tax
- $3,481 · $290/mo
- Expected delta
- $0/yr ($0/mo · 0.0%)
ⓘ Screening estimate from a state-policy table — verify with the county assessor before closing.
Climate risk First Street
- Flood 1/10 Low FEMA zone X (unshaded) · 0% chance over 30 yrs
- Wildfire 1/10 Low
- Heat 7/10 Severe 7 d/yr ≥109°F today · 23 d/yr by 30 yrs out
- Wind 4/10 Moderate 24% chance of damaging wind over 30 yrs
- Air quality 3/10 Moderate 3 unhealthy d/yr today · 4 by 30 yrs out
Nearby sold comps map
Loading sold comps map…
Walkable amenities ~0.75 mi
Loading nearby amenities…
Taxation est. · year 1
- Rental income
- $27,222
- − Mortgage interest
- −$6,722
- − Property taxes
- −$3,481
- − Insurance
- −$600
- − Repairs & maintenance
- −$2,178
- − Management
- −$2,178
- − Depreciation
- −$3,491
- Taxable income
- $8,573
- Est. tax owed @ 24.0%
- −$2,057
- After-tax cash flow
- $7,815/yr
For passive investors: Depreciation is non-cash, so a rental often shows a tax loss while cash-flowing — sheltering income. Rental losses are passive: they offset passive income freely, and up to $25,000/yr can offset ordinary (W-2) income if you actively participate and your MAGI is under $100k (phasing out to $0 by $150k); unused losses carry forward. On sale, claimed depreciation is recaptured at up to 25%, and gains may owe capital-gains tax (a 1031 exchange can defer both). Figures are a year-1 estimate at your 24.0% rate — not tax advice; consult a CPA.
Schools (NCES district)
- District
- Fort Worth ISD
- NCES district ID
- 4819700
- Math proficiency
- 18% ▼ -16.00%
- Reading proficiency
- 28% ▼ -6.00%
- Median HH income
- $42,109
- Composite
- 19.61/100
- National rank
- #8753
- State rank
- #742 of 826 in TX
Livability — Fort Worth
- Score
- 80/100
- State rank
- #49
- US rank
- #1954
Category grades
Schools grade is shown separately in the Schools card above.
Census & demographics
- Census place
- Fort Worth, TX
- County
- Tarrant County · 2,033,669 people
- City population
- 911,619
- Metro
- Dallas-Fort Worth-Arlington, TX
- Population (ZIP)
- 33,441
- Household income
- $69,790
- Rent vs Own
- Severe rent burden
- 1471.0
Population outlook (Tarrant County) Hauer SSP2
- Today (2025)
- 2,380,417 people
- By 2030
- 2,578,900 · +8.3%
- By 2040
- 2,974,995 · +25.0%
- By 2050
- 3,350,489 · +40.8%
- By 2075
- 4,216,909 · +77.2%
- By 2100
- 4,741,527 · +99.2%
Race, ethnicity, and origin ACS 2023
- Neighborhood character
- Majority Hispanic (63%)
- Race & ethnicity
- Hispanic / Latino 63% White 30% Two or more races 24% Black 2% Asian 2%
- Hispanic origin (detail)
- Mexican 57%
- Common ancestry
- Slovak 1% Italian 1% Lithuanian 1%
- Foreign-born
- 26% · Canada, China
- Languages at home
- 45% English-only · Spanish 52% Other Asian/Pacific 1% Other Indo-European 1%
Political lean MEDSL · Tarrant
- 2024 margin
- Lean R (+5.1) · D 46.7% · R 51.9% · Other 1.4%
- 2008→2024 swing
- +6.6pp toward D · 2008: -11.7pp · 2024: -5.1pp
- All cycles
- 2024: R+5.1 2020: D+0.2 2016: R+8.7 2012: R+15.7 2008: R+11.7
Not yet ingested
- Civics
- —
Market trends
- HPI YoY
- ▼ -194.46%
- Current HPI
- 274.8888
- Rent YoY
- ▲ 0.70%
- Metro
- Dallas-Fort Worth-Arlington, TX
- State GDP YoY
- ▲ 3.95%
- F500 in state
- 110
Industry mix (Fortune 500 HQ in TX)
| Industry | F500 HQs | Revenue |
|---|---|---|
| Energy | 16 | $1,198B |
|
||
| Technology | 5 | $198B |
|
||
| Engineering / Construction | 4 | $72B |
|
||
| Energy Services | 3 | $60B |
|
||
| Utilities | 3 | $41B |
|
||
| Healthcare | 2 | $330B |
|
||
Price history
+71.4% since first listed6 events — show timeline
- 2026-05-29 Listed $120,000 NTREIS
- 2010-07-08 Sold (Public Records) — Public Records
- 2010-07-02 Sold (MLS) — NTREIS
- 2010-06-03 Listing Removed — NTREIS
- 2010-03-07 Listed $70,000 NTREIS
- 2006-03-31 Sold (Public Records) — Public Records
Property tax history
+4.2%/yrLatest (2025): $3,481 · -9.8% YoY. Source: county tax records.
Cash-flow waterfall
monthlySold comps — $/sqft
last 12 mo · ≤1 miLoading sold comps…