1807 Highway 15 · Richton, MS
Flood risk 9/10 · Severe
- FEMA flood zone
- X (unshaded)
- Chance of flooding over 30 yrs
- 0.99%
- Est. flood insurance / yr
- $507 – $1,088
Fire risk 6/10 · Moderate
- Est. fire insurance / yr
- $1,241 – $2,305
Heat risk 7/10 · Major
- Hot days now (above 107°F)
- 7 days/yr
- Hot days in 30 yrs
- 20 days/yr
Wind risk 8/10 · Major
- Chance of severe wind over 30 yrs
- 99.0%
Air-quality risk 1/10 · Minimal
- Unhealthy air days now
- 0 days/yr
- Unhealthy air days in 30 yrs
- 0 days/yr
Risk factors via First Street. Map © Google.
Why this score? — see what drove the D grade
The composite is a weighted blend of 9 inputs, each scored 0–100. Each bar is that input's sub-score; the figure is the points it added to the 100-point composite (weight × sub-score).
- ARV discount +14.1/15.0
- Cash flow +11.5/30.0
- Livability +3.8/5.0
- DSCR +3.4/10.0
- 1% rule +3.3/10.0
- Schools +2.8/10.0
- Rent growth +2.5/5.0
- Condition / age +2.5/5.0
- Appreciation +0.0/10.0
$145,000
🖨 Deal sheet (PDF) 📄 Offer letter ✓ Due diligence
Listing remarks
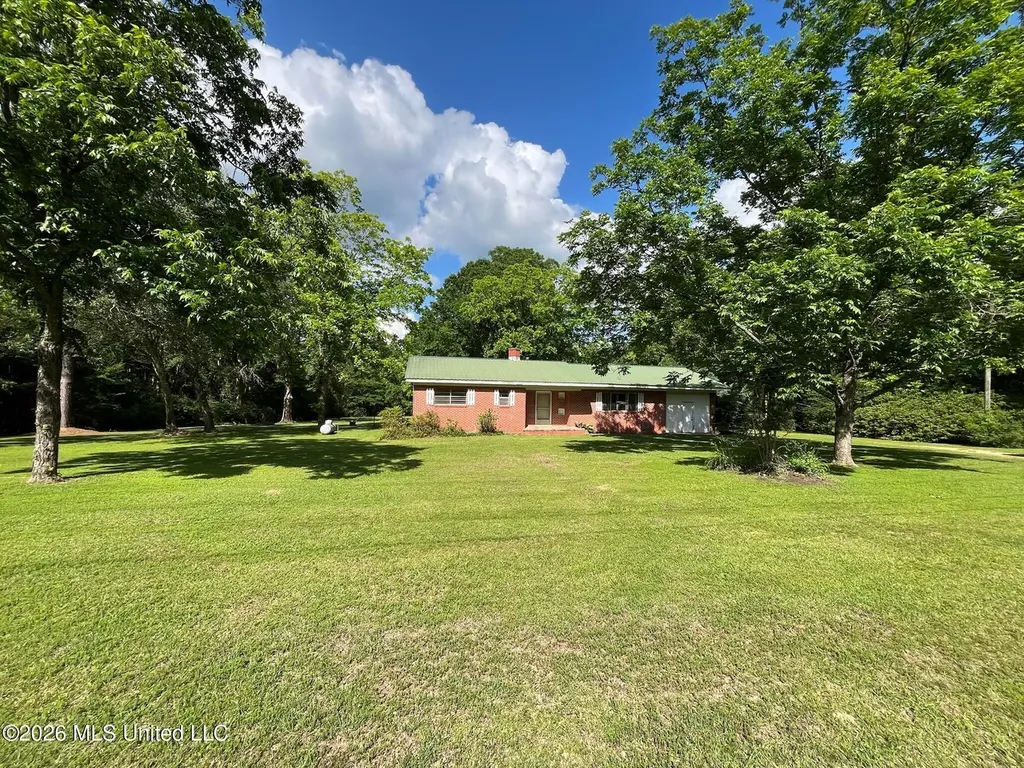
1807 MS-15 A brick home on 9 MOL acres with Hwy 15 frontage in Richton — offering easy access and great visibility. The property is packed with a beautiful mix of pines and hardwoods, with mature pecan trees spaced throughout the yard. The back boundary adjoins timber company land, ensuring a private, wooded setting. The main dwelling offers approximately 1,800 sq ft of living space with 3 bedrooms and 2 bathrooms, topped with a durable metal roof. A former carport has been enclosed to create a separate living area with heating and cooling — great for guests or a home office. Additional improvements include a storage shed and a separate water well on the property (not currently
Key facts
- Mature pecan trees
- Separate living area
- Storage shed
Tags
Property features AI
Exterior
- Parking: Gravel, open parking; no garage
- Utilities: Private sewer; Community water; Electricity connected; Propane connected; Water connected; Fiber to the house
- Home design: Single-family house; One level; Accessible approach with ramp; Accessible features present
- Construction: Brick and wood siding construction; Metal roof; Raised and slab foundation; Built (year source: assessor)
- Exterior features: Slab patio/porch; Views; Wooded lot
Interior
- Flooring: Carpet; Linoleum; Wood
- Bathrooms: 2 bathrooms
- Heating & cooling: Central heating; Space heater; Central air conditioning; Gas cooling
- Interior features: Storage; Has fireplace (fireplace in a bathroom); Crawl space basement
- Laundry & utility: Laundry: Other
Neighborhood map
What this means for you Summary
Snapshot
- This is a 3-bed/1.0-bath single-family listed at $145k.
Deal economics
- At list price, monthly cash flow is $-114 ($-1k/yr) — negative.
- To cash-flow at today's rent, offer at most $129k (11.3% below list).
- To meet the 1% rule (rent ≥ 1% of price), the offer needs to be $121k (16.6% below list).
- Recommended offer: $121k (16.6% below list) — sets the bar for 1% rule.
Location & tenants
- Location reads 75/100 on livability (#12 in MS, #4,165 nationally) — a middle-class / working-renter tenant base. Strengths: crime A+, cost of living A+, health & safety A+; Watch: amenities F, commute F, employment F.
- Richton School District (rural): math 35% / reading 32% proficiency, ranked #57 of 130 in MS (top 44%) — families likely to look elsewhere, expect single-tenant / working-renter base with shorter leases; 62% free/reduced lunch — lower-income household profile, screen leases tightly.
- Zoned schools: Richton Elementary School (math 42% / reading 32%, grade F, #135 of 375 statewide, top 39%, 298 students, 99% FRL); Richton High School (math 27% / reading 27%, grade F, #101 of 197 statewide, top 54%, 299 students, 99% FRL) — zoned schools average 99% FRL vs 62% district-wide (37 pts higher); higher-poverty schools than district average — tighter screening recommended.
- Market conditions: 27 active listings in the ZIP.
Forward outlook
- Local home prices are declining (-3.0%/yr); year-one equity from $1k of loan paydown is wiped out by about $4k of value loss. Plan a longer hold.
- Perry County population projected at -18% by 2050 — secular population decline; favor cash flow + early exit over multi-decade hold.
Negotiation context
- It's been on market 41 days — a 3% lower offer ($141k) is reasonable based on typical stale-listing flexibility.
Risks & watch-outs
- Watch-outs: flood insurance adds $66/mo.
- Climate carrying-cost: severe flood risk; severe wind risk, 99% chance of damaging wind over 30y; major wildfire risk; extreme-heat days projected 7→20/yr by 2055 (HVAC capex compounding) — expect insurance premiums to compound above CPI over the hold.
Questions for the listing agent
- What do current leases actually rent for vs. the listed asking? Can we see a recent rent roll and the last 12 months of T-12 income?
- It's been on market 41 days. Have you received any prior offers? Is the seller open to a 17% concession, seller financing, or rate buy-down credit?
- Built in 1963 — when were the roof, HVAC, electrical panel, plumbing, and water heater last replaced?
- What's the actual annual flood-insurance premium (NFIP or private), and is the property in a SFHA with mandatory coverage?
- Is there a deadline driving the sale (1031 exchange, divorce, estate, relocation)? That informs how much negotiation room exists.
- Schools are D-rated, which usually means shorter tenancies and higher turnover. Who's the typical renter profile here, and what's been the actual vacancy rate?
- The area grade is low — what's the realistic commute time and amenity access for the typical tenant pool here? Any planned neighborhood developments (good or bad) we should know about?
- What's the average days-on-market for RENTAL listings here right now (not sales)? A rising rental-DOM trend means longer vacancies and softer asking-rent achievability than the comps imply.
- What's the recent tenant-quality profile in this submarket — average credit score on applications, eviction rate, late-payment / NSF rate, and stable-employment percentage? A property-management company in the area should have these aggregated.
- How much new for-sale + rental construction is in the pipeline within 1–3 miles? Heavy new supply typically softens prices + rents 12–24 months out; constrained supply supports both.
Investment metrics
- 1% rule
- 0.83% ✗
- Cap rate
- 5.90%
- Cash-on-cash
- -1.40%
- DSCR
- 0.94
- GRM
- 10.0
CMA / ARV
- ARV (median comp)
- $170,000
- List price
- $145,000
- Delta
- -14.71%
- Verdict
- UNDERPRICED
- Comps
- 1 within 2.0 mi
Show comp detail 1 sale within ~0.75 mi
| Address | Dist | Beds/Ba | Sqft | Sold | Price | $/sf | Match |
|---|---|---|---|---|---|---|---|
| 55 Rayburn Pierce | 0.19mi | 4/3.0 (+1) | 1,680 (+8%) | 3mo | $170,000 | $101 | 62 |
Match score weights: distance 35% · size 25% · config 20% · recency 20%. Top-matched comps best support the ARV.
Projected returns pro-forma
-3.0% appreciation · 3.0% rent growth · sell at horizon
- IRR
- -21.9%
- Equity multiple
- 0.24×
- Total profit
- $-30,679
- Equity at exit
- $21,620
- IRR
- -15.6%
- Equity multiple
- 0.12×
- Total profit
- $-35,800
- Equity at exit
- $12,537
Cash invested: $40,600 (down + closing). Projections, not guarantees.
Landlord ↔ Tenant lean methodology
- Overall (STATE)
- 90 Strongly Landlord-Friendly
- State Mississippi
- 90 Strongly Landlord-Friendly · R+11
- County
- — inherits STATE
- City
- — inherits STATE
ZIP-level market 39476
- Active inventory
- 27
- Price-to-rent
- 10.0×
Monthly cashflow live
- Estimated rent
- $1,209 medium interval (Pro) →
- Mortgage (P&I)
- −$760
- Tax est. 1.5%
- −$181 /mo · $2,175/yr
- Insurance
- −$60
- Flood insurance flood zone
- −$66 /mo · $798/yr
- HOA
- −$0
- Vacancy / Maint / Mgmt
- −$254
- Net cashflow
- $-114
Break-even live
Sensitivity live
| Price | -10% $-13 | -5% $-64 | +0% $-114 | +5% $-164 | +10% $-214 |
|---|---|---|---|---|---|
| Rent | -10% $-209 | -5% $-161 | +0% $-114 | +5% $-66 | +10% $-18 |
| Rate | -1.0pp $-41 | -0.5pp $-77 | base $-114 | +0.5pp $-151 | +1.0pp $-190 |
UW: 25.0% down · 7.5% · 30yr · 1.5% tax · 5.0% vac · 8.0% maint · 8.0% mgmt
Financing live
Cash to close
- Down payment
- $36,250
- Closing costs
- $4,350
- Reserves months
- —
- Total cash needed
- —
Loan-product check · same deal, 3 products live
Conventional
25% down · 7.5% · 30yr
- Down + closing
- —
- Monthly P&I
- —
- Monthly cashflow
- —
- DSCR
- —
- Eligible?
- —
Personal DTI + credit; lowest rate.
DSCR
20% down · 8.5% · 30yr
- Down + closing
- —
- Monthly P&I
- —
- Monthly cashflow
- —
- DSCR
- —
- Eligible?
- —
No personal income docs; deal must DSCR.
Hard money
10% down · 12.0% · 12mo
- Down + closing
- —
- Monthly P&I
- —
- Monthly cashflow
- —
- DSCR
- —
- Eligible?
- —
Short-term bridge; refi at stabilization.
Listing history 19 events
-
2026-06-22days on market $145,000 Active 41 DOM
-
2026-06-21days on market $145,000 Active 40 DOM
-
2026-06-21days on market $145,000 Active 39 DOM
-
2026-06-18days on market $145,000 Active 37 DOM
-
2026-06-17days on market $145,000 Active 36 DOM
-
2026-06-16days on market $145,000 Active 35 DOM
-
2026-06-15days on market $145,000 Active 34 DOM
-
2026-06-13days on market $145,000 Active 32 DOM
-
2026-06-12days on market $145,000 Active 31 DOM
-
2026-06-09days on market $145,000 Active 28 DOM
-
2026-06-08days on market $145,000 Active 27 DOM
-
2026-06-07days on market $145,000 Active 26 DOM
-
2026-06-05days on market $145,000 Active 24 DOM
-
2026-06-04days on market $145,000 Active 22 DOM
-
2026-06-02days on market $145,000 Active 21 DOM
-
2026-06-01days on market $145,000 Active 20 DOM
-
2026-05-31days on market $145,000 Active 19 DOM
-
2026-05-12$145,000 Active 829-char remark
-
1981-10-27soldstatus
ⓘ Source: listings_history table (triggers on properties + properties_extension) + one-shot
backfill from property_details.listing_events for pre-trigger history.
Climate risk First Street
- Flood 9/10 Extreme FEMA zone X (unshaded) · 99% chance over 30 yrs
- Wildfire 6/10 Major
- Heat 7/10 Severe 7 d/yr ≥107°F today · 20 d/yr by 30 yrs out
- Wind 8/10 Severe 99% chance of damaging wind over 30 yrs
- Air quality 1/10 Low 0 unhealthy d/yr today · 0 by 30 yrs out
Nearby sold comps map
Loading sold comps map…
Walkable amenities ~0.75 mi
Loading nearby amenities…
Taxation est. · year 1
- Rental income
- $14,504
- − Mortgage interest
- −$8,122
- − Property taxes
- −$2,175
- − Insurance
- −$1,522
- − Repairs & maintenance
- −$1,160
- − Management
- −$1,160
- − Depreciation
- −$4,218
- Taxable loss
- −$3,855
- Est. tax savings @ 24.0%
- +$925
- After-tax cash flow
- $-439/yr
For passive investors: Depreciation is non-cash, so a rental often shows a tax loss while cash-flowing — sheltering income. Rental losses are passive: they offset passive income freely, and up to $25,000/yr can offset ordinary (W-2) income if you actively participate and your MAGI is under $100k (phasing out to $0 by $150k); unused losses carry forward. On sale, claimed depreciation is recaptured at up to 25%, and gains may owe capital-gains tax (a 1031 exchange can defer both). Figures are a year-1 estimate at your 24.0% rate — not tax advice; consult a CPA.
Schools (NCES district)
- District
- Richton School District
- NCES district ID
- 2803870
- Math proficiency
- 35% ▼ -10.00%
- Reading proficiency
- 32% ▲ 1.00%
- Median HH income
- $34,300
- Composite
- 27.62/100
- National rank
- #6925
- State rank
- #57 of 130 in MS
Livability — Richton
- Score
- 75/100
- State rank
- #12
- US rank
- #4165
Category grades
Schools grade is shown separately in the Schools card above.
Census & demographics
- Population (ZIP)
- 6,336
Population outlook (Perry County) Hauer SSP2
- Today (2025)
- 11,969 people
- By 2030
- 11,639 · -2.8%
- By 2040
- 10,798 · -9.8%
- By 2050
- 9,820 · -18.0%
- By 2075
- 7,642 · -36.2%
- By 2100
- 5,689 · -52.5%
Race, ethnicity, and origin ACS 2023
- Neighborhood character
- Predominantly White (88%)
- Race & ethnicity
- White 88% Black 8% Two or more races 3%
- Common ancestry
- Lithuanian 1% Serbian 1% Italian 1%
- Foreign-born
- 1%
- Languages at home
- 99% English-only · Spanish 1%
Political lean MEDSL · Perry
- 2024 margin
- Solid R (+60.4) · D 19.5% · R 79.9%
- 2008→2024 swing
- -15.7pp toward R · 2008: -44.7pp · 2024: -60.4pp
- All cycles
- 2024: R+60.4 2020: R+53.0 2016: R+53.7 2012: R+45.6 2008: R+44.7
Not yet ingested
- Civics
- —
Market trends
- HPI YoY
- ▼ -78.70%
- Current HPI
- 137.0191
- Rent YoY
- —
- Metro
- —
- State GDP YoY
- —
- F500 in state
- 0
Price history
2 events — show timeline
- 2026-05-12 Listed $145,000 MLSU
- 1981-10-27 Sold (Public Records) — Public Records
Property tax history
-5.0%/yrLatest (2025): $83 · +0.1% YoY. Source: county tax records.
Cash-flow waterfall
monthlySold comps — $/sqft
last 12 mo · ≤1 miLoading sold comps…