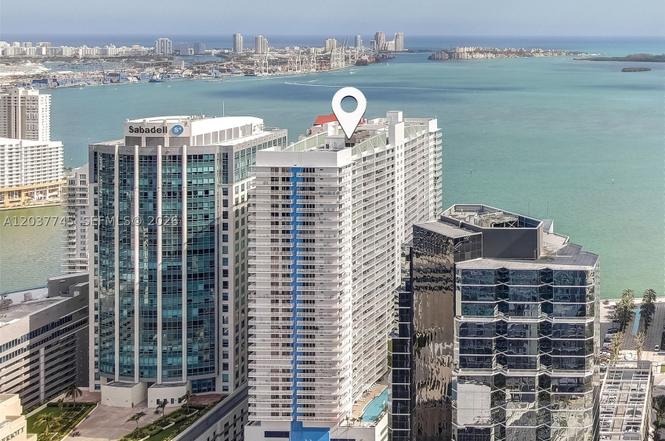
1200 Brickell Bay Dr #3714 · Miami, FL
Flood risk No data
- FEMA flood zone
- —
- Chance of flooding over 30 yrs
- —
- Est. flood insurance / yr
- —
Fire risk No data
- Est. fire insurance / yr
- —
Heat risk No data
- Hot days now (above threshold)
- —
- Hot days in 30 yrs
- —
Wind risk No data
- Chance of severe wind over 30 yrs
- —
Air-quality risk No data
- Unhealthy air days now
- —
- Unhealthy air days in 30 yrs
- —
Risk factors via First Street. Map © Google.
Why this score? — see what drove the D- grade
The composite is a weighted blend of 9 inputs, each scored 0–100. Each bar is that input's sub-score; the figure is the points it added to the 100-point composite (weight × sub-score).
- Cash flow +8.1/30.0
- ARV discount +7.5/15.0
- 1% rule +4.3/10.0
- Schools +4.2/10.0
- Appreciation +4.0/10.0
- Livability +3.9/5.0
- Rent growth +3.0/5.0
- Condition / age +2.5/5.0
- DSCR +2.1/10.0
$469,900
🖨 Deal sheet 📄 Offer letter ✓ Due diligence
Listing remarks
Experience the best of Brickell living in this spacious 1-bedroom, 1-bath residence at The Club at Brickell Bay. Located in one of Brickell's few condominium buildings that permits short-term rentals, including Airbnb, this property offers exceptional flexibility and investment potential. The bright, open-concept layout features floor-to-ceiling windows that fill the space with natural light and showcase beautiful city views. Step outside to a large private balcony, perfect for relaxing or entertaining. Residents enjoy resort-style amenities including a waterfront pool, fitness center, 24-hour concierge, security, and valet service. Ideally located in the heart of Brickell, just moments fro
Key facts
- $700 HOA
- Garage
- Community pool
Property features AI
Finance
- Other: Association pool
- Financial info: Pets allowed
- HOA & community: Monthly association fee; Association fee covers management, amenities, hot water, parking, sewer, trash and water; Association amenities include clubhouse, elevators, fitness center, laundry and pool
Exterior
- Parking: Attached garage with one covered space
- Security: Secured lobby; Secured elevator; Secured garage/parking
- Utilities: Association-managed hot water, water, sewer and trash
- Home design: Condominium / attached property; Entry located on level 37; Has a view; Waterfront property
- Construction: Block construction; Resale property; 43 total stories
- Exterior features: Open balcony
Interior
- Kitchen: Electric range; Microwave; Dishwasher; Refrigerator
- Bedrooms: Bedroom located on the main level
- Flooring: Tile flooring
- Bathrooms: 1 full bathroom
- Heating & cooling: Central heat; Central air conditioning
- Interior features: First floor entry; Bedroom on main level; Walk-in closet(s)
- Laundry & utility: Washer and dryer included; Laundry in common area
Neighborhood map
What this means for you Summary
Snapshot
- This is a 1-bed/1.0-bath condo listed at $470k.
Deal economics
- At list price, monthly cash flow is $-463 ($-6k/yr) — negative.
- To cash-flow at today's rent, offer at most $388k (17.4% below list).
- To meet the 1% rule (rent ≥ 1% of price), the offer needs to be $438k (6.8% below list).
- Recommended offer: $388k (17.4% below list) — sets the bar for cash-flow.
- Cap rate 5.1% vs local median 1.9% in Miami — top-decile yield for the area; either an underpriced asset or a hidden risk that comps aren't pricing in. Stress-test before assuming the spread holds.
Location & tenants
- Location reads 78/100 on livability (#177 in FL, #2,724 nationally) — a middle-class / working-renter tenant base. Strengths: amenities A+, commute A+, health & safety A+; Watch: employment C-, crime F, cost of living F.
- Miami-Dade (suburban): math 45% / reading 54% proficiency, ranked #40 of 73 in FL (top 55%) — families likely to look elsewhere, expect single-tenant / working-renter base with shorter leases; 64% free/reduced lunch — lower-income household profile, screen leases tightly.
- Market conditions: Rents rising (+2.0%/yr); 1007 active listings in the ZIP; high-income renter base; 10,051 units permitted in Miami-Dade County in 2024 (7,758 in 5+ unit buildings).
- This rent runs 36% of the median local income ($144k/yr) — at the standard rent-burdened threshold; future hikes will face affordability resistance.
Forward outlook
- Local home prices are declining (-2.1%/yr); year-one equity from $3k of loan paydown is wiped out by about $10k of value loss. Plan a longer hold.
- Miami-Dade County population projected at +28% by 2050 — long-run rental-demand tailwind backs the buy-and-hold thesis.
Negotiation context
- Only 2 days on market — expect competitive offers; lowballing is unlikely to land.
- Current owner paid $222k; list at $470k implies a 112% gain — meaningful room to come down on a strong offer.
Questions for the listing agent
- What do current leases actually rent for vs. the listed asking? Can we see a recent rent roll and the last 12 months of T-12 income?
- What does the HOA fee cover, when was the last increase, and are there any pending special assessments or reserve-fund shortfalls?
- Any open or pending special assessments — roof, HVAC, plumbing, elevator, façade? What's the per-unit balance and payoff schedule, and is the seller paying it off at close or rolling it to the buyer?
- Is there a deadline driving the sale (1031 exchange, divorce, estate, relocation)? That informs how much negotiation room exists.
- Schools are B-rated — typically a magnet for longer-tenancy family renters. What's the average tenant stay here, and is there a school-zone premium baked into asking?
- Crime grade is F in this area — have there been break-ins, vandalism, or insurance claims at this property in the last 3 years? What carrier currently insures it and at what premium?
- The area grade is low — what's the realistic commute time and amenity access for the typical tenant pool here? Any planned neighborhood developments (good or bad) we should know about?
- What's the average days-on-market for RENTAL listings here right now (not sales)? A rising rental-DOM trend means longer vacancies and softer asking-rent achievability than the comps imply.
- What's the recent tenant-quality profile in this submarket — average credit score on applications, eviction rate, late-payment / NSF rate, and stable-employment percentage? A property-management company in the area should have these aggregated.
- How much new apartment / multifamily construction is in the pipeline within 1–3 miles? Heavy new supply (>2% of stock underway) typically softens rents 12–24 months out; light construction supports rent growth.
Investment metrics
- 1% rule
- 0.93% ✗
- Cap rate
- 5.11%
- Cash-on-cash
- -4.22%
- DSCR
- 0.81
- GRM
- 8.9
CMA / ARV
No comps found within radius.
Projected returns pro-forma
-2.09% appreciation · 2.04% rent growth · sell at horizon
- IRR
- -18.3%
- Equity multiple
- 0.31×
- Total profit
- $-91,306
- Equity at exit
- $89,251
- IRR
- -12.9%
- Equity multiple
- 0.12×
- Total profit
- $-116,382
- Equity at exit
- $74,365
Cash invested: $131,572 (down + closing). Projections, not guarantees.
Landlord ↔ Tenant lean methodology
- Overall (STATE)
- 87 Strongly Landlord-Friendly
- State Florida
- 87 Strongly Landlord-Friendly · R+3
- County
- — inherits STATE
- City
- — inherits STATE
ZIP-level market 33131
- Home prices YoY
- -0.7%
- Rents YoY
- 2.0%
- Active inventory
- 1007
- Price-to-rent
- 8.9×
Monthly cashflow live
- Estimated rent
- $4,379 medium interval (Pro) →
- Mortgage (P&I)
- −$2,464
- Tax from tax record
- −$562 /mo · $6,746/yr
- Insurance
- −$196
- HOA
- −$700
- Vacancy / Maint / Mgmt
- −$920
- Net cashflow
- $-463
Break-even live
UW: 25.0% down · 7.5% · 30yr · 1.5% tax · 5.0% vac · 8.0% maint · 8.0% mgmt
Financing live
Cash to close
- Down payment
- $117,475
- Closing costs
- $14,097
- Reserves months
- —
- Total cash needed
- —
Loan-product check · same deal, 3 products live
Conventional
25% down · 7.5% · 30yr
- Down + closing
- —
- Monthly P&I
- —
- Monthly cashflow
- —
- DSCR
- —
- Eligible?
- —
Personal DTI + credit; lowest rate.
DSCR
20% down · 8.5% · 30yr
- Down + closing
- —
- Monthly P&I
- —
- Monthly cashflow
- —
- DSCR
- —
- Eligible?
- —
No personal income docs; deal must DSCR.
Hard money
10% down · 12.0% · 12mo
- Down + closing
- —
- Monthly P&I
- —
- Monthly cashflow
- —
- DSCR
- —
- Eligible?
- —
Short-term bridge; refi at stabilization.
HOA detail condo
- Monthly dues
- $700 · $8,400/yr
- Likely covers
- waterpoolgymdoormansecurity
- Assessments
- None detected in remarks — confirm with the listing agent.
Listing history 3 events
-
2026-06-18days on market $469,900 Active 2 DOM
-
2026-06-16remarks 699-char remark
-
2026-06-16$469,900 Active 1 DOM
ⓘ Source: listings_history table (triggers on properties + properties_extension) + one-shot
backfill from property_details.listing_events for pre-trigger history.
Tax reassessment forecast FL · Resets to sale price
- Current annual tax
- $6,746 · $562/mo
- Projected year-2 tax
- $6,746 · $562/mo
- Expected delta
- $0/yr ($0/mo · 0.0%)
ⓘ Screening estimate from a state-policy table — verify with the county assessor before closing.
Nearby sold comps map
Loading sold comps map…
Walkable amenities ~0.75 mi
Loading nearby amenities…
Taxation est. · year 1
- Rental income
- $52,544
- − Mortgage interest
- −$26,322
- − Property taxes
- −$6,746
- − Insurance
- −$2,350
- − Repairs & maintenance
- −$4,204
- − Management
- −$4,204
- − HOA
- −$8,400
- − Depreciation
- −$13,670
- Taxable loss
- −$13,350
- Est. tax savings @ 24.0%
- +$3,204
- After-tax cash flow
- $-2,352/yr
For passive investors: Depreciation is non-cash, so a rental often shows a tax loss while cash-flowing — sheltering income. Rental losses are passive: they offset passive income freely, and up to $25,000/yr can offset ordinary (W-2) income if you actively participate and your MAGI is under $100k (phasing out to $0 by $150k); unused losses carry forward. On sale, claimed depreciation is recaptured at up to 25%, and gains may owe capital-gains tax (a 1031 exchange can defer both). Figures are a year-1 estimate at your 24.0% rate — not tax advice; consult a CPA.
Schools (NCES district)
- District
- Miami-Dade
- NCES district ID
- 1200390
- Math proficiency
- 45% ▼ -16.00%
- Reading proficiency
- 54% ▼ -5.00%
- Median HH income
- $43,928
- Composite
- 41.76/100
- National rank
- #3397
- State rank
- #40 of 73 in FL
Livability — Miami
- Score
- 78/100
- State rank
- #177
- US rank
- #2724
Category grades
Schools grade is shown separately in the Schools card above.
Census & demographics
- Census place
- Miami, FL
- County
- Miami-Dade County · 2,697,751 people
- City population
- 827,308
- Metro
- Miami-Fort Lauderdale-Pompano Beach, FL
- Population (ZIP)
- 23,095
- Household income
- $144,138
- Rent vs Own
- Severe rent burden
- 1866.0
Population outlook (Miami-Dade County) Hauer SSP2
- Today (2025)
- 3,126,439 people
- By 2030
- 3,325,765 · +6.4%
- By 2040
- 3,697,561 · +18.3%
- By 2050
- 4,012,134 · +28.3%
- By 2075
- 4,605,612 · +47.3%
- By 2100
- 4,866,598 · +55.7%
Race, ethnicity, and origin ACS 2023
- Neighborhood character
- Diverse neighborhood (Simpson 0.61)
- Race & ethnicity
- Hispanic / Latino 52% Two or more races 35% White 33% Asian 4% Black 4%
- Hispanic origin (detail)
- Mexican 4% Puerto Rican 4% Cuban 8% Dominican 1% Salvadoran 3%
- Common ancestry
- Romanian 2% Scotch-Irish 2% Estonian 2%
- Foreign-born
- 54% · Canada, Jamaica, Dominican Republic
- Languages at home
- 30% English-only · Spanish 53% Other Indo-European 6% French/Haitian/Cajun 4%
Political lean MEDSL · Miami-Dade
- 2024 margin
- R (+11.4) · D 43.9% · R 55.4%
- 2008→2024 swing
- -27.6pp toward R · 2008: 16.1pp · 2024: -11.4pp
- All cycles
- 2024: R+11.4 2020: D+7.3 2016: D+29.6 2012: D+23.7 2008: D+16.1
Not yet ingested
- Civics
- —
Market trends
- HPI YoY
- ▼ -2.09%
- Current HPI
- 281.1156
- Rent YoY
- ▲ 2.04%
- Metro
- Miami-Fort Lauderdale-Pompano Beach, FL
- State GDP YoY
- ▲ 3.28%
- F500 in state
- 36
Industry mix (Fortune 500 HQ in FL)
| Industry | F500 HQs | Revenue |
|---|---|---|
| Industrial Technology | 2 | $29B |
|
||
| Insurance | 2 | $17B |
|
||
| Retail | 1 | $60B |
|
||
| Technology Distribution | 1 | $58B |
|
||
| Homebuilding | 1 | $35B |
|
||
| Technology Manufacturing | 1 | $35B |
|
||
Price history
+79.4% since first listed6 events — show timeline
- 2026-06-16 Listed $469,900 MARMLS
- 2022-12-07 Rental Removed — MARMLS
- 2012-12-26 Sold (Public Records) $222,000 Public Records
- 2006-11-09 Sold (Public Records) $440,000 Public Records
- 2006-11-09 Sold (Public Records) $630,000 Public Records
- 2005-08-11 Sold (Public Records) $261,900 Public Records
Property tax history
+6.2%/yrLatest (2025): $6,746 · +1.5% YoY. Source: county tax records.
Cash-flow waterfall
monthlySold comps — $/sqft
last 12 mo · ≤1 miLoading sold comps…