83 Eagle St · Lyndonville, NY
Flood risk 1/10 · Minimal
- FEMA flood zone
- X
- Chance of flooding over 30 yrs
- 0.0%
- Est. flood insurance / yr
- $473 – $860
Fire risk 1/10 · Minimal
- Est. fire insurance / yr
- $691 – $1,283
Heat risk 2/10 · Minimal
- Hot days now (above 96°F)
- 7 days/yr
- Hot days in 30 yrs
- 15 days/yr
Wind risk 1/10 · Minimal
- Chance of severe wind over 30 yrs
- —
Air-quality risk 2/10 · Minimal
- Unhealthy air days now
- 1 days/yr
- Unhealthy air days in 30 yrs
- 2 days/yr
Risk factors via First Street. Map © Google.
Why this score? — see what drove the B+ grade
The composite is a weighted blend of 9 inputs, each scored 0–100. Each bar is that input's sub-score; the figure is the points it added to the 100-point composite (weight × sub-score).
- Cash flow +30.0/30.0
- 1% rule +10.0/10.0
- DSCR +10.0/10.0
- Appreciation +8.8/10.0
- ARV discount +7.5/15.0
- Schools +5.0/10.0
- Livability +3.0/5.0
- Rent growth +2.5/5.0
- Condition / age +2.5/5.0
$30,000
🖨 Deal sheet (PDF) 📄 Offer letter ✓ Due diligence
Listing remarks
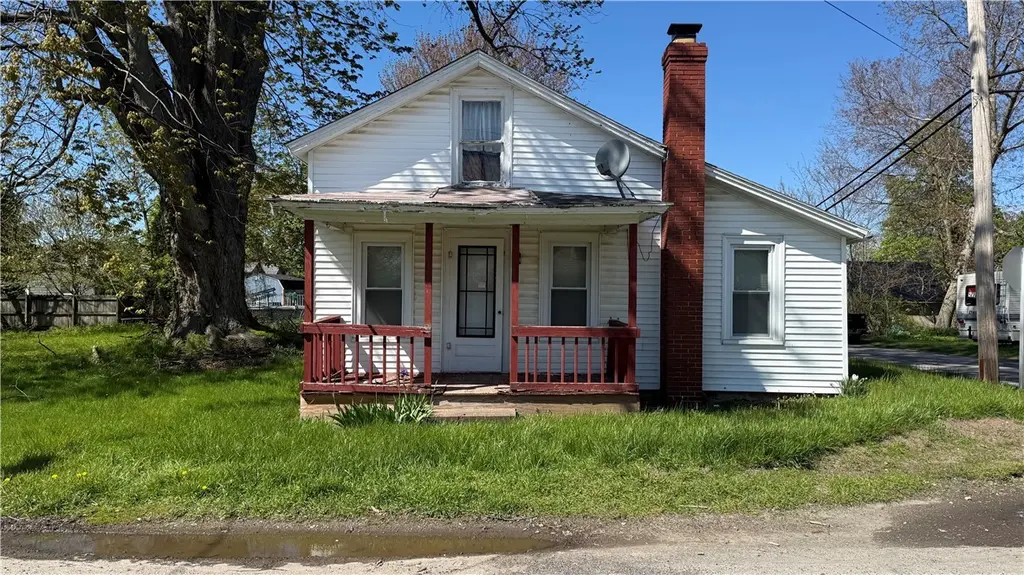
This Lyndonville Village home has great potential and is priced to sell. It is located on a fantastic corner lot, with a spacious side yard. A pad is poured for a single car garage or a shed. The home has vinyl siding and the roof is in decent condition. No interior viewing will be allowed. Home is being sold as-is. * * * Buyer accepts this property AS-IS, WHERE-IS, ALL FAULTS KNOWN & UNKNOWN * * *
Key facts
- Spacious side yard
- Vinyl siding
- Corner lot
Tags
Property features AI
Exterior
- Parking: No garage; No driveway
- Utilities: Public water connected; Sewer connected
- Home design: Single-story home; Existing structure; Resale fixer condition
- Construction: Vinyl siding; Stone foundation
- Exterior features: Corner lot; Rectangular residential lot; City street frontage; Lot dimensions approximately 115 x 94
Interior
- Kitchen: Water heater listed in equipment; Additional kitchen/appliance details: see remarks
- Bedrooms: Three main-level bedrooms
- Bathrooms: One full bathroom on the main level
- Heating & cooling: Oil forced-air heating; Has heating
- Interior features: Partial basement; Other interior features (see remarks)
- Laundry & utility: Utilities: water connected
Neighborhood map
What this means for you Summary
Snapshot
- This is a 3-bed/1.0-bath single-family listed at $30k.
Deal economics
- At list price, monthly cash flow is $723 ($9k/yr) — positive.
- The deal already cash-flows at list — no discount required.
- Meets the 1% rule at list price ($1k rent vs $30k).
- Recommended offer: $29k (3.0% below list) — sets the bar for market timing.
Location & tenants
- Location reads 60/100 on livability (#993 in NY) — a middle-class / working-renter tenant base. Strengths: cost of living A+, housing A+; Watch: employment C-, crime F, amenities F.
- Lyndonville Central School District (rural): math 52% / reading 65% proficiency, ranked #260 of 590 in NY (top 44%) — acceptable for families but not a draw, mixed tenant base, ~2y average lease.
- Market conditions: 11 active listings in the ZIP; 28 units permitted in Orleans County in 2024 (0 in 5+ unit buildings).
Forward outlook
- In year one you build about $3k of equity ($207 loan paydown + $2k appreciation (7.7% local appreciation)).
- Orleans County population projected at -20% by 2050 — secular population decline; favor cash flow + early exit over multi-decade hold.
- At projected returns (7.7% appreciation + 3.0% rent growth), your $8k cash investment doubles in ~1 year — after that, you're playing with house money.
Negotiation context
- It's been on market 36 days — a 3% lower offer ($29k) is reasonable based on typical stale-listing flexibility.
- 2 sale attempts with the ask held roughly flat each time — persistent listings suggest the price (not the market) is what's stuck; bring a comps-based counter.
- Current owner paid $20k; list at $30k implies a 50% gain — meaningful room to come down on a strong offer.
Risks & watch-outs
- Watch-outs: built in 1833 — expect roof / HVAC / electrical / plumbing capex.
Questions for the listing agent
- It's been on market 36 days. Have you received any prior offers? Is the seller open to a 3% concession, seller financing, or rate buy-down credit?
- Built in 1833 — when were the roof, HVAC, electrical panel, plumbing, and water heater last replaced?
- Is there a deadline driving the sale (1031 exchange, divorce, estate, relocation)? That informs how much negotiation room exists.
- Crime grade is F in this area — have there been break-ins, vandalism, or insurance claims at this property in the last 3 years? What carrier currently insures it and at what premium?
- What's the average days-on-market for RENTAL listings here right now (not sales)? A rising rental-DOM trend means longer vacancies and softer asking-rent achievability than the comps imply.
- What's the recent tenant-quality profile in this submarket — average credit score on applications, eviction rate, late-payment / NSF rate, and stable-employment percentage? A property-management company in the area should have these aggregated.
- How much new for-sale + rental construction is in the pipeline within 1–3 miles? Heavy new supply typically softens prices + rents 12–24 months out; constrained supply supports both.
Investment metrics
- 1% rule
- 3.93% ✓
- Cap rate
- 35.22%
- Cash-on-cash
- 103.31%
- DSCR
- 5.60
- GRM
- 2.1
CMA / ARV
- ARV (median comp)
- $167,127
- List price
- $30,000
- Delta
- -82.05%
- Verdict
- UNDERPRICED
- Comps
- 4 within 1.0 mi
Projected returns pro-forma
7.65% appreciation · 3.0% rent growth · sell at horizon
- IRR
- —
- Equity multiple
- 7.88×
- Total profit
- $57,760
- Equity at exit
- $22,076
- IRR
- —
- Equity multiple
- 16.88×
- Total profit
- $133,393
- Equity at exit
- $43,154
Cash invested: $8,400 (down + closing). Projections, not guarantees.
Landlord ↔ Tenant lean methodology
- Overall (STATE)
- 15 Strongly Tenant-Friendly
- State New York
- 15 Strongly Tenant-Friendly · D+10
- County
- — inherits STATE
- City
- — inherits STATE
ZIP-level market 14098
- Home prices YoY
- 2.5%
- Active inventory
- 11
- Price-to-rent
- 2.1×
Monthly cashflow live
- Estimated rent
- $1,178 medium interval (Pro) →
- Mortgage (P&I)
- −$157
- Tax est. 1.5%
- −$38 /mo · $450/yr
- Insurance
- −$12
- HOA
- −$0
- Vacancy / Maint / Mgmt
- −$247
- Net cashflow
- $723
Break-even live
Sensitivity live
| Price | -10% $744 | -5% $734 | +0% $723 | +5% $713 | +10% $702 |
|---|---|---|---|---|---|
| Rent | -10% $630 | -5% $677 | +0% $723 | +5% $770 | +10% $816 |
| Rate | -1.0pp $738 | -0.5pp $731 | base $723 | +0.5pp $715 | +1.0pp $707 |
UW: 25.0% down · 7.5% · 30yr · 1.5% tax · 5.0% vac · 8.0% maint · 8.0% mgmt
Financing live
Cash to close
- Down payment
- $7,500
- Closing costs
- $900
- Reserves months
- —
- Total cash needed
- —
Loan-product check · same deal, 3 products live
Conventional
25% down · 7.5% · 30yr
- Down + closing
- —
- Monthly P&I
- —
- Monthly cashflow
- —
- DSCR
- —
- Eligible?
- —
Personal DTI + credit; lowest rate.
DSCR
20% down · 8.5% · 30yr
- Down + closing
- —
- Monthly P&I
- —
- Monthly cashflow
- —
- DSCR
- —
- Eligible?
- —
No personal income docs; deal must DSCR.
Hard money
10% down · 12.0% · 12mo
- Down + closing
- —
- Monthly P&I
- —
- Monthly cashflow
- —
- DSCR
- —
- Eligible?
- —
Short-term bridge; refi at stabilization.
Listing history 16 events
-
2026-06-21days on market $30,000 Active 36 DOM
-
2026-06-18days on market $30,000 Active 34 DOM
-
2026-06-17days on market $30,000 Active 33 DOM
-
2026-06-16days on market $30,000 Active 32 DOM
-
2026-06-15days on market $30,000 Active 31 DOM
-
2026-06-13statusdays on market $30,000 Active 29 DOM
-
2026-06-09status $30,000 Pending 28 DOM
-
2026-06-08days on market $30,000 Active 28 DOM
-
2026-06-07days on market $30,000 Active 27 DOM
-
2026-06-05days on market $30,000 Active 25 DOM
-
2026-06-04days on market $30,000 Active 23 DOM
-
2026-06-02days on market $30,000 Active 22 DOM
-
2026-06-01days on market $30,000 Active 21 DOM
-
2026-05-31days on market $30,000 Active 20 DOM
-
2026-05-11$30,000 Active 411-char remark
-
1997-08-01soldstatus $20,000
ⓘ Source: listings_history table (triggers on properties + properties_extension) + one-shot
backfill from property_details.listing_events for pre-trigger history.
Climate risk First Street
- Flood 1/10 Low FEMA zone X · 0% chance over 30 yrs
- Wildfire 1/10 Low
- Heat 2/10 Low 7 d/yr ≥96°F today · 15 d/yr by 30 yrs out
- Wind 1/10 Low
- Air quality 2/10 Low 1 unhealthy d/yr today · 2 by 30 yrs out
Nearby sold comps map
Loading sold comps map…
Walkable amenities ~0.75 mi
Loading nearby amenities…
Taxation est. · year 1
- Rental income
- $14,134
- − Mortgage interest
- −$1,680
- − Property taxes
- −$450
- − Insurance
- −$150
- − Repairs & maintenance
- −$1,131
- − Management
- −$1,131
- − Depreciation
- −$873
- Taxable income
- $8,719
- Est. tax owed @ 24.0%
- −$2,093
- After-tax cash flow
- $6,585/yr
For passive investors: Depreciation is non-cash, so a rental often shows a tax loss while cash-flowing — sheltering income. Rental losses are passive: they offset passive income freely, and up to $25,000/yr can offset ordinary (W-2) income if you actively participate and your MAGI is under $100k (phasing out to $0 by $150k); unused losses carry forward. On sale, claimed depreciation is recaptured at up to 25%, and gains may owe capital-gains tax (a 1031 exchange can defer both). Figures are a year-1 estimate at your 24.0% rate — not tax advice; consult a CPA.
Schools (NCES district)
- District
- Lyndonville Central School District
- NCES district ID
- 3617970
- Math proficiency
- 52% ▲ 5.00%
- Reading proficiency
- 65% ▲ 19.00%
- Median HH income
- $52,015
- Composite
- 49.98/100
- National rank
- #1927
- State rank
- #260 of 590 in NY
Livability — Lyndonville
- Score
- 60/100
- State rank
- #993
- US rank
- #19414
Category grades
Schools grade is shown separately in the Schools card above.
Census & demographics
- Census place
- Lyndonville, NY
- Population (ZIP)
- 2,968
Population outlook (Orleans County) Hauer SSP2
- Today (2025)
- 39,123 people
- By 2030
- 37,648 · -3.8%
- By 2040
- 34,432 · -12.0%
- By 2050
- 31,487 · -19.5%
- By 2075
- 26,544 · -32.2%
- By 2100
- 22,251 · -43.1%
Race, ethnicity, and origin ACS 2023
- Neighborhood character
- Predominantly White (94%)
- Race & ethnicity
- White 94% Two or more races 3% Hispanic / Latino 3%
- Common ancestry
- Romanian 12% Slovak 2% Lithuanian 2%
- Foreign-born
- 3% · Canada
- Languages at home
- 88% English-only · German/W. Germanic 10% Spanish 1% Russian/Polish/Slavic 1%
Political lean MEDSL · Orleans
- 2024 margin
- Solid R (+40.5) · D 29.8% · R 70.2%
- 2008→2024 swing
- -21.8pp toward R · 2008: -18.7pp · 2024: -40.5pp
- All cycles
- 2024: R+40.5 2020: R+36.0 2016: R+43.4 2012: R+19.4 2008: R+18.7
Not yet ingested
- Civics
- —
Market trends
- HPI YoY
- ▲ 7.65%
- Current HPI
- 311.3169
- Rent YoY
- —
- Metro
- —
- State GDP YoY
- ▲ 2.60%
- F500 in state
- 92
Industry mix (Fortune 500 HQ in NY)
| Industry | F500 HQs | Revenue |
|---|---|---|
| Financial Services | 10 | $950B |
|
||
| Consumer Goods | 9 | $162B |
|
||
| Insurance | 4 | $225B |
|
||
| Telecommunications | 2 | $144B |
|
||
| Pharmaceuticals | 2 | $112B |
|
||
| Media / Entertainment | 2 | $69B |
|
||
Price history
+50.0% since first listed4 events — show timeline
- 2026-06-12 Relisted — UNYREIS
- 2026-06-08 Pending — UNYREIS
- 2026-05-11 Listed $30,000 UNYREIS
- 1997-08-01 Sold (Public Records) $20,000 Public Records
Property tax history
+7.9%/yrLatest (2025): $2,480 · +8.5% YoY. Source: county tax records.
Cash-flow waterfall
monthlySold comps — $/sqft
last 12 mo · ≤1 miLoading sold comps…