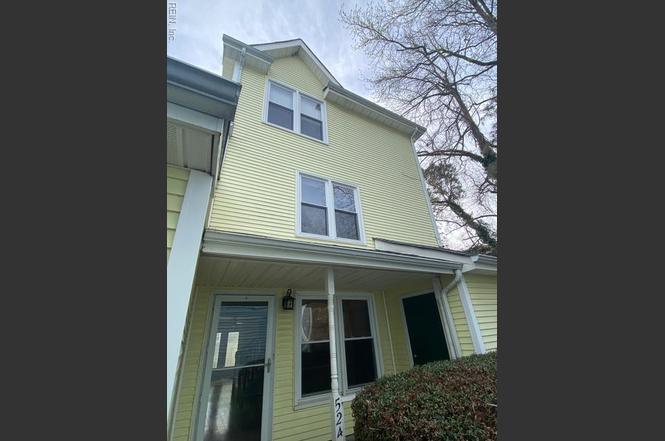
524 Pine Tops Ct · Virginia Beach, VA
Flood risk 1/10 · Minimal
- FEMA flood zone
- X (unshaded)
- Chance of flooding over 30 yrs
- 0.0%
- Est. flood insurance / yr
- $507 – $1,088
Fire risk 3/10 · Minor
- Est. fire insurance / yr
- $666 – $1,236
Heat risk 9/10 · Severe
- Hot days now (above 102°F)
- 7 days/yr
- Hot days in 30 yrs
- 17 days/yr
Wind risk 8/10 · Major
- Chance of severe wind over 30 yrs
- 99.0%
Air-quality risk 2/10 · Minimal
- Unhealthy air days now
- 1 days/yr
- Unhealthy air days in 30 yrs
- 2 days/yr
Risk factors via First Street. Map © Google.
Why this score? — see what drove the D grade
The composite is a weighted blend of 9 inputs, each scored 0–100. Each bar is that input's sub-score; the figure is the points it added to the 100-point composite (weight × sub-score).
- Cash flow +10.5/30.0
- ARV discount +7.5/15.0
- Schools +6.4/10.0
- Livability +4.2/5.0
- Rent growth +3.9/5.0
- 1% rule +3.6/10.0
- DSCR +3.0/10.0
- Condition / age +2.5/5.0
- Appreciation +0.0/10.0
$327,000
🖨 Deal sheet (PDF) 📄 Offer letter ✓ Due diligence
Listing remarks
Attractive and spacious end unit condo in a secluded location at the VA Beach Oceanfront. Great layout with large bedrooms. 2 Reserved parking spaces. Easy access to the resort beaches and I 264 at Birdneck. Great lifestyle condo with fenced rear patio.
Key facts
- Fenced rear patio
- Secluded location
- End unit condo
Tags
Property features AI
Finance
- Other: Neighborhood: Oceanfront
- HOA & community: Homeowners association (Pine Tops Beach Condominium); Condo association covers ground maintenance and trash pickup; Association fee approximately $305 monthly; Association management: PMA David Lukas
Exterior
- Parking: Two assigned/reserved parking spaces (lot)
- Utilities: City/County water; City/County sewer; Electric water heater
- Home design: Attached townhouse; End unit; Three living levels; Condo ownership; Condo level 1; Slab foundation
- Construction: Vinyl siding; Asphalt shingle roof
- Exterior features: Patio; Back fenced yard
Interior
- Kitchen: Dishwasher; Microwave; Electric range; Refrigerator
- Bedrooms: Master bedroom with en suite bath; No bedroom and full bathroom on first floor
- Flooring: Carpet; Laminate; Wood
- Bathrooms: Two full bathrooms; One half bathroom
- Heating & cooling: Heat pump heating; Electric heating; Central air conditioning
- Interior features: Built-in bar; One fireplace
- Laundry & utility: Washer hookup; Dryer hookup; Utility closet
Neighborhood map
What this means for you Summary
Snapshot
- This is a 3-bed/2.5-bath condo listed at $327k.
Deal economics
- At list price, monthly cash flow is $-170 ($-2k/yr) — negative.
- To cash-flow at today's rent, offer at most $297k (9.2% below list).
- To meet the 1% rule (rent ≥ 1% of price), the offer needs to be $281k (13.9% below list).
- Recommended offer: $281k (13.9% below list) — sets the bar for 1% rule.
- Cap rate 5.7% vs local median 3.5% in Virginia Beach — top-decile yield for the area; either an underpriced asset or a hidden risk that comps aren't pricing in. Stress-test before assuming the spread holds.
Location & tenants
- Location reads 83/100 on livability (#38 in VA, #880 nationally) — a professional / high-income tenant draw. Strengths: amenities A+, employment A+, housing A+; Watch: cost of living C-, commute F.
- Va Beach City Public School District (urban): math 69% / reading 78% proficiency, ranked #10 of 131 in VA (top 8%) — strong family-tenant draw, lease renewals of 3-5y typical.
- Zoned schools: Seatack Elementary An Achievable Dream Academy (math 47% / reading 57%, grade C-, #696 of 1,108 statewide, top 66%, 379 students, 93% FRL); Virginia Beach Middle (math 71% / reading 84%, grade A+, #36 of 342 statewide, top 11%, 589 students, 51% FRL); First Colonial High (math 76% / reading 81%, grade A-, #75 of 319 statewide, top 25%, 1,797 students, 34% FRL) — zoned schools average 59% FRL vs 28% district-wide (31 pts higher); higher-poverty schools than district average — tighter screening recommended.
- Market conditions: Rents rising fast (+5.4%/yr); 398 active listings in the ZIP; 39 comparable units currently listed for rent nearby; rentals at typical pace (median 19d on market — plan ~3-4 weeks tenant-placement turnaround); solid renter incomes; 666 units permitted in Virginia Beach city in 2024 (347 in 5+ unit buildings).
- This rent runs 34% of the median local income ($101k/yr) — at the standard rent-burdened threshold; future hikes will face affordability resistance.
Forward outlook
- Local home prices are declining (-3.0%/yr); year-one equity from $2k of loan paydown is wiped out by about $10k of value loss. Plan a longer hold.
- Virginia Beach County population projected at +6% by 2050 — modest demand growth; plan on rents tracking national, not racing it.
Negotiation context
- It's been on market 112 days — a 9% lower offer ($298k) is reasonable based on typical stale-listing flexibility.
- Current owner paid $225k; 45% above their basis — modest negotiation headroom, anchor on the comps not their cost.
Risks & watch-outs
- Climate carrying-cost: severe wind risk, 99% chance of damaging wind over 30y; extreme-heat days projected 7→17/yr by 2055 (HVAC capex compounding) — expect insurance premiums to compound above CPI over the hold.
Questions for the listing agent
- What do current leases actually rent for vs. the listed asking? Can we see a recent rent roll and the last 12 months of T-12 income?
- It's been on market 112 days. Have you received any prior offers? Is the seller open to a 14% concession, seller financing, or rate buy-down credit?
- What does the HOA fee cover, when was the last increase, and are there any pending special assessments or reserve-fund shortfalls?
- Any open or pending special assessments — roof, HVAC, plumbing, elevator, façade? What's the per-unit balance and payoff schedule, and is the seller paying it off at close or rolling it to the buyer?
- Why hasn't it sold? Are there any deal-killer items the seller is aware of (foundation, flood, title, zoning, code violations)?
- Is there a deadline driving the sale (1031 exchange, divorce, estate, relocation)? That informs how much negotiation room exists.
- Schools are A-rated — typically a magnet for longer-tenancy family renters. What's the average tenant stay here, and is there a school-zone premium baked into asking?
- The area grade is low — what's the realistic commute time and amenity access for the typical tenant pool here? Any planned neighborhood developments (good or bad) we should know about?
- What's the average days-on-market for RENTAL listings here right now (not sales)? A rising rental-DOM trend means longer vacancies and softer asking-rent achievability than the comps imply.
- What's the recent tenant-quality profile in this submarket — average credit score on applications, eviction rate, late-payment / NSF rate, and stable-employment percentage? A property-management company in the area should have these aggregated.
- How much new apartment / multifamily construction is in the pipeline within 1–3 miles? Heavy new supply (>2% of stock underway) typically softens rents 12–24 months out; light construction supports rent growth.
Investment metrics
- 1% rule
- 0.86% ✗
- Cap rate
- 5.67%
- Cash-on-cash
- -2.23%
- DSCR
- 0.90
- GRM
- 9.7
CMA / ARV
No comps found within radius.
Projected returns pro-forma
-3.0% appreciation · 5.42% rent growth · sell at horizon
- IRR
- -17.1%
- Equity multiple
- 0.38×
- Total profit
- $-56,671
- Equity at exit
- $48,757
- IRR
- -4.9%
- Equity multiple
- 0.64×
- Total profit
- $-32,517
- Equity at exit
- $28,273
Cash invested: $91,560 (down + closing). Projections, not guarantees.
Landlord ↔ Tenant lean methodology
- Overall (STATE)
- 55 Moderately Landlord-Leaning
- State Virginia
- 55 Moderately Landlord-Leaning · D+2
- County
- — inherits STATE
- City
- — inherits STATE
ZIP-level market 23451
- Rents YoY
- 5.4%
- Active inventory
- 398
- Price-to-rent
- 9.7×
Monthly cashflow live
- Estimated rent
- $2,814 high interval (Pro) →
- Mortgage (P&I)
- −$1,715
- Tax from tax record
- −$237 /mo · $2,848/yr
- Insurance
- −$136
- HOA
- −$305
- Vacancy / Maint / Mgmt
- −$591
- Net cashflow
- $-170
Break-even live
Sensitivity live
| Price | -10% $15 | -5% $-77 | +0% $-170 | +5% $-263 | +10% $-355 |
|---|---|---|---|---|---|
| Rent | -10% $-392 | -5% $-281 | +0% $-170 | +5% $-59 | +10% $52 |
| Rate | -1.0pp $-5 | -0.5pp $-87 | base $-170 | +0.5pp $-255 | +1.0pp $-341 |
UW: 25.0% down · 7.5% · 30yr · 1.5% tax · 5.0% vac · 8.0% maint · 8.0% mgmt
Financing live
Cash to close
- Down payment
- $81,750
- Closing costs
- $9,810
- Reserves months
- —
- Total cash needed
- —
Loan-product check · same deal, 3 products live
Conventional
25% down · 7.5% · 30yr
- Down + closing
- —
- Monthly P&I
- —
- Monthly cashflow
- —
- DSCR
- —
- Eligible?
- —
Personal DTI + credit; lowest rate.
DSCR
20% down · 8.5% · 30yr
- Down + closing
- —
- Monthly P&I
- —
- Monthly cashflow
- —
- DSCR
- —
- Eligible?
- —
No personal income docs; deal must DSCR.
Hard money
10% down · 12.0% · 12mo
- Down + closing
- —
- Monthly P&I
- —
- Monthly cashflow
- —
- DSCR
- —
- Eligible?
- —
Short-term bridge; refi at stabilization.
Rent comps 39 comps
| Address | Beds | Baths | Sqft | Rent | $/sqft | DOM | Units | Dist |
|---|---|---|---|---|---|---|---|---|
| 940 Old Virginia Beach Rd Virginia Beach, VA | 3.0 | 2.5 | 1400 | $2,500 | $1.79 | 25d | 1 | 0.04mi |
| 912 C Ave Unit C Virginia Beach, VA | 3.0 | 2.5 | 1367 | $3,500 | $2.56 | 16d | 1 | 0.14mi |
| 912 C Ave Virginia Beach, VA | 3.0 | 2.5 | 1367 | $2,500 | $1.83 | 12d | 1 | 0.14mi |
| 400 Eden Roc Cir Virginia Beach, VA | 1.0–3.0 | 1.0–2.0 | 1114 | $3,192 | $2.87 | 3d | 18 | 0.28mi |
| 408 Coastal Walk Pl #103 Virginia Beach, VA | 2.0 | 2.5 | 1409 | $2,200 | $1.56 | 14d | 1 | 0.30mi |
| 400 Coastal Walk Pl Virginia Beach, VA | 3.0 | 2.0 | 1422 | $2,600 | $1.83 | 25d | 1 | 0.31mi |
| 400 Coastal Walk Pl #105 Virginia Beach, VA | 3.0 | 2.0 | 1422 | $2,500 | $1.76 | 19d | 1 | 0.31mi |
| 1136 Arlynn Ln Virginia Beach, VA | 3.0 | 3.5 | 2252 | $3,000 | $1.33 | 19d | 1 | 0.43mi |
| 757 Saltmeadow Bay Dr Virginia Beach, VA | 1.0–3.0 | 1.0–2.5 | 1199 | $3,178 | $2.65 | 3d | 18 | 0.52mi |
| 2734 Manoomin Pl Virginia Beach, VA | 2.0 | 2.0 | 1428 | $1,995 | $1.40 | 13d | 1 | 0.53mi |
| 722 16th St Virginia Beach, VA | 3.0 | 1.5 | 1260 | $2,500 | $1.98 | 23d | 1 | 0.64mi |
| 901 13th St Virginia Beach, VA | 3.0 | 3.5 | 1800 | $3,095 | $1.72 | 4d | 1 | 0.73mi |
| 320 23rd St Virginia Beach, VA | 4.0 | 2.0 | 1700 | $3,595 | $2.11 | 25d | 1 | 0.74mi |
| 918 13th St Virginia Beach, VA | 3.0 | 3.5 | 1651 | $3,000 | $1.82 | 25d | 1 | 0.74mi |
| 300 25th St Virginia Beach, VA | 1.0–3.0 | 1.0–2.5 | 1253 | $3,990 | $3.18 | 3d | 2 | 0.79mi |
| 100 Pinewood Rd #128 Virginia Beach, VA | 2.0 | 2.5 | 1358 | $3,250 | $2.39 | 25d | 1 | 0.80mi |
| 521 Laskin Rd Virginia Beach, VA | 2.0 | 2.5 | 1381 | $4,040 | $2.93 | 25d | 1 | 0.81mi |
| 521 Laskin Rd Apt 702 Virginia Beach, VA | 3.0 | 2.5 | 1581 | $4,990 | $3.16 | 6d | 1 | 0.81mi |
| 521 Laskin Rd Virginia Beach, VA | 3.0 | 2.5 | 1365 | $3,850 | $2.82 | 12d | 1 | 0.81mi |
| 521 Laskin Rd Unit 00 323 Virginia Beach, VA | 3.0 | 2.5 | 1365 | $3,850 | $2.82 | 25d | 1 | 0.81mi |
| 521 Laskin Rd Apt 718 Virginia Beach, VA | 2.0 | 2.5 | 1376 | $3,990 | $2.90 | 25d | 1 | 0.81mi |
| 304 26 1/2 St Unit A Virginia Beach, VA | 3.0 | 2.5 | 1592 | $3,500 | $2.20 | 6d | 1 | 0.84mi |
| 1208 Cypress Ave Unit A Virginia Beach, VA | 4.0 | 3.0 | 2000 | $2,200 | $1.10 | 19d | 1 | 0.84mi |
| 315 29th St Virginia Beach, VA | 2.0 | 2.0 | 1300 | $1,900 | $1.46 | 12d | 1 | 0.87mi |
| 1334 Linkhorn Cir Virginia Beach, VA | 3.0 | 2.5 | 1532 | $3,400 | $2.22 | 25d | 1 | 0.87mi |
| 3200 Holly Rd #102 Virginia Beach, VA | 2.0 | 2.0 | 1300 | $3,000 | $2.31 | 9d | 1 | 0.93mi |
| 945 Indian Cir Virginia Beach, VA | 3.0 | 2.5 | 1400 | $2,300 | $1.64 | 25d | 1 | 0.94mi |
| 2613 Atlantic Ave Virginia Beach, VA | 1.0–2.0 | 1.0–2.0 | 1117 | $5,999 | $5.37 | 25d | 1 | 0.95mi |
| 904 Rudee Ave Virginia Beach, VA | 3.0 | 2.5 | 1250 | $2,800 | $2.24 | 6d | 1 | 0.95mi |
| 1441 Laskin Rd Virginia Beach, VA | 1.0–3.0 | 1.0–3.0 | 1226 | $3,400 | $2.77 | 6d | 9 | 1.00mi |
| 1441 Reynard Dr Virginia Beach, VA | 1.0–4.0 | 1.0–2.5 | 1080 | $2,495 | $2.31 | 3d | 19 | 1.03mi |
| 317 34th St Virginia Beach, VA | 4.0 | 2.5 | 2600 | $2,999 | $1.15 | 25d | 1 | 1.06mi |
| 315 34th St Virginia Beach, VA | 4.0 | 2.5 | 2600 | $2,999 | $1.15 | 25d | 1 | 1.07mi |
| 313 34th St Virginia Beach, VA | 3.0 | 1.5 | 2600 | $2,599 | $1.00 | 25d | 1 | 1.07mi |
| 311 34th St Virginia Beach, VA | 3.0 | 2.0 | 1600 | $2,999 | $1.87 | 25d | 1 | 1.08mi |
| 309 34th St Virginia Beach, VA | 3.0 | 2.0 | 1600 | $2,799 | $1.75 | 25d | 1 | 1.09mi |
| 233 Sykes Ave Unit A Virginia Beach, VA | 3.0 | 2.5 | 1484 | $2,450 | $1.65 | 13d | 1 | 1.11mi |
| 510 Virginia Ave Virginia Beach, VA | 3.0 | 2.0 | 1880 | $2,350 | $1.25 | 6d | 1 | 1.28mi |
| 908 Terrace Ave Virginia Beach, VA | 3.0 | 2.5 | 1656 | $2,750 | $1.66 | 16d | 1 | 1.30mi |
HOA detail condo
- Monthly dues
- $305 · $3,660/yr
- Assessments
- None detected in remarks — confirm with the listing agent.
Listing history 15 events
-
2026-06-18days on market $327,000 Active 112 DOM
-
2026-06-17days on market $327,000 Active 111 DOM
-
2026-06-16days on market $327,000 Active 110 DOM
-
2026-06-15days on market $327,000 Active 109 DOM
-
2026-06-13days on market $327,000 Active 107 DOM
-
2026-06-09days on market $327,000 Active 103 DOM
-
2026-06-08days on market $327,000 Active 102 DOM
-
2026-06-07days on market $327,000 Active 101 DOM
-
2026-06-03days on market $327,000 Active 97 DOM
-
2026-06-02days on market $327,000 Active 96 DOM
-
2026-06-01days on market $327,000 Active 95 DOM
-
2026-05-31days on market $327,000 Active 94 DOM
-
2026-02-25$327,000 Active
-
2006-08-07soldstatus $225,000
-
2004-10-07soldstatus $135,000
ⓘ Source: listings_history table (triggers on properties + properties_extension) + one-shot
backfill from property_details.listing_events for pre-trigger history.
Tax reassessment forecast VA · Resets to sale price
- Current annual tax
- $2,848 · $237/mo
- Projected year-2 tax
- $2,848 · $237/mo
- Expected delta
- $0/yr ($0/mo · 0.0%)
ⓘ Screening estimate from a state-policy table — verify with the county assessor before closing.
Climate risk First Street
- Flood 1/10 Low FEMA zone X (unshaded) · 0% chance over 30 yrs
- Wildfire 3/10 Moderate
- Heat 9/10 Extreme 7 d/yr ≥102°F today · 17 d/yr by 30 yrs out
- Wind 8/10 Severe 99% chance of damaging wind over 30 yrs
- Air quality 2/10 Low 1 unhealthy d/yr today · 2 by 30 yrs out
Nearby sold comps map
Loading sold comps map…
Walkable amenities ~0.75 mi
Loading nearby amenities…
Taxation est. · year 1
- Rental income
- $33,774
- − Mortgage interest
- −$18,317
- − Property taxes
- −$2,848
- − Insurance
- −$1,635
- − Repairs & maintenance
- −$2,702
- − Management
- −$2,702
- − HOA
- −$3,660
- − Depreciation
- −$9,513
- Taxable loss
- −$7,603
- Est. tax savings @ 24.0%
- +$1,825
- After-tax cash flow
- $-215/yr
For passive investors: Depreciation is non-cash, so a rental often shows a tax loss while cash-flowing — sheltering income. Rental losses are passive: they offset passive income freely, and up to $25,000/yr can offset ordinary (W-2) income if you actively participate and your MAGI is under $100k (phasing out to $0 by $150k); unused losses carry forward. On sale, claimed depreciation is recaptured at up to 25%, and gains may owe capital-gains tax (a 1031 exchange can defer both). Figures are a year-1 estimate at your 24.0% rate — not tax advice; consult a CPA.
Schools (NCES district)
- District
- Va Beach City Public School District
- NCES district ID
- 5103840
- Math proficiency
- 69% ▼ -19.00%
- Reading proficiency
- 78% ▼ -7.00%
- Median HH income
- $66,452
- Composite
- 63.81/100
- National rank
- #594
- State rank
- #10 of 131 in VA
Livability — Virginia Beach
- Score
- 83/100
- State rank
- #38
- US rank
- #880
Category grades
Schools grade is shown separately in the Schools card above.
Census & demographics
- Census place
- Virginia Beach, VA
- County
- Virginia Beach City · 448,227 people
- City population
- 448,227
- Metro
- Virginia Beach-Norfolk-Newport News, VA-NC
- Population (ZIP)
- 44,012
- Household income
- $100,697
- Rent vs Own
- Severe rent burden
- 2588.0
Population outlook (Virginia Beach County) Hauer SSP2
- Today (2025)
- 480,401 people
- By 2030
- 491,221 · +2.3%
- By 2040
- 504,882 · +5.1%
- By 2050
- 508,847 · +5.9%
- By 2075
- 504,831 · +5.1%
- By 2100
- 465,867 · -3.0%
Race, ethnicity, and origin ACS 2023
- Neighborhood character
- Predominantly White (78%)
- Race & ethnicity
- White 78% Black 7% Hispanic / Latino 7% Two or more races 7% Asian 3%
- Hispanic origin (detail)
- Mexican 3% Puerto Rican 1%
- Common ancestry
- Slovak 3% Romanian 3% Lithuanian 3%
- Foreign-born
- 6% · Canada, Vietnam
- Languages at home
- 92% English-only · Spanish 3% Other Indo-European 2% Russian/Polish/Slavic 1%
Political lean MEDSL · Virginia Beach
- 2024 margin
- Toss-up / Even · D 50.7% · R 48.0% · Other 1.3%
- 2008→2024 swing
- +3.4pp toward D · 2008: -0.7pp · 2024: 2.6pp
- All cycles
- 2024: D+2.6 2020: D+5.4 2016: R+4.5 2012: R+2.5 2008: R+0.7
Not yet ingested
- Civics
- —
Market trends
- HPI YoY
- ▼ -530.26%
- Current HPI
- 315.521
- Rent YoY
- ▲ 5.42%
- Metro
- Virginia Beach-Norfolk-Newport News, VA-NC
- State GDP YoY
- ▲ 2.40%
- F500 in state
- 50
Industry mix (Fortune 500 HQ in VA)
| Industry | F500 HQs | Revenue |
|---|---|---|
| Aerospace / Defense | 4 | $236B |
|
||
| Technology / Defense | 3 | $32B |
|
||
| Financial Services | 2 | $176B |
|
||
| Utilities | 2 | $27B |
|
||
| Insurance | 2 | $25B |
|
||
| Technology | 2 | $15B |
|
||
Price history
+142.2% since first listed3 events — show timeline
- 2026-02-25 Listed $327,000 REINMLS
- 2006-08-07 Sold (Public Records) $225,000 Public Records
- 2004-10-07 Sold (Public Records) $135,000 Public Records
Property tax history
+3.3%/yrLatest (2025): $2,848 · +6.5% YoY. Source: county tax records.
Cash-flow waterfall
monthlySold comps — $/sqft
last 12 mo · ≤1 miLoading sold comps…