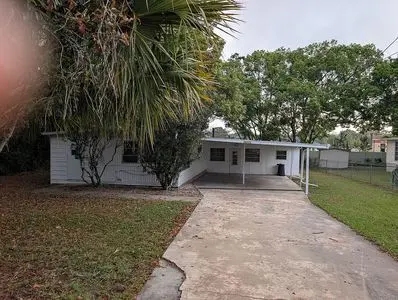
16815 SE 101st Court Rd · The Villages, FL
Flood risk 3/10 · Minor
- FEMA flood zone
- X (unshaded)
- Chance of flooding over 30 yrs
- 0.2%
- Est. flood insurance / yr
- $507 – $1,088
Fire risk 2/10 · Minimal
- Est. fire insurance / yr
- $947 – $1,759
Heat risk 8/10 · Major
- Hot days now (above 109°F)
- 7 days/yr
- Hot days in 30 yrs
- 21 days/yr
Wind risk 9/10 · Severe
- Chance of severe wind over 30 yrs
- 99.0%
Air-quality risk 3/10 · Minor
- Unhealthy air days now
- 2 days/yr
- Unhealthy air days in 30 yrs
- 2 days/yr
Risk factors via First Street. Map © Google.
Why this score? — see what drove the B+ grade
The composite is a weighted blend of 9 inputs, each scored 0–100. Each bar is that input's sub-score; the figure is the points it added to the 100-point composite (weight × sub-score).
- Cash flow +30.0/30.0
- ARV discount +15.0/15.0
- 1% rule +10.0/10.0
- DSCR +10.0/10.0
- Schools +3.6/10.0
- Livability +3.5/5.0
- Rent growth +2.5/5.0
- Condition / age +2.5/5.0
- Appreciation +0.0/10.0
$119,900
🖨 Deal sheet 📄 Offer letter ✓ Due diligence
Listing remarks
FOR SALE & acirc; & euro; & ldquo; Spacious Mobile Home on 1/4 Acre in Summerfield, FL Don & acirc; & euro; & trade; t miss this large 2,004 sq ft mobile home located in a quiet, friendly neighborhood close to everything! Property Features: 2 Bedrooms / 1 Bathroom 2,004 sq ft of living space Large family room and separate living room Master bedroom plus a smaller second bedroom Comfortable kitchen layout Carpet and vinyl flooring throughout Durable metal roof Relaxing screened-in porch Carport for covered parking Laundry room Storage shed Lot Details: 1/4 acre lot Nice, quiet neighborhood Convenient to shopping, dining, and daily needs ?? 16815 SE 101 Ct Rd, S
Key facts
- Storage room
- Open floor plan
- Double carport
Tags
Property features AI
Exterior
- Home design: Built in 1984
- Construction: Living area approximately 1,214
- Exterior features: Located in the Summerfield subdivision
Neighborhood map
What this means for you Summary
Snapshot
- This is a 2-bed/1.0-bath manufactured listed at $120k.
Deal economics
- At list price, monthly cash flow is $658 ($8k/yr) — positive.
- The deal already cash-flows at list — no discount required.
- Meets the 1% rule at list price ($2k rent vs $120k).
- Cap rate 12.9% vs local median 5.0% in The Villages — top-decile yield for the area; either an underpriced asset or a hidden risk that comps aren't pricing in. Stress-test before assuming the spread holds.
Location & tenants
- Location reads 70/100 on livability (#431 in FL) — a middle-class / working-renter tenant base. Strengths: schools A+, crime A+, housing A; Watch: amenities F, commute F, health & safety F.
- Marion (rural): math 42% / reading 43% proficiency, ranked #61 of 73 in FL (top 84%) — families likely to look elsewhere, expect single-tenant / working-renter base with shorter leases; 61% free/reduced lunch — lower-income household profile, screen leases tightly.
- Market conditions: 705 active listings in the ZIP; 12 comparable units currently listed for rent nearby; rentals at typical pace (median 21d on market — plan ~3-4 weeks tenant-placement turnaround); 7,071 units permitted in Marion County in 2024 (534 in 5+ unit buildings).
- This rent runs 33% of the median local income ($67k/yr) — at the standard rent-burdened threshold; future hikes will face affordability resistance.
Forward outlook
- Local home prices are declining (-3.0%/yr); year-one equity from $829 of loan paydown is wiped out by about $4k of value loss. Plan a longer hold.
- Marion County population projected at +13% by 2050 — modest demand growth; plan on rents tracking national, not racing it.
- At projected returns (-3.0% appreciation + 3.0% rent growth), your $34k cash investment doubles in ~6 years — after that, you're playing with house money.
Negotiation context
- Only 8 days on market — expect competitive offers; lowballing is unlikely to land.
- Current owner paid $8k; list at $120k implies a 1344% gain — meaningful room to come down on a strong offer.
Risks & watch-outs
- Climate carrying-cost: severe wind risk, 99% chance of damaging wind over 30y; extreme-heat days projected 7→21/yr by 2055 (HVAC capex compounding) — expect insurance premiums to compound above CPI over the hold.
Questions for the listing agent
- Built in 1970 — when were the roof, HVAC, electrical panel, plumbing, and water heater last replaced?
- Is there a deadline driving the sale (1031 exchange, divorce, estate, relocation)? That informs how much negotiation room exists.
- Schools are A-rated — typically a magnet for longer-tenancy family renters. What's the average tenant stay here, and is there a school-zone premium baked into asking?
- What's the average days-on-market for RENTAL listings here right now (not sales)? A rising rental-DOM trend means longer vacancies and softer asking-rent achievability than the comps imply.
- What's the recent tenant-quality profile in this submarket — average credit score on applications, eviction rate, late-payment / NSF rate, and stable-employment percentage? A property-management company in the area should have these aggregated.
- How much new for-sale + rental construction is in the pipeline within 1–3 miles? Heavy new supply typically softens prices + rents 12–24 months out; constrained supply supports both.
Investment metrics
- 1% rule
- 1.53% ✓
- Cap rate
- 12.88%
- Cash-on-cash
- 23.52%
- DSCR
- 2.05
- GRM
- 5.4
CMA / ARV
- ARV (on-the-fly)
- $178,458
- Comps found
- 3
Show comp detail 3 sales within ~0.75 mi
| Address | Dist | Beds/Ba | Sqft | Sold | Price | $/sf | Match |
|---|---|---|---|---|---|---|---|
| 16653 SE 96th Ct | 0.49mi | 2/2.0 | 1,226 (+1%) | 12mo | $215,000 | $175 | 61 |
| 16582 SE 96th Ct | 0.50mi | 2/2.0 | 1,329 (+10%) | 10mo | $195,000 | $147 | 49 |
| 9625 SE 170th Ln | 0.60mi | 2/2.0 | 1,056 (-13%) | 14mo | $80,000 | $76 | 35 |
Match score weights: distance 35% · size 25% · config 20% · recency 20%. Top-matched comps best support the ARV.
Projected returns pro-forma
-3.0% appreciation · 3.0% rent growth · sell at horizon
- IRR
- 16.6%
- Equity multiple
- 1.67×
- Total profit
- $22,492
- Equity at exit
- $17,877
- IRR
- 25.2%
- Equity multiple
- 3.19×
- Total profit
- $73,587
- Equity at exit
- $10,367
Cash invested: $33,572 (down + closing). Projections, not guarantees.
Landlord ↔ Tenant lean methodology
- Overall (STATE)
- 87 Strongly Landlord-Friendly
- State Florida
- 87 Strongly Landlord-Friendly · R+3
- County
- — inherits STATE
- City
- — inherits STATE
ZIP-level market 34491
- Home prices YoY
- -35.0%
- Active inventory
- 705
- Price-to-rent
- 5.4×
Monthly cashflow live
- Estimated rent
- $1,840 high interval (Pro) →
- Mortgage (P&I)
- −$629
- Tax from tax record
- −$117 /mo · $1,399/yr
- Insurance
- −$50
- HOA
- −$0
- Vacancy / Maint / Mgmt
- −$386
- Net cashflow
- $658
Break-even live
UW: 25.0% down · 7.5% · 30yr · 1.5% tax · 5.0% vac · 8.0% maint · 8.0% mgmt
Financing live
Cash to close
- Down payment
- $29,975
- Closing costs
- $3,597
- Reserves months
- —
- Total cash needed
- —
Loan-product check · same deal, 3 products live
Conventional
25% down · 7.5% · 30yr
- Down + closing
- —
- Monthly P&I
- —
- Monthly cashflow
- —
- DSCR
- —
- Eligible?
- —
Personal DTI + credit; lowest rate.
DSCR
20% down · 8.5% · 30yr
- Down + closing
- —
- Monthly P&I
- —
- Monthly cashflow
- —
- DSCR
- —
- Eligible?
- —
No personal income docs; deal must DSCR.
Hard money
10% down · 12.0% · 12mo
- Down + closing
- —
- Monthly P&I
- —
- Monthly cashflow
- —
- DSCR
- —
- Eligible?
- —
Short-term bridge; refi at stabilization.
Rent comps 12 comps
| Address | Beds | Baths | Sqft | Rent | $/sqft | DOM | Units | Dist |
|---|---|---|---|---|---|---|---|---|
| 9990 SE 166th St Summerfield, FL | 3.0 | 2.0 | 962 | $1,395 | $1.45 | 13d | 1 | 0.23mi |
| 17199 SE 97th Ter Summerfield, FL | 3.0 | 2.0 | 1404 | $1,990 | $1.42 | 21d | 1 | 0.55mi |
| 10326 SE 162nd Place Rd Summerfield, FL | 3.0 | 2.0 | 1419 | $2,300 | $1.62 | 13d | 1 | 0.57mi |
| 9523 SE 168th Maplesong Ln The Villages, FL | 3.0 | 2.0 | 1265 | $1,975 | $1.56 | 21d | 1 | 0.64mi |
| 16962 SE 94th Sunnybrook Cir The Villages, FL | 2.0 | 2.0 | 1160 | $2,000 | $1.72 | 21d | 1 | 0.78mi |
| 17532 SE 100th Ct Summerfield, FL | 2.0 | 2.0 | 1217 | $1,800 | $1.48 | 21d | 1 | 0.79mi |
| 10397 SE 176th St Summerfield, FL | 2.0 | 2.0 | 1296 | $2,150 | $1.66 | 21d | 1 | 0.92mi |
| 11001 SE Sunset Harbor Rd Unit H52 Summerfield, FL | 2.0 | 2.5 | 1224 | $1,440 | $1.18 | 21d | 1 | 1.03mi |
| 11001 SE Sunset Harbor Rd Summerfield, FL | 2.0 | 1.5–2.0 | 1244 | $1,770 | $1.42 | 21d | 2 | 1.07mi |
| 9195 SE 163rd St Summerfield, FL | 3.0 | 2.0 | 1410 | $1,800 | $1.28 | 21d | 1 | 1.07mi |
| 11001 SE Sunset Harbor Rd Unit A08 Summerfield, FL | 2.0 | 1.5 | 1200 | $2,000 | $1.67 | 21d | 1 | 1.08mi |
| 17713 SE 95th Cir Summerfield, FL | 3.0 | 2.0 | 1450 | $2,000 | $1.38 | 21d | 1 | 1.20mi |
Listing history 16 events
-
2026-06-18days on market $119,900 Active 8 DOM
-
2026-06-17days on market $119,900 Active 7 DOM
-
2026-06-16days on market $119,900 Active 6 DOM
-
2026-06-15days on market $119,900 Active 5 DOM
-
2026-06-14days on market $119,900 Active 3 DOM
-
2026-06-13pricedays on market $119,900 Active 2 DOM
-
2026-06-10days on market $135,000 Active 15 DOM
-
2026-06-09days on market $135,000 Active 14 DOM
-
2026-06-08days on market $135,000 Active 13 DOM
-
2026-06-07days on market $135,000 Active 12 DOM
-
2026-06-03days on market $135,000 Active 8 DOM
-
2026-06-02days on market $135,000 Active 7 DOM
-
2026-05-31days on market $135,000 Active 5 DOM
-
2026-05-30days on market $135,000 Active 4 DOM
-
2026-05-26$135,000 Active
-
1970-06-01soldstatus $8,305
ⓘ Source: listings_history table (triggers on properties + properties_extension) + one-shot
backfill from property_details.listing_events for pre-trigger history.
Tax reassessment forecast FL · Resets to sale price
- Current annual tax
- $1,399 · $117/mo
- Projected year-2 tax
- $1,399 · $117/mo
- Expected delta
- $0/yr ($0/mo · 0.0%)
ⓘ Screening estimate from a state-policy table — verify with the county assessor before closing.
Climate risk First Street
- Flood 3/10 Moderate FEMA zone X (unshaded) · 20% chance over 30 yrs
- Wildfire 2/10 Low
- Heat 8/10 Severe 7 d/yr ≥109°F today · 21 d/yr by 30 yrs out
- Wind 9/10 Extreme 99% chance of damaging wind over 30 yrs
- Air quality 3/10 Moderate 2 unhealthy d/yr today · 2 by 30 yrs out
Nearby sold comps map
Loading sold comps map…
Walkable amenities ~0.75 mi
Loading nearby amenities…
Taxation est. · year 1
- Rental income
- $22,077
- − Mortgage interest
- −$6,716
- − Property taxes
- −$1,399
- − Insurance
- −$600
- − Repairs & maintenance
- −$1,766
- − Management
- −$1,766
- − Depreciation
- −$3,488
- Taxable income
- $6,342
- Est. tax owed @ 24.0%
- −$1,522
- After-tax cash flow
- $6,375/yr
For passive investors: Depreciation is non-cash, so a rental often shows a tax loss while cash-flowing — sheltering income. Rental losses are passive: they offset passive income freely, and up to $25,000/yr can offset ordinary (W-2) income if you actively participate and your MAGI is under $100k (phasing out to $0 by $150k); unused losses carry forward. On sale, claimed depreciation is recaptured at up to 25%, and gains may owe capital-gains tax (a 1031 exchange can defer both). Figures are a year-1 estimate at your 24.0% rate — not tax advice; consult a CPA.
Schools (NCES district)
- District
- Marion
- NCES district ID
- 1201260
- Math proficiency
- 42% ▼ -7.00%
- Reading proficiency
- 43% ▼ -4.00%
- Median HH income
- $40,015
- Composite
- 35.61/100
- National rank
- #4890
- State rank
- #61 of 73 in FL
Livability — The Villages
- Score
- 70/100
- State rank
- #431
- US rank
- #7363
Category grades
Schools grade is shown separately in the Schools card above.
Census & demographics
- County
- Marion County · 315,796 people
- City population
- 83,973
- Metro
- Ocala, FL
- Population (ZIP)
- 33,318
- Household income
- $66,679
- Rent vs Own
- Severe rent burden
- 256.0
Population outlook (Marion County) Hauer SSP2
- Today (2025)
- 365,905 people
- By 2030
- 376,768 · +3.0%
- By 2040
- 396,555 · +8.4%
- By 2050
- 412,723 · +12.8%
- By 2075
- 446,090 · +21.9%
- By 2100
- 436,193 · +19.2%
Race, ethnicity, and origin ACS 2023
- Neighborhood character
- Predominantly White (77%)
- Race & ethnicity
- White 77% Hispanic / Latino 14% Two or more races 9% Black 4% Asian 2%
- Hispanic origin (detail)
- Mexican 3% Puerto Rican 6% Cuban 1%
- Common ancestry
- Lithuanian 3% Slovak 2% Romanian 2%
- Foreign-born
- 8% · Canada, Vietnam, Jamaica
- Languages at home
- 85% English-only · Spanish 11% Vietnamese 1% French/Haitian/Cajun 1%
Political lean MEDSL · Marion
- 2024 margin
- Solid R (+31.6) · D 33.8% · R 65.5%
- 2008→2024 swing
- -20.0pp toward R · 2008: -11.6pp · 2024: -31.6pp
- All cycles
- 2024: R+31.6 2020: R+25.9 2016: R+26.2 2012: R+16.2 2008: R+11.6
Not yet ingested
- Civics
- —
Market trends
- HPI YoY
- ▼ -107.67%
- Current HPI
- 200.0792
- Rent YoY
- —
- Metro
- Ocala, FL
- State GDP YoY
- ▲ 3.28%
- F500 in state
- 36
Industry mix (Fortune 500 HQ in FL)
| Industry | F500 HQs | Revenue |
|---|---|---|
| Industrial Technology | 2 | $29B |
|
||
| Insurance | 2 | $17B |
|
||
| Retail | 1 | $60B |
|
||
| Technology Distribution | 1 | $58B |
|
||
| Homebuilding | 1 | $35B |
|
||
| Technology Manufacturing | 1 | $35B |
|
||
Price history
+1525.5% since first listed2 events — show timeline
- 2026-05-26 Listed $135,000 FSBO.com
- 1970-06-01 Sold (Public Records) $8,305 Public Records
Property tax history
+8.8%/yrLatest (2025): $1,399 · +18.8% YoY. Source: county tax records.
Cash-flow waterfall
monthlySold comps — $/sqft
last 12 mo · ≤1 miLoading sold comps…