 🏷️ Likely Rental
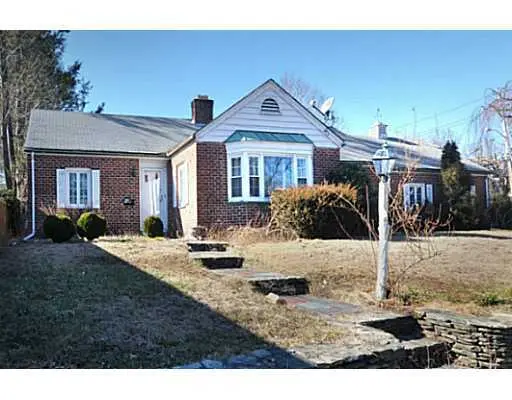
148 High Service Avenue Ave · Providence, RI
Flood risk 1/10 · Minimal
- FEMA flood zone
- X (unshaded)
- Chance of flooding over 30 yrs
- 0.0%
- Est. flood insurance / yr
- $473 – $860
Fire risk 1/10 · Minimal
- Est. fire insurance / yr
- $835 – $1,551
Heat risk 5/10 · Moderate
- Hot days now (above 96°F)
- 7 days/yr
- Hot days in 30 yrs
- 15 days/yr
Wind risk 6/10 · Moderate
- Chance of severe wind over 30 yrs
- 69.0%
Air-quality risk 2/10 · Minimal
- Unhealthy air days now
- 1 days/yr
- Unhealthy air days in 30 yrs
- 2 days/yr
Risk factors via First Street. Map © Google.
Why this score? — see what drove the D grade
The composite is a weighted blend of 9 inputs, each scored 0–100. Each bar is that input's sub-score; the figure is the points it added to the 100-point composite (weight × sub-score).
- Cash flow +15.0/30.0
- ARV discount +7.5/15.0
- 1% rule +5.0/10.0
- DSCR +5.0/10.0
- Livability +4.2/5.0
- Rent growth +3.0/5.0
- Schools +2.5/10.0
- Condition / age +2.5/5.0
- Appreciation +0.0/10.0
$4,500
🖨 Deal sheet 📄 Offer letter ✓ Due diligence
Listing remarks MLS
CHARMING 3 BED BRICK RANCH LOCATED CLOSE TO FATIMA HOSPITAL. BEAUTIFUL HARDWOODS THROUGHOUT, SPACIOUS ROOMS, FIREPLACED LIVING ROOM AND FORMAL DINING. MANY REPLACEMENT WINDOWS. INTEGRAL 2-CAR GARAGE. LOCATED ON A CORNER LOT.
Key facts
- Brick fireplace
- Remodeled kitchen
- Finished lower level
Tags
Property features AI
Finance
- HOA & community: Community amenities nearby: pool, tennis courts, shopping, public transportation, near hospital and schools
Exterior
- Parking: Attached garage (2 garage spaces); Total parking for 6 vehicles; 2 covered parking spaces
- Utilities: 200+ amp electrical service; Public water; Public sewer
- Home design: 2 stories; Combination stone foundation
- Construction: Brick and drywall construction; Built with combination/stone foundation
- Exterior features: Paved driveway
Interior
- Kitchen: Dishwasher; Microwave; Oven; Range; Range hood; Refrigerator; Disposal; Exhaust fan
- Bedrooms: Room types include bedroom spaces (listed rooms: Bathroom, Game Room, Gym, Laundry, Living Room, Media Room, Office)
- Flooring: Ceramic tile; Hardwood; Laminate; Marble
- Bathrooms: 3 full bathrooms
- Heating & cooling: Gas heating; Hot water heating; Central air conditioning
- Interior features: Furnished; Attic; Finished walk-out basement
- Laundry & utility: Washer; Dryer; Gas water heater
Neighborhood map
What this means for you Summary
Snapshot
- This is a 3-bed/2.5-bath single-family listed at $4k.
Deal economics
- At list price, monthly cash flow is $2k ($24k/yr) — positive.
- The deal already cash-flows at list — no discount required.
- Meets the 1% rule at list price ($3k rent vs $4k).
- Cap rate 545.4% vs local median 4.2% in Providence — top-decile yield for the area; either an underpriced asset or a hidden risk that comps aren't pricing in. Stress-test before assuming the spread holds.
Location & tenants
- Location reads 84/100 on livability (#2 in RI, #794 nationally) — a professional / high-income tenant draw. Strengths: amenities A+, commute A+, housing A+; Watch: employment C-, schools F.
- North Providence (suburban): math 20% / reading 37% proficiency, ranked #22 of 39 in RI (top 56%) — low school quality limits family demand, transient renter base, plan for 1-2y turnover.
- Market conditions: Rents rising (+2.1%/yr); 74 active listings in the ZIP; 14 comparable units currently listed for rent nearby; rentals leasing fast (median 11d on market — plan ~1-2 weeks tenant-placement turnaround); solid renter incomes; 776 units permitted in Providence County in 2024 (229 in 5+ unit buildings).
- This rent runs 35% of the median local income ($89k/yr) — at the standard rent-burdened threshold; future hikes will face affordability resistance.
Forward outlook
- Local home prices are declining (-3.0%/yr); year-one equity from $31 of loan paydown is wiped out by about $135 of value loss. Plan a longer hold.
- Providence County population projected at +5% by 2050 — modest demand growth; plan on rents tracking national, not racing it.
- At projected returns (-3.0% appreciation + 2.1% rent growth), your $1k cash investment doubles in ~1 year — after that, you're playing with house money.
Negotiation context
- Only 4 days on market — expect competitive offers; lowballing is unlikely to land.
- 6 sale attempts since 31y ago with the ask held roughly flat each time — persistent listings suggest the price (not the market) is what's stuck; bring a comps-based counter.
Risks & watch-outs
- Watch-outs: built in 1935 — expect roof / HVAC / electrical / plumbing capex.
- Climate carrying-cost: major wind risk, 69% chance of damaging wind over 30y; extreme-heat days projected 7→15/yr by 2055 (HVAC capex compounding) — expect insurance premiums to compound above CPI over the hold.
Questions for the listing agent
- Built in 1935 — when were the roof, HVAC, electrical panel, plumbing, and water heater last replaced?
- Is there a deadline driving the sale (1031 exchange, divorce, estate, relocation)? That informs how much negotiation room exists.
- Schools are F-rated, which usually means shorter tenancies and higher turnover. Who's the typical renter profile here, and what's been the actual vacancy rate?
- The area grade is low — what's the realistic commute time and amenity access for the typical tenant pool here? Any planned neighborhood developments (good or bad) we should know about?
- What's the average days-on-market for RENTAL listings here right now (not sales)? A rising rental-DOM trend means longer vacancies and softer asking-rent achievability than the comps imply.
- What's the recent tenant-quality profile in this submarket — average credit score on applications, eviction rate, late-payment / NSF rate, and stable-employment percentage? A property-management company in the area should have these aggregated.
- How much new for-sale + rental construction is in the pipeline within 1–3 miles? Heavy new supply typically softens prices + rents 12–24 months out; constrained supply supports both.
Investment metrics
- 1% rule
- 57.74% ✓
- Cap rate
- 545.41%
- Cash-on-cash
- 1925.41%
- DSCR
- 86.67
- GRM
- 0.1
CMA / ARV
- ARV (on-the-fly)
- $444,752
- Comps found
- 12
Show comp detail 12 sales within ~0.75 mi
| Address | Dist | Beds/Ba | Sqft | Sold | Price | $/sf | Match |
|---|---|---|---|---|---|---|---|
| 15 Homewood Ave | 0.25mi | 3/2.0 | 1,749 (+5%) | 0mo | $455,000 | $260 | 78 |
| 41 Lookout Ave | 0.24mi | 3/2.0 | 1,750 (+5%) | 2mo | $465,000 | $266 | 77 |
| 7 Plymouth Rd | 0.55mi | 3/2.0 | 1,684 (+1%) | 0mo | $415,000 | $246 | 71 |
| 62 Peckham Ave | 0.27mi | 3/2.0 | 1,500 (-10%) | 0mo | $455,000 | $303 | 68 |
| 79 Barret Ave | 0.50mi | 3/3.0 | 1,700 (+2%) | 6mo | $500,000 | $294 | 67 |
| 1625 Smith St | 0.47mi | 3/1.5 | 1,605 (-4%) | 2mo | $452,000 | $282 | 66 |
| 69 Cushing St | 0.50mi | 2/2.0 (-1) | 1,660 (-1%) | 5mo | $437,500 | $264 | 64 |
| 57 Peckham Ave | 0.29mi | 3/1.5 | 1,466 (-12%) | 0mo | $440,000 | $300 | 61 |
| 25 Pensaukee Ave | 0.56mi | 3/1.0 | 1,788 (+7%) | 0mo | $496,000 | $277 | 56 |
| 29 Justice St | 0.62mi | 3/2.0 | 1,525 (-9%) | 3mo | $390,000 | $256 | 52 |
| 2 Simpson St | 0.72mi | 3/1.0 | 1,588 (-5%) | 1mo | $377,000 | $237 | 51 |
| 49 Sampson Ave | 0.62mi | 3/1.5 | 1,848 (+10%) | 0mo | $490,000 | $265 | 49 |
Match score weights: distance 35% · size 25% · config 20% · recency 20%. Top-matched comps best support the ARV.
Projected returns pro-forma
-3.0% appreciation · 2.14% rent growth · sell at horizon
- IRR
- —
- Equity multiple
- 100.88×
- Total profit
- $125,843
- Equity at exit
- $671
- IRR
- —
- Equity multiple
- 212.55×
- Total profit
- $266,552
- Equity at exit
- $389
Cash invested: $1,260 (down + closing). Projections, not guarantees.
Landlord ↔ Tenant lean methodology
- Overall (STATE)
- 31 Tenant-Leaning
- State Rhode Island
- 31 Tenant-Leaning · D+8
- County
- — inherits STATE
- City
- — inherits STATE
ZIP-level market 02911
- Rents YoY
- 2.1%
- Active inventory
- 74
- Price-to-rent
- 0.1×
Monthly cashflow live
- Estimated rent
- $2,598 high interval (Pro) →
- Mortgage (P&I)
- −$24
- Tax est. 1.5%
- −$6 /mo · $68/yr
- Insurance
- −$2
- HOA
- −$0
- Vacancy / Maint / Mgmt
- −$546
- Net cashflow
- $2,022
Break-even live
UW: 25.0% down · 7.5% · 30yr · 1.5% tax · 5.0% vac · 8.0% maint · 8.0% mgmt
Financing live
Cash to close
- Down payment
- $1,125
- Closing costs
- $135
- Reserves months
- —
- Total cash needed
- —
Loan-product check · same deal, 3 products live
Conventional
25% down · 7.5% · 30yr
- Down + closing
- —
- Monthly P&I
- —
- Monthly cashflow
- —
- DSCR
- —
- Eligible?
- —
Personal DTI + credit; lowest rate.
DSCR
20% down · 8.5% · 30yr
- Down + closing
- —
- Monthly P&I
- —
- Monthly cashflow
- —
- DSCR
- —
- Eligible?
- —
No personal income docs; deal must DSCR.
Hard money
10% down · 12.0% · 12mo
- Down + closing
- —
- Monthly P&I
- —
- Monthly cashflow
- —
- DSCR
- —
- Eligible?
- —
Short-term bridge; refi at stabilization.
Rent comps 14 comps
| Address | Beds | Baths | Sqft | Rent | $/sqft | DOM | Units | Dist |
|---|---|---|---|---|---|---|---|---|
| 26 Beach St North Providence, RI | 3.0 | 1.0 | 1366 | $3,000 | $2.20 | 1d | 1 | 0.47mi |
| 528 Smithfield Rd North Providence, RI | 1.0–2.0 | 1.0–2.0 | 900 | $2,395 | $2.66 | 1d | 1 | 0.65mi |
| 1189 Smith St Providence, RI | 3.0 | 1.5 | 1112 | $2,400 | $2.16 | 23d | 1 | 0.69mi |
| 788 Academy Ave Unit 1 Providence, RI | 2.0 | 1.0 | 1100 | $2,400 | $2.18 | 23d | 1 | 0.80mi |
| 788 Academy Ave Unit 2 Providence, RI | 3.0 | 1.0 | 1100 | $2,500 | $2.27 | 23d | 1 | 0.80mi |
| 729 Academy Ave Providence, RI | 3.0 | 1.0 | 1261 | $2,395 | $1.90 | 17d | 1 | 0.91mi |
| 711 Academy Ave Unit 2 Providence, RI | 3.0 | 1.0 | 1565 | $2,400 | $1.53 | 4d | 1 | 0.94mi |
| 15 S Locust Ave Unit 1 North Providence, RI | 3.0 | 2.0 | 1288 | $2,800 | $2.17 | 1d | 1 | 0.96mi |
| 15 S Locust Ave Unit 1 North Providence, RI | 3.0 | 2.0 | 1288 | $2,800 | $2.17 | 10d | 1 | 0.96mi |
| 5 Emanuel St North Providence, RI | 3.0 | 2.0 | 2100 | $2,800 | $1.33 | 43d | 1 | 1.12mi |
| 23 Concannon St Providence, RI | 3.0 | 2.0 | 1484 | $2,700 | $1.82 | 23d | 1 | 1.14mi |
| 1965 Smith St Unit 2R North Providence, RI | 3.0 | 1.0 | 1200 | $2,700 | $2.25 | 1d | 1 | 1.26mi |
| 1965 Smith St North Providence, RI | 3.0 | 1.0 | 1200 | $2,700 | $2.25 | 1d | 1 | 1.27mi |
| 90 Rowley St Providence, RI | 3.0 | 1.5 | 1352 | $3,500 | $2.59 | 1d | 1 | 1.27mi |
Listing history 17 events
-
2026-05-23$4,500 Active
-
2013-12-19price $199,000 224-char remark
Show marketing remark (224 chars)
CHARMING 3 BED BRICK RANCH LOCATED CLOSE TO FATIMA HOSPITAL. BEAUTIFUL HARDWOODS THROUGHOUT, SPACIOUS ROOMS, FIREPLACED LIVING ROOM AND FORMAL DINING. MANY REPLACEMENT WINDOWS. INTEGRAL 2-CAR GARAGE. LOCATED ON A CORNER LOT.
-
2013-12-19price $229,900
Show marketing remark (224 chars)
CHARMING 3 BED BRICK RANCH LOCATED CLOSE TO FATIMA HOSPITAL. BEAUTIFUL HARDWOODS THROUGHOUT, SPACIOUS ROOMS, FIREPLACED LIVING ROOM AND FORMAL DINING. MANY REPLACEMENT WINDOWS. INTEGRAL 2-CAR GARAGE. LOCATED ON A CORNER LOT.
-
2013-12-19price $245,000
Show marketing remark (224 chars)
CHARMING 3 BED BRICK RANCH LOCATED CLOSE TO FATIMA HOSPITAL. BEAUTIFUL HARDWOODS THROUGHOUT, SPACIOUS ROOMS, FIREPLACED LIVING ROOM AND FORMAL DINING. MANY REPLACEMENT WINDOWS. INTEGRAL 2-CAR GARAGE. LOCATED ON A CORNER LOT.
-
2012-12-31soldstatus $157,336 224-char remark
Show marketing remark (224 chars)
CHARMING 3 BED BRICK RANCH LOCATED CLOSE TO FATIMA HOSPITAL. BEAUTIFUL HARDWOODS THROUGHOUT, SPACIOUS ROOMS, FIREPLACED LIVING ROOM AND FORMAL DINING. MANY REPLACEMENT WINDOWS. INTEGRAL 2-CAR GARAGE. LOCATED ON A CORNER LOT.
-
2012-12-28soldstatus $157,336
-
2012-11-13historical 224-char remark
Show marketing remark (224 chars)
CHARMING 3 BED BRICK RANCH LOCATED CLOSE TO FATIMA HOSPITAL. BEAUTIFUL HARDWOODS THROUGHOUT, SPACIOUS ROOMS, FIREPLACED LIVING ROOM AND FORMAL DINING. MANY REPLACEMENT WINDOWS. INTEGRAL 2-CAR GARAGE. LOCATED ON A CORNER LOT.
-
2011-12-16$227,000 224-char remark
Show marketing remark (224 chars)
CHARMING 3 BED BRICK RANCH LOCATED CLOSE TO FATIMA HOSPITAL. BEAUTIFUL HARDWOODS THROUGHOUT, SPACIOUS ROOMS, FIREPLACED LIVING ROOM AND FORMAL DINING. MANY REPLACEMENT WINDOWS. INTEGRAL 2-CAR GARAGE. LOCATED ON A CORNER LOT.
-
2011-12-16historical
Show marketing remark (224 chars)
CHARMING 3 BED BRICK RANCH LOCATED CLOSE TO FATIMA HOSPITAL. BEAUTIFUL HARDWOODS THROUGHOUT, SPACIOUS ROOMS, FIREPLACED LIVING ROOM AND FORMAL DINING. MANY REPLACEMENT WINDOWS. INTEGRAL 2-CAR GARAGE. LOCATED ON A CORNER LOT.
-
2011-09-20$240,000
-
2011-09-09historical
-
2011-04-04$399,900
-
1999-12-16soldstatus $138,500
-
1999-11-29historical
-
1999-09-13$144,000
-
1996-03-28soldstatus $108,000
-
1995-09-06$114,900
ⓘ Source: listings_history table (triggers on properties + properties_extension) + one-shot
backfill from property_details.listing_events for pre-trigger history.
Climate risk First Street
- Flood 1/10 Low FEMA zone X (unshaded) · 0% chance over 30 yrs
- Wildfire 1/10 Low
- Heat 5/10 Major 7 d/yr ≥96°F today · 15 d/yr by 30 yrs out
- Wind 6/10 Major 69% chance of damaging wind over 30 yrs
- Air quality 2/10 Low 1 unhealthy d/yr today · 2 by 30 yrs out
Nearby sold comps map
Loading sold comps map…
Walkable amenities ~0.75 mi
Loading nearby amenities…
Taxation est. · year 1
- Rental income
- $31,182
- − Mortgage interest
- −$252
- − Property taxes
- −$68
- − Insurance
- −$22
- − Repairs & maintenance
- −$2,495
- − Management
- −$2,495
- − Depreciation
- −$131
- Taxable income
- $25,719
- Est. tax owed @ 24.0%
- −$6,173
- After-tax cash flow
- $18,088/yr
For passive investors: Depreciation is non-cash, so a rental often shows a tax loss while cash-flowing — sheltering income. Rental losses are passive: they offset passive income freely, and up to $25,000/yr can offset ordinary (W-2) income if you actively participate and your MAGI is under $100k (phasing out to $0 by $150k); unused losses carry forward. On sale, claimed depreciation is recaptured at up to 25%, and gains may owe capital-gains tax (a 1031 exchange can defer both). Figures are a year-1 estimate at your 24.0% rate — not tax advice; consult a CPA.
Schools (NCES district)
- District
- North Providence
- NCES district ID
- 4400780
- Math proficiency
- 20% ▼ -7.00%
- Reading proficiency
- 37% ▼ -6.00%
- Median HH income
- $50,962
- Composite
- 24.99/100
- National rank
- #7560
- State rank
- #22 of 39 in RI
Livability — Providence
- Score
- 84/100
- State rank
- #2
- US rank
- #794
Category grades
Schools grade is shown separately in the Schools card above.
Census & demographics
- County
- Providence County · 548,917 people
- City population
- 212,734
- Metro
- Providence-Warwick, RI-MA
- Population (ZIP)
- 15,653
- Household income
- $89,456
- Rent vs Own
- Severe rent burden
- 428.0
Population outlook (Providence County) Hauer SSP2
- Today (2025)
- 653,469 people
- By 2030
- 660,819 · +1.1%
- By 2040
- 672,747 · +3.0%
- By 2050
- 683,741 · +4.6%
- By 2075
- 720,435 · +10.2%
- By 2100
- 741,582 · +13.5%
Race, ethnicity, and origin ACS 2023
- Neighborhood character
- Predominantly White (68%)
- Race & ethnicity
- White 68% Hispanic / Latino 15% Black 9% Two or more races 9% Asian 4%
- Hispanic origin (detail)
- Mexican 3% Puerto Rican 3% Dominican 4%
- Common ancestry
- Lithuanian 11% Romanian 3% Russian 3%
- Foreign-born
- 10% · Canada, China
- Languages at home
- 80% English-only · Spanish 9% Other Indo-European 2% French/Haitian/Cajun 2%
Political lean MEDSL · Providence
- 2024 margin
- D (+14.4) · D 56.1% · R 41.7% · Other 2.2%
- 2008→2024 swing
- -20.0pp toward R · 2008: 34.4pp · 2024: 14.4pp
- All cycles
- 2024: D+14.4 2020: D+22.9 2016: D+21.2 2012: D+34.9 2008: D+34.4
Not yet ingested
- Civics
- —
Market trends
- HPI YoY
- ▼ -227.12%
- Current HPI
- 344.312
- Rent YoY
- ▲ 2.14%
- Metro
- Providence-Warwick, RI-MA
- State GDP YoY
- ▲ 2.25%
- F500 in state
- 10
Industry mix (Fortune 500 HQ in RI)
| Industry | F500 HQs | Revenue |
|---|---|---|
| Healthcare | 1 | $373B |
|
||
| Food Distribution | 1 | $31B |
|
||
| Aerospace / Defense | 1 | $14B |
|
||
| Financial Services | 1 | $8B |
|
||
| Consumer Goods | 1 | $4B |
|
||
Price history
-96.1% since first listed17 events — show timeline
- 2026-05-23 Listed $4,500 RIS
- 2013-12-19 Price Changed $199,000 RIS
- 2013-12-19 Price Changed $229,900 RIS
- 2013-12-19 Price Changed $245,000 RIS
- 2012-12-31 Sold (MLS) $157,336 RIS
- 2012-12-28 Sold (Public Records) $157,336 Public Records
- 2012-11-13 Listing Removed — RIS
- 2011-12-16 Listed $227,000 RIS
- 2011-12-16 Listing Removed — RIS
- 2011-09-20 Listed $240,000 RIS
- 2011-09-09 Listing Removed — RIS
- 2011-04-04 Listed $399,900 RIS
- 1999-12-16 Sold (MLS) $138,500 RIS
- 1999-11-29 Listing Removed — RIS
- 1999-09-13 Listed $144,000 RIS
- 1996-03-28 Sold (MLS) $108,000 RIS
- 1995-09-06 Listed $114,900 RIS
Property tax history
+0.0%/yrLatest (2025): $6,269 · +5.8% YoY. Source: county tax records.
Cash-flow waterfall
monthlySold comps — $/sqft
last 12 mo · ≤1 miLoading sold comps…