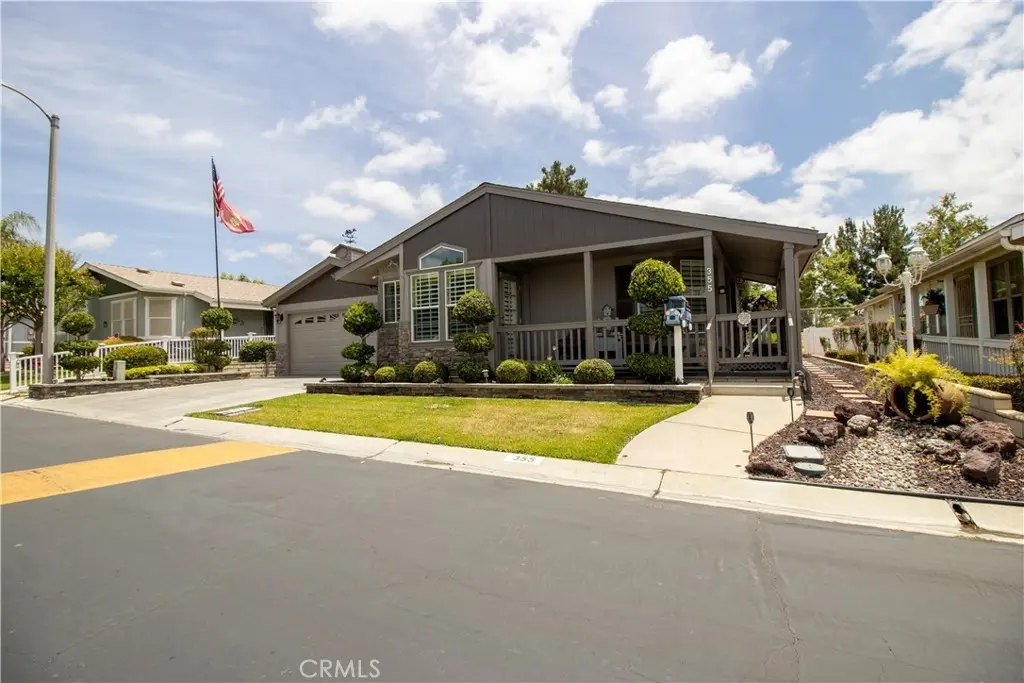
10961 Desert Lawn Dr (355 Redwood) #355 · Calimesa, CA
Flood risk 1/10 · Minimal
- FEMA flood zone
- X (unshaded)
- Chance of flooding over 30 yrs
- 0.0%
- Est. flood insurance / yr
- $507 – $1,088
Fire risk 10/10 · Severe
- Est. fire insurance / yr
- $659 – $1,223
Heat risk 6/10 · Moderate
- Hot days now (above 101°F)
- 7 days/yr
- Hot days in 30 yrs
- 20 days/yr
Wind risk 1/10 · Minimal
- Chance of severe wind over 30 yrs
- —
Air-quality risk 10/10 · Severe
- Unhealthy air days now
- 34 days/yr
- Unhealthy air days in 30 yrs
- 40 days/yr
Risk factors via First Street. Map © Google.
Why this score? — see what drove the C- grade
The composite is a weighted blend of 9 inputs, each scored 0–100. Each bar is that input's sub-score; the figure is the points it added to the 100-point composite (weight × sub-score).
- Cash flow +26.0/30.0
- DSCR +8.7/10.0
- 1% rule +6.9/10.0
- Schools +4.0/10.0
- Livability +2.8/5.0
- Rent growth +2.5/5.0
- Condition / age +2.5/5.0
- ARV discount +0.5/15.0
- Appreciation +0.0/10.0
$269,000
🖨 Deal sheet (PDF) 📄 Offer letter ✓ Due diligence
Listing remarks
Beautiful 2-Bedroom plus den, 2-Bath Home in a Desirable 55+ Senior Community Welcome home to this charming and meticulously upgraded 2-bedroom plus den, 2-bath residence located in a vibrant 55+ senior community. Perfectly maintained and move-in ready, this home offers comfort, style, and peace of mind with numerous recent updates throughout. Step inside to discover fresh interior and exterior paint that brightens every room. The kitchen has been enhanced with a modern convection oven featuring an air fryer, making meal prep effortless and enjoyable. The Master bath boast new countertops and a beautifully updated shower. You’ll also appreciate the new flooring and plush new carpet t
Key facts
- New carpet
- Newer roof
- New flooring
Tags
Property features AI
Finance
- Other: Manager approval required; Pets allowed with breed restrictions
- Financial info: Land lease in park (monthly)
- HOA & community: Plantation on the Lake park; Senior community; Association amenities include pool, spa, clubhouse, gym/exercise room, banquet facilities, billiard and card rooms, meeting/recreational rooms, pickleball, fire pit, dog park, common RV parking (call for rules and pet rules apply)
Exterior
- Parking: Attached garage; 2 garage spaces; 2 carport spaces (attached); 2 uncovered spaces; Total 6 parking spaces; Common RV parking available (RV parking fee applies)
- Security: Smoke and carbon monoxide detectors
- Utilities: Shared well water; Public sewer; Electricity connected and available; Natural gas connected and available; Water connected and available; Cable connected and available; Sewer connected/available
- Home design: Mobile home (13' x 64') — mobile home remains; Single-story; Estimated living area; Has view; Access via city streets; maintained paved road
- Construction: Drywall walls
- Exterior features: Shingle roof; Covered front porch and patio; Patio; Rain gutters; Vinyl fencing; Shed/outbuilding; Community pool
Interior
- Kitchen: Convection oven; Gas oven; Dishwasher; Garbage disposal; Gas water heater
- Bedrooms: All bedrooms on ground floor; Walk-in closet; Office/den space available
- Flooring: Carpet; Laminate
- Bathrooms: 2 full bathrooms
- Heating & cooling: Central cooling; Gas cooling connection
- Interior features: One-level layout; Entry on main level; Turnkey condition; Double-pane windows; Carbon monoxide and smoke detectors; Community spa
- Laundry & utility: Laundry room inside; Dedicated laundry room; Washer hookup; Gas and electric dryer hookup
Neighborhood map
What this means for you Summary
Snapshot
- This is a 3-bed/2.0-bath manufactured listed at $269k.
Deal economics
- At list price, monthly cash flow is $669 ($8k/yr) — positive.
- The deal already cash-flows at list — no discount required.
- Meets the 1% rule at list price ($3k rent vs $269k).
- Recommended offer: $265k (1.5% below list) — sets the bar for market timing.
- Cap rate 9.3% vs local median 6.7% in Calimesa — top-decile yield for the area; either an underpriced asset or a hidden risk that comps aren't pricing in. Stress-test before assuming the spread holds.
Location & tenants
- Location reads 55/100 on livability (#865 in CA) — a working-class tenant base; expect higher turnover. Strengths: housing A+, crime A-, employment B; Watch: health & safety D+, amenities F, commute F.
- Beaumont Unified (suburban): math 32% / reading 60% proficiency, ranked #168 of 517 in CA (top 32%) — families likely to look elsewhere, expect single-tenant / working-renter base with shorter leases.
- Zoned schools: Beaumont Senior High (math 36% / reading 63%, grade D, #352 of 1,170 statewide, top 31%, 3,328 students, 62% FRL) — zoned schools average 62% FRL vs 45% district-wide (17 pts higher); higher-poverty schools than district average — tighter screening recommended.
- Market conditions: 67 active listings in the ZIP; 1 comparable units currently listed for rent nearby; 9,195 units permitted in Riverside County in 2024 (1,512 in 5+ unit buildings).
Forward outlook
- Local home prices are declining (-3.0%/yr); year-one equity from $2k of loan paydown is wiped out by about $8k of value loss. Plan a longer hold.
- Riverside County population projected at +22% by 2050 — long-run rental-demand tailwind backs the buy-and-hold thesis.
Negotiation context
- It's been on market 22 days — a 2% lower offer ($265k) is reasonable based on typical stale-listing flexibility.
- 3 sale attempts since 18y ago with the ask held roughly flat each time — persistent listings suggest the price (not the market) is what's stuck; bring a comps-based counter.
Risks & watch-outs
- Climate carrying-cost: severe wildfire risk; extreme-heat days projected 7→20/yr by 2055 (HVAC capex compounding) — expect insurance premiums to compound above CPI over the hold.
Questions for the listing agent
- Is there a deadline driving the sale (1031 exchange, divorce, estate, relocation)? That informs how much negotiation room exists.
- Schools are D-rated, which usually means shorter tenancies and higher turnover. Who's the typical renter profile here, and what's been the actual vacancy rate?
- What's the average days-on-market for RENTAL listings here right now (not sales)? A rising rental-DOM trend means longer vacancies and softer asking-rent achievability than the comps imply.
- What's the recent tenant-quality profile in this submarket — average credit score on applications, eviction rate, late-payment / NSF rate, and stable-employment percentage? A property-management company in the area should have these aggregated.
- How much new for-sale + rental construction is in the pipeline within 1–3 miles? Heavy new supply typically softens prices + rents 12–24 months out; constrained supply supports both.
Investment metrics
- 1% rule
- 1.19% ✓
- Cap rate
- 9.28%
- Cash-on-cash
- 10.66%
- DSCR
- 1.47
- GRM
- 7.0
CMA / ARV
- ARV (on-the-fly)
- $232,624
- Comps found
- 12
Show comp detail 12 sales within ~0.75 mi
| Address | Dist | Beds/Ba | Sqft | Sold | Price | $/sf | Match |
|---|---|---|---|---|---|---|---|
| 10961 Desert Lawn Dr #79 | 0.00mi | 3/2.0 | 1,700 (-2%) | 1mo | $90,000 | $53 | 96 |
| 10961 Desert Lawn Dr #21 | 0.00mi | 3/2.0 | 1,660 (-4%) | 4mo | $250,000 | $151 | 89 |
| 10961 Desert Lawn Dr #243 | 0.00mi | 3/2.0 | 1,820 (+5%) | 4mo | $215,000 | $118 | 88 |
| 10961 Desert Lawn Dr #466 | 0.00mi | 3/2.0 | 1,600 (-8%) | 1mo | $200,000 | $125 | 86 |
| 10961 Desert Lawn #433 | 0.00mi | 3/2.0 | 1,890 (+9%) | 0mo | $250,000 | $132 | 85 |
| 10961 Desert Lawn Dr #453 | 0.00mi | 3/2.0 | 1,586 (-9%) | 3mo | $228,000 | $144 | 83 |
| 10961 Desert Lawn Dr #394 | 0.00mi | 2/2.0 (-1) | 1,612 (-7%) | 8mo | $255,000 | $158 | 76 |
| 10961 Desert Lawn Dr #331 | 0.19mi | 2/2.0 (-1) | 1,675 (-4%) | 5mo | $217,000 | $130 | 76 |
| 10961 Desert Lawn Dr #82 | 0.00mi | 2/2.0 (-1) | 1,560 (-10%) | 3mo | $265,000 | $170 | 75 |
| 10961 Desert Lawn Dr #380 | 0.19mi | 2/2.0 (-1) | 1,823 (+5%) | 3mo | $245,000 | $134 | 75 |
| 10961 Desert Lawn #257 | 0.00mi | 3/2.0 | 1,986 (+14%) | 4mo | $265,500 | $134 | 72 |
| 10961 Desert Lawn Dr #451 | 0.28mi | 2/2.0 (-1) | 1,612 (-7%) | 6mo | $235,000 | $146 | 64 |
Match score weights: distance 35% · size 25% · config 20% · recency 20%. Top-matched comps best support the ARV.
Projected returns pro-forma
-3.0% appreciation · 3.0% rent growth · sell at horizon
- IRR
- -0.3%
- Equity multiple
- 0.99×
- Total profit
- $-932
- Equity at exit
- $40,109
- IRR
- 9.4%
- Equity multiple
- 1.72×
- Total profit
- $54,250
- Equity at exit
- $23,258
Cash invested: $75,320 (down + closing). Projections, not guarantees.
Landlord ↔ Tenant lean methodology
- Overall (STATE)
- 18 Strongly Tenant-Friendly
- State California
- 18 Strongly Tenant-Friendly · D+13
- County
- — inherits STATE
- City
- — inherits STATE
ZIP-level market 92320
- Home prices YoY
- -22.2%
- Active inventory
- 67
- Price-to-rent
- 7.0×
Monthly cashflow live
- Estimated rent
- $3,200 medium interval (Pro) →
- Mortgage (P&I)
- −$1,411
- Tax est. 1.5%
- −$336 /mo · $4,035/yr
- Insurance
- −$112
- HOA
- −$0
- Vacancy / Maint / Mgmt
- −$672
- Net cashflow
- $669
Break-even live
Sensitivity live
| Price | -10% $855 | -5% $762 | +0% $669 | +5% $576 | +10% $483 |
|---|---|---|---|---|---|
| Rent | -10% $416 | -5% $543 | +0% $669 | +5% $795 | +10% $922 |
| Rate | -1.0pp $804 | -0.5pp $737 | base $669 | +0.5pp $599 | +1.0pp $528 |
UW: 25.0% down · 7.5% · 30yr · 1.5% tax · 5.0% vac · 8.0% maint · 8.0% mgmt
Financing live
Cash to close
- Down payment
- $67,250
- Closing costs
- $8,070
- Reserves months
- —
- Total cash needed
- —
Loan-product check · same deal, 3 products live
Conventional
25% down · 7.5% · 30yr
- Down + closing
- —
- Monthly P&I
- —
- Monthly cashflow
- —
- DSCR
- —
- Eligible?
- —
Personal DTI + credit; lowest rate.
DSCR
20% down · 8.5% · 30yr
- Down + closing
- —
- Monthly P&I
- —
- Monthly cashflow
- —
- DSCR
- —
- Eligible?
- —
No personal income docs; deal must DSCR.
Hard money
10% down · 12.0% · 12mo
- Down + closing
- —
- Monthly P&I
- —
- Monthly cashflow
- —
- DSCR
- —
- Eligible?
- —
Short-term bridge; refi at stabilization.
Rent comps 1 comps
| Address | Beds | Baths | Sqft | Rent | $/sqft | DOM | Units | Dist |
|---|---|---|---|---|---|---|---|---|
| 35258 Vernon Dr Beaumont, CA | 3.0 | 1.5 | 1990 | $3,200 | $1.61 | 2d | 1 | 0.86mi |
Listing history 20 events
-
2026-06-18days on market $269,000 Active 22 DOM
-
2026-06-17days on market $269,000 Active 21 DOM
-
2026-06-16days on market $269,000 Active 20 DOM
-
2026-06-15days on market $269,000 Active 19 DOM
-
2026-06-13days on market $269,000 Active 17 DOM
-
2026-06-13days on market $269,000 Active 16 DOM
-
2026-06-09days on market $269,000 Active 13 DOM
-
2026-06-08days on market $269,000 Active 12 DOM
-
2026-06-07days on market $269,000 Active 11 DOM
-
2026-06-04days on market $269,000 Active 8 DOM
-
2026-06-03days on market $269,000 Active 7 DOM
-
2026-06-02days on market $269,000 Active 6 DOM
-
2026-06-01days on market $269,000 Active 5 DOM
-
2026-05-31days on market $269,000 Active 4 DOM
-
2026-05-27$269,000 Active
-
2009-05-30historical
-
2009-03-02$139,900
-
2009-02-01historical
-
2008-11-18price $148,500
-
2008-11-05$169,000
ⓘ Source: listings_history table (triggers on properties + properties_extension) + one-shot
backfill from property_details.listing_events for pre-trigger history.
Climate risk First Street
- Flood 1/10 Low FEMA zone X (unshaded) · 0% chance over 30 yrs
- Wildfire 10/10 Extreme
- Heat 6/10 Major 7 d/yr ≥101°F today · 20 d/yr by 30 yrs out
- Wind 1/10 Low
- Air quality 10/10 Extreme 34 unhealthy d/yr today · 40 by 30 yrs out
Nearby sold comps map
Loading sold comps map…
Walkable amenities ~0.75 mi
Loading nearby amenities…
Taxation est. · year 1
- Rental income
- $38,400
- − Mortgage interest
- −$15,068
- − Property taxes
- −$4,035
- − Insurance
- −$1,345
- − Repairs & maintenance
- −$3,072
- − Management
- −$3,072
- − Depreciation
- −$7,825
- Taxable income
- $3,982
- Est. tax owed @ 24.0%
- −$956
- After-tax cash flow
- $7,072/yr
For passive investors: Depreciation is non-cash, so a rental often shows a tax loss while cash-flowing — sheltering income. Rental losses are passive: they offset passive income freely, and up to $25,000/yr can offset ordinary (W-2) income if you actively participate and your MAGI is under $100k (phasing out to $0 by $150k); unused losses carry forward. On sale, claimed depreciation is recaptured at up to 25%, and gains may owe capital-gains tax (a 1031 exchange can defer both). Figures are a year-1 estimate at your 24.0% rate — not tax advice; consult a CPA.
Schools (NCES district)
- District
- Beaumont Unified
- NCES district ID
- 0604290
- Math proficiency
- 32% ▼ -4.00%
- Reading proficiency
- 60% ▲ 11.00%
- Median HH income
- $60,635
- Composite
- 40.37/100
- National rank
- #3736
- State rank
- #168 of 517 in CA
Livability — Calimesa
- Score
- 55/100
- State rank
- #865
- US rank
- #23579
Category grades
Schools grade is shown separately in the Schools card above.
Census & demographics
- Census place
- Calimesa, CA
- City population
- 10,680
- Population (ZIP)
- 10,680
Population outlook (Riverside County) Hauer SSP2
- Today (2025)
- 2,664,475 people
- By 2030
- 2,802,692 · +5.2%
- By 2040
- 3,050,904 · +14.5%
- By 2050
- 3,256,783 · +22.2%
- By 2075
- 3,655,058 · +37.2%
- By 2100
- 3,766,594 · +41.4%
Race, ethnicity, and origin ACS 2023
- Neighborhood character
- Diverse neighborhood (Simpson 0.57)
- Race & ethnicity
- White 57% Hispanic / Latino 31% Two or more races 12% Asian 3% Black 3% Native American 1%
- Hispanic origin (detail)
- Mexican 27%
- Common ancestry
- Italian 2% Slovak 1% Lithuanian 1%
- Foreign-born
- 7% · Canada
- Languages at home
- 85% English-only · Spanish 12% Tagalog/Filipino 2%
Political lean MEDSL · Riverside
- 2024 margin
- Toss-up / Even · D 48.0% · R 49.3% · Other 2.6%
- 2008→2024 swing
- -3.6pp toward R · 2008: 2.3pp · 2024: -1.3pp
- All cycles
- 2024: R+1.3 2020: D+8.0 2016: D+4.3 2012: R+0.4 2008: D+2.3
Not yet ingested
- Civics
- —
Market trends
- HPI YoY
- ▼ -104.13%
- Current HPI
- 364.3627
- Rent YoY
- —
- Metro
- —
- State GDP YoY
- ▲ 3.21%
- F500 in state
- 116
Industry mix (Fortune 500 HQ in CA)
| Industry | F500 HQs | Revenue |
|---|---|---|
| Technology | 27 | $1,492B |
|
||
| Financial Services | 3 | $174B |
|
||
| Retail | 3 | $44B |
|
||
| Insurance | 3 | $26B |
|
||
| Media / Entertainment | 2 | $115B |
|
||
| Pharmaceuticals / Biotech | 2 | $62B |
|
||
Price history
+59.2% since first listed6 events — show timeline
- 2026-05-27 Listed $269,000 CRMLS
- 2009-05-30 Listing Removed — CRMLS
- 2009-03-02 Listed $139,900 CRMLS
- 2009-02-01 Listing Removed — CRMLS
- 2008-11-18 Price Changed $148,500 CRMLS
- 2008-11-05 Listed $169,000 CRMLS
Property tax history
-16.6%/yrLatest (2025): $61 · +0.0% YoY. Source: county tax records.
Cash-flow waterfall
monthlySold comps — $/sqft
last 12 mo · ≤1 miLoading sold comps…