7610 Stirling Rd · Davie, FL
Flood risk No data
- FEMA flood zone
- —
- Chance of flooding over 30 yrs
- —
- Est. flood insurance / yr
- —
Fire risk No data
- Est. fire insurance / yr
- —
Heat risk No data
- Hot days now (above threshold)
- —
- Hot days in 30 yrs
- —
Wind risk No data
- Chance of severe wind over 30 yrs
- —
Air-quality risk No data
- Unhealthy air days now
- —
- Unhealthy air days in 30 yrs
- —
Risk factors via First Street. Map © Google.
Why this score? — see what drove the B- grade
The composite is a weighted blend of 9 inputs, each scored 0–100. Each bar is that input's sub-score; the figure is the points it added to the 100-point composite (weight × sub-score).
- Cash flow +27.9/30.0
- DSCR +9.8/10.0
- 1% rule +7.6/10.0
- ARV discount +7.5/15.0
- Schools +4.1/10.0
- Livability +4.1/5.0
- Rent growth +2.8/5.0
- Condition / age +2.2/5.0
- Appreciation +0.0/10.0
$195,000
🖨 Deal sheet 📄 Offer letter ✓ Due diligence
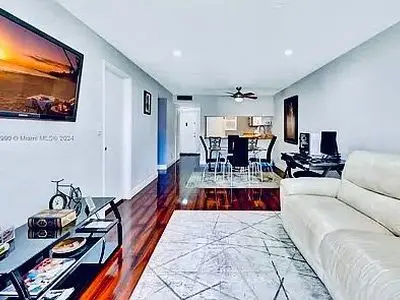
Listing remarks
Welcome to 7610 Stirling Road Unit 207-C in Hollywood, offering comfortable and convenient living in the heart of South Florida with easy access to some of the area & rsquo; s most popular destinations. This 2-bedroom, 2-bath residence features a functional layout with a spacious living room, dining area, and kitchen designed for comfortable everyday living. Additional features include central air conditioning and updated compact windows that provide natural light throughout the home. Ideally located just minutes from the Hard Rock Casino, major airports, beaches, shopping centers, restaurants, and entertainment options, this property places you close to everything South Florida has to
Key facts
- Kitchen
- Dining area
- Spacious living room
Tags
Neighborhood map
What this means for you Summary
Snapshot
- This is a 2-bed/2.0-bath condo listed at $195k. Condition is rated fair.
Deal economics
- At list price, monthly cash flow is $598 ($7k/yr) — positive.
- The deal already cash-flows at list — no discount required.
- Meets the 1% rule at list price ($2k rent vs $195k).
- Recommended offer: $192k (1.5% below list) — sets the bar for market timing.
- Cap rate 10.0% vs local median 3.4% in Davie — top-decile yield for the area; either an underpriced asset or a hidden risk that comps aren't pricing in. Stress-test before assuming the spread holds.
Location & tenants
- Location reads 82/100 on livability (#68 in FL, #1,159 nationally) — a professional / high-income tenant draw. Strengths: schools A+, crime A+, housing A+; Watch: cost of living D, amenities D-.
- Broward (suburban): math 42% / reading 53% proficiency, ranked #46 of 73 in FL (top 63%) — families likely to look elsewhere, expect single-tenant / working-renter base with shorter leases.
- Market conditions: Rents rising (+1.0%/yr); 326 active listings in the ZIP; 40 comparable units currently listed for rent nearby; rentals at typical pace (median 22d on market — plan ~3-4 weeks tenant-placement turnaround); solid renter incomes; 2,111 units permitted in Broward County in 2024 (1,265 in 5+ unit buildings).
- This rent runs 37% of the median local income ($80k/yr) — at the standard rent-burdened threshold; future hikes will face affordability resistance.
Forward outlook
- Local home prices are declining (-3.0%/yr); year-one equity from $1k of loan paydown is wiped out by about $6k of value loss. Plan a longer hold.
- Broward County population projected at +34% by 2050 — long-run rental-demand tailwind backs the buy-and-hold thesis.
Negotiation context
- It's been on market 22 days — a 2% lower offer ($192k) is reasonable based on typical stale-listing flexibility.
- 2 sale attempts since 2y ago with the ask held roughly flat each time — persistent listings suggest the price (not the market) is what's stuck; bring a comps-based counter.
Questions for the listing agent
- Have any recent inspections been done? Can we get a copy of the seller's disclosures and any deferred-maintenance estimates?
- Built in 1961 — when were the roof, HVAC, electrical panel, plumbing, and water heater last replaced?
- Any open or pending special assessments — roof, HVAC, plumbing, elevator, façade? What's the per-unit balance and payoff schedule, and is the seller paying it off at close or rolling it to the buyer?
- Is there a deadline driving the sale (1031 exchange, divorce, estate, relocation)? That informs how much negotiation room exists.
- Schools are A-rated — typically a magnet for longer-tenancy family renters. What's the average tenant stay here, and is there a school-zone premium baked into asking?
- What's the average days-on-market for RENTAL listings here right now (not sales)? A rising rental-DOM trend means longer vacancies and softer asking-rent achievability than the comps imply.
- What's the recent tenant-quality profile in this submarket — average credit score on applications, eviction rate, late-payment / NSF rate, and stable-employment percentage? A property-management company in the area should have these aggregated.
- How much new apartment / multifamily construction is in the pipeline within 1–3 miles? Heavy new supply (>2% of stock underway) typically softens rents 12–24 months out; light construction supports rent growth.
Investment metrics
- 1% rule
- 1.26% ✓
- Cap rate
- 9.97%
- Cash-on-cash
- 13.14%
- DSCR
- 1.58
- GRM
- 6.6
CMA / ARV
No comps found within radius.
Projected returns pro-forma
-3.0% appreciation · 1.01% rent growth · sell at horizon
- IRR
- 0.8%
- Equity multiple
- 1.03×
- Total profit
- $1,680
- Equity at exit
- $29,075
- IRR
- 8.3%
- Equity multiple
- 1.58×
- Total profit
- $31,580
- Equity at exit
- $16,860
Cash invested: $54,600 (down + closing). Projections, not guarantees.
Landlord ↔ Tenant lean methodology
- Overall (STATE)
- 87 Strongly Landlord-Friendly
- State Florida
- 87 Strongly Landlord-Friendly · R+3
- County
- — inherits STATE
- City
- — inherits STATE
ZIP-level market 33024
- Rents YoY
- 1.0%
- Active inventory
- 326
- Price-to-rent
- 6.6×
Monthly cashflow live
- Estimated rent
- $2,463 high interval (Pro) →
- Mortgage (P&I)
- −$1,023
- Tax est. 1.5%
- −$244 /mo · $2,925/yr
- Insurance
- −$81
- HOA
- −$0
- Vacancy / Maint / Mgmt
- −$517
- Net cashflow
- $598
Break-even live
UW: 25.0% down · 7.5% · 30yr · 1.5% tax · 5.0% vac · 8.0% maint · 8.0% mgmt
Financing live
Cash to close
- Down payment
- $48,750
- Closing costs
- $5,850
- Reserves months
- —
- Total cash needed
- —
Loan-product check · same deal, 3 products live
Conventional
25% down · 7.5% · 30yr
- Down + closing
- —
- Monthly P&I
- —
- Monthly cashflow
- —
- DSCR
- —
- Eligible?
- —
Personal DTI + credit; lowest rate.
DSCR
20% down · 8.5% · 30yr
- Down + closing
- —
- Monthly P&I
- —
- Monthly cashflow
- —
- DSCR
- —
- Eligible?
- —
No personal income docs; deal must DSCR.
Hard money
10% down · 12.0% · 12mo
- Down + closing
- —
- Monthly P&I
- —
- Monthly cashflow
- —
- DSCR
- —
- Eligible?
- —
Short-term bridge; refi at stabilization.
Rent comps 40 comps
| Address | Beds | Baths | Sqft | Rent | $/sqft | DOM | Units | Dist |
|---|---|---|---|---|---|---|---|---|
| 7610 Stirling Rd Hollywood, FL | 1.0 | 1.0 | 750 | $1,675 | $2.23 | 24d | 2 | 0.03mi |
| 7610 Stirling Rd Unit 204C Hollywood, FL | 1.0 | 1.0 | 750 | $1,675 | $2.23 | 15d | 1 | 0.04mi |
| 7025 Stirling Rd Davie, FL | 1.0–3.0 | 1.0–2.0 | 1044 | $2,696 | $2.58 | 2d | 17 | 0.09mi |
| 7550 Stirling Rd Hollywood, FL | 1.0–2.0 | 1.0–2.0 | 872 | $2,295 | $2.63 | 1d | 7 | 0.16mi |
| 7608 NW 38th Ct #14 Hollywood, FL | 2.0 | 2.0 | 831 | $2,450 | $2.95 | 24d | 1 | 0.19mi |
| 7420 Stirling Rd Hollywood, FL | 2.0 | 2.0 | 925 | $2,195 | $2.37 | 5d | 1 | 0.20mi |
| 7400 Stirling Rd Hollywood, FL | 2.0 | 1.0 | 610 | $2,118 | $3.47 | 7d | 11 | 0.30mi |
| 6651 Hidden Cove Dr Davie, FL | 3.0 | 2.5 | 1471 | $3,200 | $2.18 | 2d | 1 | 0.38mi |
| 6639 Hidden Cove Dr Unit 4-7 Davie, FL | 3.0 | 2.5 | 1471 | $3,400 | $2.31 | 24d | 1 | 0.38mi |
| 6639 Hidden Cove Dr Unit 4-7 Davie, FL | 3.0 | 2.0 | 1471 | $3,200 | $2.18 | 22d | 1 | 0.38mi |
| 3335 Palomino Dr Unit 311-3 Hollywood, FL | 3.0 | 2.0 | 1182 | $3,000 | $2.54 | 24d | 1 | 0.42mi |
| 3300 El Jardin Dr Hollywood, FL | 2.0 | 1.0 | 864 | $2,000 | $2.31 | 24d | 1 | 0.44mi |
| 6542 Hidden Cove Dr Unit 4-4 Davie, FL | 3.0 | 2.0 | 1471 | $3,000 | $2.04 | 5d | 1 | 0.47mi |
| 6542 Hidden Cove Dr Unit 4-4 Davie, FL | 3.0 | 2.0 | 1471 | $3,200 | $2.18 | 24d | 1 | 0.47mi |
| 3506 NW 79th Way Hollywood, FL | 3.0 | 2.0 | 1281 | $3,450 | $2.69 | 24d | 1 | 0.49mi |
| 7751 NW 32nd St Hollywood, FL | 3.0 | 2.0 | 1184 | $4,000 | $3.38 | 7d | 1 | 0.52mi |
| 3325 NW 79th Way Unit 3325 Hollywood, FL | 3.0 | 2.0 | 1281 | $3,325 | $2.60 | 7d | 1 | 0.57mi |
| 3211 Sabal Palm Mnr #105 Hollywood, FL | 2.0 | 2.0 | 942 | $1,666 | $1.77 | 24d | 1 | 0.57mi |
| 3271 Sabal Palm Mnr #103 Hollywood, FL | 2.0 | 2.0 | 942 | $2,100 | $2.23 | 24d | 1 | 0.60mi |
| 7442 Douglas St Hollywood, FL | 3.0 | 2.0 | 1423 | $1,700 | $1.19 | 12d | 1 | 0.64mi |
| 7442 Douglas St Hollywood, FL | 3.0 | 2.0 | 1395 | $1,700 | $1.22 | 20d | 1 | 0.64mi |
| 3241 Sabal Palm Mnr #104 Hollywood, FL | 2.0 | 2.0 | 942 | $2,150 | $2.28 | 24d | 1 | 0.67mi |
| 7541 Atlanta St #7541 Hollywood, FL | 3.0 | 2.0 | 1056 | $2,700 | $2.56 | 24d | 1 | 0.69mi |
| 300 Berkley Rd #212 Hollywood, FL | 2.0 | 2.0 | 920 | $1,995 | $2.17 | 24d | 1 | 0.70mi |
| 532 Briarwood Cir Unit 2-48 Hollywood, FL | 2.0 | 2.0 | 1220 | $2,600 | $2.13 | 24d | 1 | 0.70mi |
| 6249 Garden Ct Davie, FL | 2.0 | 2.0 | 950 | $2,399 | $2.53 | 17d | 1 | 0.70mi |
| 5500 S University Dr Fort Lauderdale, FL | 1.0–3.0 | 1.0–2.0 | 1016 | $2,574 | $2.53 | 1d | 21 | 0.71mi |
| 6243 Garden Ct Davie, FL | 2.0 | 2.0 | 950 | $2,375 | $2.50 | 24d | 1 | 0.71mi |
| 301 Cambridge Rd #301 Hollywood, FL | 2.0 | 2.0 | 920 | $1,850 | $2.01 | 20d | 1 | 0.74mi |
| 200 Gate Rd #102 Hollywood, FL | 2.0 | 2.0 | 1015 | $1,850 | $1.82 | 24d | 1 | 0.77mi |
| 100 Gate Rd Unit 3-63 Hollywood, FL | 2.0 | 2.0 | 1000 | $2,300 | $2.30 | 15d | 1 | 0.78mi |
| 200 Ashbury Rd #209 Hollywood, FL | 1.0 | 1.5 | 920 | $1,450 | $1.58 | 24d | 1 | 0.81mi |
| 3065 Tortola Way Hollywood, FL | 3.0 | 2.5 | 1280 | $4,000 | $3.12 | 15d | 1 | 0.84mi |
| 322 Briarwood Cir Unit 1-17 Hollywood, FL | 2.0 | 2.0 | 1030 | $2,500 | $2.43 | 14d | 1 | 0.89mi |
| 7851 Raleigh St Hollywood, FL | 3.0 | 2.0 | 1008 | $3,400 | $3.37 | 17d | 1 | 0.89mi |
| 2911 Cascada Isle Way #1801 Hollywood, FL | 2.0 | 2.0 | 1254 | $3,200 | $2.55 | 24d | 1 | 0.91mi |
| 2940 Solano Ave Hollywood, FL | 2.0 | 2.0 | 1176 | $2,783 | $2.37 | 20d | 1 | 0.93mi |
| 2940 Solano Ave Hollywood, FL | 1.0–3.0 | 1.0–2.0 | 1077 | $2,920 | $2.71 | 1d | 1 | 0.93mi |
| 2940 Solano Ave Hollywood, FL | 2.0 | 2.0 | 1176 | $2,842 | $2.42 | 22d | 1 | 0.93mi |
| 2940 Solano Ave Hollywood, FL | 3.0 | 2.0 | 1322 | $3,459 | $2.62 | 24d | 1 | 0.93mi |
HOA detail condo
- Monthly dues
- $0 · $0/yr
- Assessments
- None detected in remarks — confirm with the listing agent.
Listing history 16 events
-
2026-06-18days on market $195,000 Active 22 DOM
-
2026-06-17days on market $195,000 Active 21 DOM
-
2026-06-16days on market $195,000 Active 20 DOM
-
2026-06-15days on market $195,000 Active 19 DOM
-
2026-06-13days on market $195,000 Active 17 DOM
-
2026-06-09days on market $195,000 Active 13 DOM
-
2026-06-07days on market $195,000 Active 11 DOM
-
2026-06-04days on market $195,000 Active 8 DOM
-
2026-06-03days on market $195,000 Active 7 DOM
-
2026-06-02days on market $195,000 Active 6 DOM
-
2026-06-01days on market $195,000 Active 5 DOM
-
2026-05-31days on market $195,000 Active 4 DOM
-
2026-05-15$195,000 Active
-
2024-08-19historical $1,800
-
2024-07-30price $1,800
-
2024-07-26$1,900
ⓘ Source: listings_history table (triggers on properties + properties_extension) + one-shot
backfill from property_details.listing_events for pre-trigger history.
Nearby sold comps map
Loading sold comps map…
Walkable amenities ~0.75 mi
Loading nearby amenities…
Taxation est. · year 1
- Rental income
- $29,551
- − Mortgage interest
- −$10,923
- − Property taxes
- −$2,925
- − Insurance
- −$975
- − Repairs & maintenance
- −$2,364
- − Management
- −$2,364
- − Depreciation
- −$5,673
- Taxable income
- $4,327
- Est. tax owed @ 24.0%
- −$1,038
- After-tax cash flow
- $6,135/yr
For passive investors: Depreciation is non-cash, so a rental often shows a tax loss while cash-flowing — sheltering income. Rental losses are passive: they offset passive income freely, and up to $25,000/yr can offset ordinary (W-2) income if you actively participate and your MAGI is under $100k (phasing out to $0 by $150k); unused losses carry forward. On sale, claimed depreciation is recaptured at up to 25%, and gains may owe capital-gains tax (a 1031 exchange can defer both). Figures are a year-1 estimate at your 24.0% rate — not tax advice; consult a CPA.
Condition & rehab AI · 2 photos
This condo requires cosmetic repairs and maintenance, including painting and landscaping, to improve its curb appeal and value.
Repairs flagged
- Major fencing — Significant damage and wear
- Major landscaping — Overgrown and unkempt
Value-add opportunities
- Both painting — Fresh paint can significantly improve curb appeal and interior aesthetics
- Both landscaping — A well-maintained yard can enhance curb appeal and property value
Renovation cost estimate screening
| Repair item | Severity | Est. cost |
|---|---|---|
| fencing · Significant damage and wear | Major | $15,000–50,000 |
| landscaping · Overgrown and unkempt | Major | $15,000–50,000 |
| Total estimated repair cost · 2 items | $30,000–100,000 |
Value-add ROI direction
- Both painting — Fresh paint can significantly improve curb appeal and interior aesthetics ↑
- Both landscaping — A well-maintained yard can enhance curb appeal and property value ↑
ⓘ Cost ranges are severity-bucket heuristics (US national rule-of-thumb). Get contractor quotes + a written scope before underwriting a rehab budget.
Schools (NCES district)
- District
- Broward
- NCES district ID
- 1200180
- Math proficiency
- 42% ▼ -18.00%
- Reading proficiency
- 53% ▼ -5.00%
- Median HH income
- $52,139
- Composite
- 40.88/100
- National rank
- #3621
- State rank
- #46 of 73 in FL
Livability — Davie
- Score
- 82/100
- State rank
- #68
- US rank
- #1159
Category grades
Schools grade is shown separately in the Schools card above.
Census & demographics
- Census place
- Davie, FL
- County
- Broward County · 1,963,430 people
- City population
- 92,317
- Metro
- Miami-Fort Lauderdale-Pompano Beach, FL
- Population (ZIP)
- 76,585
- Household income
- $80,061
- Rent vs Own
- Severe rent burden
- 2813.0
Population outlook (Broward County) Hauer SSP2
- Today (2025)
- 2,207,033 people
- By 2030
- 2,360,704 · +7.0%
- By 2040
- 2,661,208 · +20.6%
- By 2050
- 2,946,698 · +33.5%
- By 2075
- 3,602,273 · +63.2%
- By 2100
- 3,970,984 · +79.9%
Race, ethnicity, and origin ACS 2023
- Neighborhood character
- Diverse neighborhood (Simpson 0.65)
- Race & ethnicity
- Hispanic / Latino 52% Two or more races 23% White 22% Black 17% Asian 4%
- Hispanic origin (detail)
- Mexican 3% Puerto Rican 7% Cuban 13% Dominican 5%
- Common ancestry
- Hispanic 4% Romanian 2% Estonian 1%
- Foreign-born
- 40% · Canada, Jamaica, Dominican Republic
- Languages at home
- 44% English-only · Spanish 46% French/Haitian/Cajun 5% Other Indo-European 3%
Political lean MEDSL · Broward
- 2024 margin
- D (+17.0) · D 58.0% · R 41.0%
- 2008→2024 swing
- -17.8pp toward R · 2008: 34.7pp · 2024: 17.0pp
- All cycles
- 2024: D+17.0 2020: D+29.8 2016: D+35.0 2012: D+34.9 2008: D+34.7
Not yet ingested
- Civics
- —
Market trends
- HPI YoY
- ▼ -442.20%
- Current HPI
- 464.3405
- Rent YoY
- ▲ 1.01%
- Metro
- Miami-Fort Lauderdale-Pompano Beach, FL
- State GDP YoY
- ▲ 3.28%
- F500 in state
- 36
Industry mix (Fortune 500 HQ in FL)
| Industry | F500 HQs | Revenue |
|---|---|---|
| Industrial Technology | 2 | $29B |
|
||
| Insurance | 2 | $17B |
|
||
| Retail | 1 | $60B |
|
||
| Technology Distribution | 1 | $58B |
|
||
| Homebuilding | 1 | $35B |
|
||
| Technology Manufacturing | 1 | $35B |
|
||
Price history
+10163.2% since first listed4 events — show timeline
- 2026-05-15 Listed $195,000 FSBO.com
- 2024-08-19 Rental Removed $1,800 RENT.
- 2024-07-30 Price Changed $1,800 RENT.
- 2024-07-26 Listed for Rent $1,900 RENT.
Cash-flow waterfall
monthlySold comps — $/sqft
last 12 mo · ≤1 miLoading sold comps…