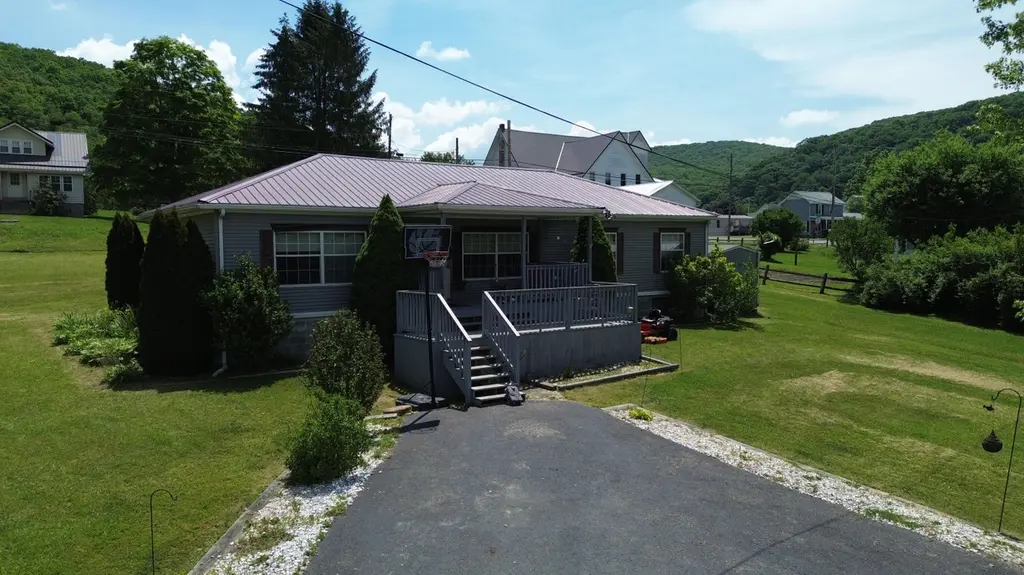
180 Third Ave · Durbin, WV
Flood risk 1/10 · Minimal
- FEMA flood zone
- X (unshaded)
- Chance of flooding over 30 yrs
- 0.0%
- Est. flood insurance / yr
- $507 – $1,088
Fire risk 2/10 · Minimal
- Est. fire insurance / yr
- $787 – $1,461
Heat risk 2/10 · Minimal
- Hot days now (above 87°F)
- 9 days/yr
- Hot days in 30 yrs
- 25 days/yr
Wind risk 2/10 · Minimal
- Chance of severe wind over 30 yrs
- —
Air-quality risk 1/10 · Minimal
- Unhealthy air days now
- 0 days/yr
- Unhealthy air days in 30 yrs
- 0 days/yr
Risk factors via First Street. Map © Google.
Why this score? — see what drove the D grade
The composite is a weighted blend of 9 inputs, each scored 0–100. Each bar is that input's sub-score; the figure is the points it added to the 100-point composite (weight × sub-score).
- Cash flow +11.0/30.0
- ARV discount +7.5/15.0
- Appreciation +5.0/10.0
- Livability +3.4/5.0
- 1% rule +3.2/10.0
- DSCR +3.2/10.0
- Schools +2.9/10.0
- Rent growth +2.5/5.0
- Condition / age +2.2/5.0
$139,900
🖨 Deal sheet (PDF) 📄 Offer letter ✓ Due diligence
Listing remarks
3b 2b home on 3/4 level acre in heart of Durbin. Town water & Sewer. Hop aboard the Durbin rocket for scenic train rides, play, hike and fish on the West Fork of the Greenbrier River & West Fork Trail.
Key facts
- 3/4 level acre
- Town sewer
- West fork trail
Tags
Property features AI
Finance
- HOA & community: Community offers fishing
Exterior
- Home design: Ranch-style residential property
- Construction: Block foundation; Built on 1,512 finished square feet
- Exterior features: Metal roof
Interior
- Flooring: Hardwood; Vinyl
- Bathrooms: 2 full bathrooms
- Heating & cooling: Heat pump heating; Central air conditioning
- Interior features: Hardwood and vinyl flooring; Total of 5 rooms
Neighborhood map
What this means for you Summary
Snapshot
- This is a 3-bed/2.0-bath single-family listed at $140k. Condition is rated fair.
Deal economics
- At list price, monthly cash flow is $-58 ($-693/yr) — negative.
- To cash-flow at today's rent, offer at most $132k (6.0% below list).
- To meet the 1% rule (rent ≥ 1% of price), the offer needs to be $115k (17.7% below list).
- Recommended offer: $115k (17.7% below list) — sets the bar for 1% rule.
Location & tenants
- Location reads 68/100 on livability (#78 in WV) — a middle-class / working-renter tenant base. Strengths: cost of living A+, housing A+; Watch: commute D+, amenities F, employment F.
- Pocahontas County Schools (rural): math 31% / reading 39% proficiency, ranked #19 of 55 in WV (top 34%) — families likely to look elsewhere, expect single-tenant / working-renter base with shorter leases.
- Zoned schools: Green Bank Elementary-Middle School (math 27% / reading 32%, grade F, #225 of 377 statewide, top 68%, 204 students, 0% FRL); Marlinton Middle School (math 27% / reading 42%, grade F, #34 of 109 statewide, top 31%, 133 students, 0% FRL); Pocahontas County High School (math 22% / reading 42%, grade F, #55 of 110 statewide, top 59%, 278 students, 0% FRL) — zoned schools average 0% FRL vs 53% district-wide (53 pts lower); this property's tenant base skews higher-income than the district average.
- Market conditions: 4 active listings in the ZIP; 2 units permitted in Pocahontas County in 2024 (0 in 5+ unit buildings).
Forward outlook
- In year one you build about $5k of equity ($967 loan paydown + $4k appreciation (3.0% local appreciation)).
- Pocahontas County population projected at -18% by 2050 — secular population decline; favor cash flow + early exit over multi-decade hold.
- At projected returns (3.0% appreciation + 3.0% rent growth), your $39k cash investment doubles in ~7 years — after that, you're playing with house money.
- By year 7, paydown + projected appreciation supports a ~$33k cash-out refi (75% LTV) — recoverable capital for the next deal without selling this one.
Negotiation context
- Only 13 days on market — expect competitive offers; lowballing is unlikely to land.
Questions for the listing agent
- What do current leases actually rent for vs. the listed asking? Can we see a recent rent roll and the last 12 months of T-12 income?
- Have any recent inspections been done? Can we get a copy of the seller's disclosures and any deferred-maintenance estimates?
- Is there a deadline driving the sale (1031 exchange, divorce, estate, relocation)? That informs how much negotiation room exists.
- Schools are F-rated, which usually means shorter tenancies and higher turnover. Who's the typical renter profile here, and what's been the actual vacancy rate?
- The area grade is low — what's the realistic commute time and amenity access for the typical tenant pool here? Any planned neighborhood developments (good or bad) we should know about?
- What's the average days-on-market for RENTAL listings here right now (not sales)? A rising rental-DOM trend means longer vacancies and softer asking-rent achievability than the comps imply.
- What's the recent tenant-quality profile in this submarket — average credit score on applications, eviction rate, late-payment / NSF rate, and stable-employment percentage? A property-management company in the area should have these aggregated.
- How much new for-sale + rental construction is in the pipeline within 1–3 miles? Heavy new supply typically softens prices + rents 12–24 months out; constrained supply supports both.
Investment metrics
- 1% rule
- 0.82% ✗
- Cap rate
- 5.80%
- Cash-on-cash
- -1.77%
- DSCR
- 0.92
- GRM
- 10.1
CMA / ARV
No comps found within radius.
Projected returns pro-forma
3.0% appreciation · 3.0% rent growth · sell at horizon
- IRR
- 5.9%
- Equity multiple
- 1.34×
- Total profit
- $13,195
- Equity at exit
- $62,905
- IRR
- 8.8%
- Equity multiple
- 2.33×
- Total profit
- $52,169
- Equity at exit
- $96,944
Cash invested: $39,172 (down + closing). Projections, not guarantees.
Landlord ↔ Tenant lean methodology
- Overall (STATE)
- 83 Strongly Landlord-Friendly
- State West Virginia
- 83 Strongly Landlord-Friendly · R+22
- County
- — inherits STATE
- City
- — inherits STATE
ZIP-level market 26264
- Active inventory
- 4
- Price-to-rent
- 10.1×
Monthly cashflow live
- Estimated rent
- $1,151 medium interval (Pro) →
- Mortgage (P&I)
- −$734
- Tax est. 1.5%
- −$175 /mo · $2,098/yr
- Insurance
- −$58
- HOA
- −$0
- Vacancy / Maint / Mgmt
- −$242
- Net cashflow
- $-58
Break-even live
Sensitivity live
| Price | -10% $39 | -5% $-9 | +0% $-58 | +5% $-106 | +10% $-154 |
|---|---|---|---|---|---|
| Rent | -10% $-149 | -5% $-103 | +0% $-58 | +5% $-12 | +10% $33 |
| Rate | -1.0pp $13 | -0.5pp $-22 | base $-58 | +0.5pp $-94 | +1.0pp $-131 |
UW: 25.0% down · 7.5% · 30yr · 1.5% tax · 5.0% vac · 8.0% maint · 8.0% mgmt
Financing live
Cash to close
- Down payment
- $34,975
- Closing costs
- $4,197
- Reserves months
- —
- Total cash needed
- —
Loan-product check · same deal, 3 products live
Conventional
25% down · 7.5% · 30yr
- Down + closing
- —
- Monthly P&I
- —
- Monthly cashflow
- —
- DSCR
- —
- Eligible?
- —
Personal DTI + credit; lowest rate.
DSCR
20% down · 8.5% · 30yr
- Down + closing
- —
- Monthly P&I
- —
- Monthly cashflow
- —
- DSCR
- —
- Eligible?
- —
No personal income docs; deal must DSCR.
Hard money
10% down · 12.0% · 12mo
- Down + closing
- —
- Monthly P&I
- —
- Monthly cashflow
- —
- DSCR
- —
- Eligible?
- —
Short-term bridge; refi at stabilization.
Listing history 11 events
-
2026-06-21days on market $139,900 Active 13 DOM
-
2026-06-21days on market $139,900 Active 12 DOM
-
2026-06-18days on market $139,900 Active 10 DOM
-
2026-06-17days on market $139,900 Active 9 DOM
-
2026-06-16days on market $139,900 Active 8 DOM
-
2026-06-15days on market $139,900 Active 7 DOM
-
2026-06-15days on market $139,900 Active 6 DOM
-
2026-06-13days on market $139,900 Active 5 DOM
-
2026-06-12days on market $139,900 Active 4 DOM
-
2026-06-09remarks 205-char remark
-
2026-06-09$139,900 Active 1 DOM
ⓘ Source: listings_history table (triggers on properties + properties_extension) + one-shot
backfill from property_details.listing_events for pre-trigger history.
Climate risk First Street
- Flood 1/10 Low FEMA zone X (unshaded) · 0% chance over 30 yrs
- Wildfire 2/10 Low
- Heat 2/10 Low 9 d/yr ≥87°F today · 25 d/yr by 30 yrs out
- Wind 2/10 Low
- Air quality 1/10 Low 0 unhealthy d/yr today · 0 by 30 yrs out
Nearby sold comps map
Loading sold comps map…
Walkable amenities ~0.75 mi
Loading nearby amenities…
Taxation est. · year 1
- Rental income
- $13,809
- − Mortgage interest
- −$7,837
- − Property taxes
- −$2,098
- − Insurance
- −$700
- − Repairs & maintenance
- −$1,105
- − Management
- −$1,105
- − Depreciation
- −$4,070
- Taxable loss
- −$3,105
- Est. tax savings @ 24.0%
- +$745
- After-tax cash flow
- $53/yr
For passive investors: Depreciation is non-cash, so a rental often shows a tax loss while cash-flowing — sheltering income. Rental losses are passive: they offset passive income freely, and up to $25,000/yr can offset ordinary (W-2) income if you actively participate and your MAGI is under $100k (phasing out to $0 by $150k); unused losses carry forward. On sale, claimed depreciation is recaptured at up to 25%, and gains may owe capital-gains tax (a 1031 exchange can defer both). Figures are a year-1 estimate at your 24.0% rate — not tax advice; consult a CPA.
Condition & rehab AI · 13 photos
The property requires moderate repairs and maintenance, including painting, landscaping, and HVAC maintenance. These updates will significantly improve its resale and rental value.
Repairs flagged
- Major Paint — Paint is faded and peeling on exterior and interior walls.
- Major Landscaping — Landscaping is overgrown and needs trimming.
- Moderate Exterior siding — Siding shows signs of wear and needs repainting or replacement.
- Moderate Interior paint — Paint is faded and peeling on interior walls and ceilings.
- Minor Landscaping — Some overgrown areas need trimming and shrubs need pruning.
Value-add opportunities
- Both Paint and refresh exterior and interior walls — Fresh paint will improve curb appeal and interior aesthetics.
- Both Landscaping and shrubbery maintenance — A well-maintained landscape enhances curb appeal and property value.
- Rental HVAC maintenance — A functional HVAC system ensures comfort and reduces energy costs.
Renovation cost estimate screening
| Repair item | Severity | Est. cost |
|---|---|---|
| Paint · Paint is faded and peeling on exterior and interior walls. | Major | $15,000–50,000 |
| Landscaping · Landscaping is overgrown and needs trimming. | Major | $15,000–50,000 |
| Exterior siding · Siding shows signs of wear and needs repainting or replacement. | Moderate | $3,000–15,000 |
| Interior paint · Paint is faded and peeling on interior walls and ceilings. | Moderate | $3,000–15,000 |
| Landscaping · Some overgrown areas need trimming and shrubs need pruning. | Minor | $500–3,000 |
| Total estimated repair cost · 5 items | $36,500–133,000 |
Value-add ROI direction
- Both Paint and refresh exterior and interior walls — Fresh paint will improve curb appeal and interior aesthetics. ↑
- Both Landscaping and shrubbery maintenance — A well-maintained landscape enhances curb appeal and property value. ↑
- Rental HVAC maintenance — A functional HVAC system ensures comfort and reduces energy costs. ↑
ⓘ Cost ranges are severity-bucket heuristics (US national rule-of-thumb). Get contractor quotes + a written scope before underwriting a rehab budget.
Schools (NCES district)
- District
- Pocahontas County Schools
- NCES district ID
- 5401140
- Math proficiency
- 31% ▼ -4.00%
- Reading proficiency
- 39% ▼ -1.00%
- Median HH income
- $35,035
- Composite
- 28.89/100
- National rank
- #6640
- State rank
- #19 of 55 in WV
Livability — Durbin
- Score
- 68/100
- State rank
- #78
- US rank
- #9204
Category grades
Schools grade is shown separately in the Schools card above.
Census & demographics
- Census place
- Durbin, WV
- Population (ZIP)
- 664
Population outlook (Pocahontas County) Hauer SSP2
- Today (2025)
- 8,115 people
- By 2030
- 7,797 · -3.9%
- By 2040
- 7,149 · -11.9%
- By 2050
- 6,639 · -18.2%
- By 2075
- 6,002 · -26.0%
- By 2100
- 5,379 · -33.7%
Race, ethnicity, and origin ACS 2023
- Neighborhood character
- Predominantly White (88%)
- Race & ethnicity
- White 88% Two or more races 10% Hispanic / Latino 2% Native American 2%
- Common ancestry
- Italian 14% Iranian 3% Lithuanian 1%
Political lean MEDSL · Pocahontas
- 2024 margin
- Solid R (+50.3) · D 23.8% · R 74.1% · Other 2.2%
- 2008→2024 swing
- -37.6pp toward R · 2008: -12.7pp · 2024: -50.3pp
- All cycles
- 2024: R+50.3 2020: R+46.1 2016: R+42.8 2012: R+24.5 2008: R+12.7
Not yet ingested
- Civics
- —
Market trends
- HPI YoY
- —
- Current HPI
- —
- Rent YoY
- —
- Metro
- —
- State GDP YoY
- —
- F500 in state
- 0
Price history
1 event — show timeline
- 2026-06-08 Listed $139,900 GVBOR
Cash-flow waterfall
monthlySold comps — $/sqft
last 12 mo · ≤1 miLoading sold comps…