471 Huereque Dr Unit A · Socorro, TX
Flood risk 1/10 · Minimal
- FEMA flood zone
- —
- Chance of flooding over 30 yrs
- 0.0%
- Est. flood insurance / yr
- —
Fire risk 3/10 · Minor
- Est. fire insurance / yr
- $1,222 – $2,270
Heat risk 6/10 · Moderate
- Hot days now (above 101°F)
- 7 days/yr
- Hot days in 30 yrs
- 25 days/yr
Wind risk 1/10 · Minimal
- Chance of severe wind over 30 yrs
- —
Air-quality risk 3/10 · Minor
- Unhealthy air days now
- 2 days/yr
- Unhealthy air days in 30 yrs
- 2 days/yr
Risk factors via First Street. Map © Google.
Why this score? — see what drove the D grade
The composite is a weighted blend of 9 inputs, each scored 0–100. Each bar is that input's sub-score; the figure is the points it added to the 100-point composite (weight × sub-score).
- Cash flow +11.0/30.0
- ARV discount +7.5/15.0
- Appreciation +4.5/10.0
- Condition / age +4.0/5.0
- Rent growth +3.8/5.0
- 1% rule +3.2/10.0
- DSCR +3.2/10.0
- Livability +3.2/5.0
- Schools +2.6/10.0
$237,000
🖨 Deal sheet (PDF) 📄 Offer letter ✓ Due diligence
Listing remarks
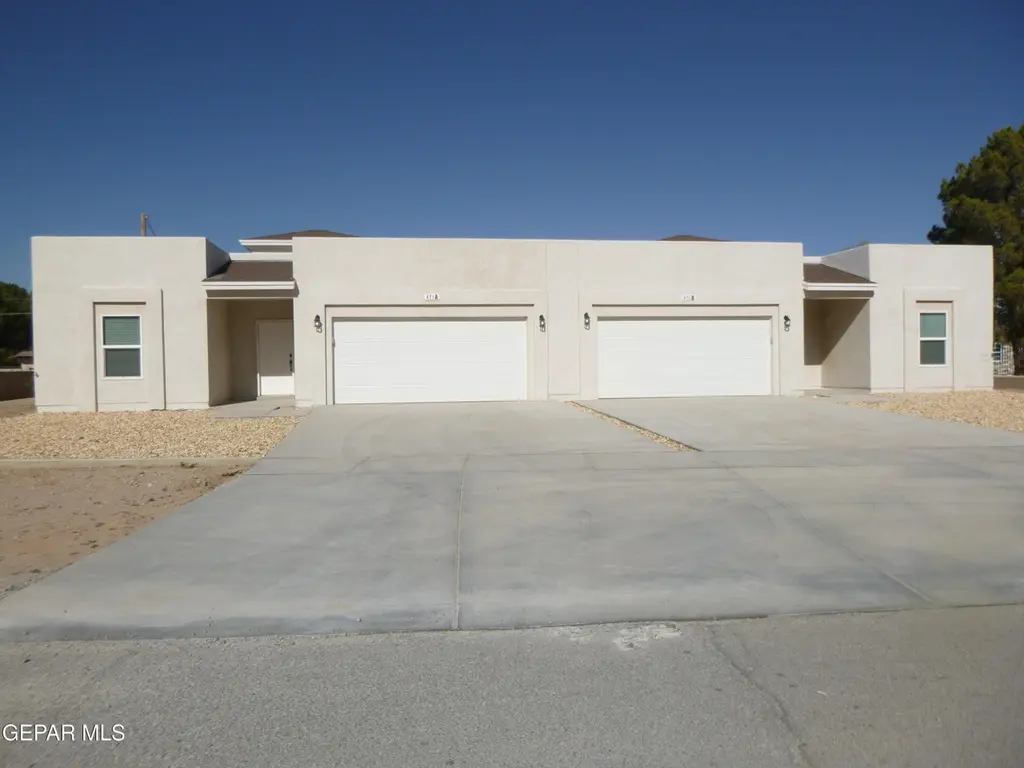
Spacious new duplex with modern style in the heart of Socorro. Featuring total of 6 bedrooms and 4 bathrooms. Each unit consist of 3 full bedrooms and 2 full bathrooms each side and Double garage. Each with an entry foyer with elegant hanging lights that opens to large modern kitchen with clean white modern cabinets with hardware and stainless steel appliances. Granite counter tops with tile back splash design. Separate breakfast bar with bay window. Large dining and living combo areas. Owners suite is zoned and with separate shower and tub. Large walk in closet with shelving. Utility room and mop sink. Each unit mirrors the other one.
Key facts
- Entry foyer
- Tile back splash
- Bay window
Tags
Property features AI
Finance
- Other: Two-unit building with a total building area of 3,808; Lot approximately 0.48 acre (about 20,050 sq ft)
Exterior
- Parking: Assigned paved parking with 2+ spaces per unit
- Utilities: All city utilities
- Home design: Duplex; Single-level and/or multiple roof lines (flat and pitched roofs)
- Construction: Composition, flat and pitched roof; Stucco construction; Built/constructed by Seca General Contractor
- Exterior features: Stucco exterior
Interior
- Kitchen: Refrigerator; Convection oven; Range hood; Disposal
- Bedrooms: Duplex with 2 total units
- Flooring: Ceramic tile; Carpet
- Heating & cooling: Central heating with forced air (natural gas); Multiple heating units (2+); Refrigerated cooling; Ceiling fans
- Interior features: Ceramic tile and carpet flooring; Range hood; Disposal; Convection oven
- Laundry & utility: Washer hookup
Neighborhood map
What this means for you Summary
Snapshot
- This is a 3-bed/2.0-bath condo listed at $237k. Condition is rated good.
Deal economics
- At list price, monthly cash flow is $-100 ($-1k/yr) — negative.
- To cash-flow at today's rent, offer at most $223k (6.1% below list).
- To meet the 1% rule (rent ≥ 1% of price), the offer needs to be $195k (17.9% below list).
- Recommended offer: $195k (17.9% below list) — sets the bar for 1% rule.
Location & tenants
- Location reads 63/100 on livability (#830 in TX) — a middle-class / working-renter tenant base. Strengths: crime A+, cost of living A+, housing A+; Watch: amenities F, commute F, employment F.
- Socorro ISD (urban): math 23% / reading 36% proficiency, ranked #624 of 826 in TX (top 76%) — low school quality limits family demand, transient renter base, plan for 1-2y turnover; 66% free/reduced lunch — lower-income household profile, screen leases tightly.
- Zoned schools: Robert R Rojas El (math 12% / reading 22%, grade F, #3,836 of 4,322 statewide, top 91%, 516 students, 89% FRL); Socorro H S (math 13% / reading 35%, grade F, #1,333 of 1,632 statewide, top 82%, 2,484 students, 87% FRL) — zoned schools average 88% FRL vs 66% district-wide (22 pts higher); higher-poverty schools than district average — tighter screening recommended.
- Market conditions: Rents rising fast (+5.3%/yr); 218 active listings in the ZIP; 10 comparable units currently listed for rent nearby; rentals leasing fast (median 5d on market — plan ~1-2 weeks tenant-placement turnaround); 2,196 units permitted in El Paso County in 2024 (143 in 5+ unit buildings).
- This rent runs 44% of the median local income ($54k/yr) — at the standard rent-burdened threshold; future hikes will face affordability resistance.
Forward outlook
- Local home prices are declining (-0.9%/yr); year-one equity from $2k of loan paydown is wiped out by about $2k of value loss. Plan a longer hold.
- El Paso County population projected at +10% by 2050 — modest demand growth; plan on rents tracking national, not racing it.
Negotiation context
- Only 3 days on market — expect competitive offers; lowballing is unlikely to land.
- 3 sale attempts; this cycle's ask has dropped $237k (50%) from the opening price — seller is motivated, your offer sets the floor, not the list.
Risks & watch-outs
- Climate carrying-cost: extreme-heat days projected 7→25/yr by 2055 (HVAC capex compounding) — expect insurance premiums to compound above CPI over the hold.
Questions for the listing agent
- What do current leases actually rent for vs. the listed asking? Can we see a recent rent roll and the last 12 months of T-12 income?
- Any open or pending special assessments — roof, HVAC, plumbing, elevator, façade? What's the per-unit balance and payoff schedule, and is the seller paying it off at close or rolling it to the buyer?
- Is there a deadline driving the sale (1031 exchange, divorce, estate, relocation)? That informs how much negotiation room exists.
- Schools are F-rated, which usually means shorter tenancies and higher turnover. Who's the typical renter profile here, and what's been the actual vacancy rate?
- The area grade is low — what's the realistic commute time and amenity access for the typical tenant pool here? Any planned neighborhood developments (good or bad) we should know about?
- What's the average days-on-market for RENTAL listings here right now (not sales)? A rising rental-DOM trend means longer vacancies and softer asking-rent achievability than the comps imply.
- What's the recent tenant-quality profile in this submarket — average credit score on applications, eviction rate, late-payment / NSF rate, and stable-employment percentage? A property-management company in the area should have these aggregated.
- How much new apartment / multifamily construction is in the pipeline within 1–3 miles? Heavy new supply (>2% of stock underway) typically softens rents 12–24 months out; light construction supports rent growth.
Investment metrics
- 1% rule
- 0.82% ✗
- Cap rate
- 5.79%
- Cash-on-cash
- -1.81%
- DSCR
- 0.92
- GRM
- 10.1
CMA / ARV
No comps found within radius.
Projected returns pro-forma
-0.93% appreciation · 5.29% rent growth · sell at horizon
- IRR
- -6.4%
- Equity multiple
- 0.72×
- Total profit
- $-18,885
- Equity at exit
- $57,965
- IRR
- 2.3%
- Equity multiple
- 1.23×
- Total profit
- $15,245
- Equity at exit
- $61,513
Cash invested: $66,360 (down + closing). Projections, not guarantees.
Landlord ↔ Tenant lean methodology
- Overall (STATE)
- 87 Strongly Landlord-Friendly
- State Texas
- 87 Strongly Landlord-Friendly · R+5
- County
- — inherits STATE
- City
- — inherits STATE
ZIP-level market 79927
- Home prices YoY
- -0.4%
- Rents YoY
- 5.3%
- Active inventory
- 218
- Price-to-rent
- 10.1×
Monthly cashflow live
- Estimated rent
- $1,947 high interval (Pro) →
- Mortgage (P&I)
- −$1,243
- Tax est. 1.5%
- −$296 /mo · $3,555/yr
- Insurance
- −$99
- HOA
- −$0
- Vacancy / Maint / Mgmt
- −$409
- Net cashflow
- $-100
Break-even live
Sensitivity live
| Price | -10% $64 | -5% $-18 | +0% $-100 | +5% $-182 | +10% $-264 |
|---|---|---|---|---|---|
| Rent | -10% $-254 | -5% $-177 | +0% $-100 | +5% $-23 | +10% $54 |
| Rate | -1.0pp $19 | -0.5pp $-40 | base $-100 | +0.5pp $-161 | +1.0pp $-224 |
UW: 25.0% down · 7.5% · 30yr · 1.5% tax · 5.0% vac · 8.0% maint · 8.0% mgmt
Financing live
Cash to close
- Down payment
- $59,250
- Closing costs
- $7,110
- Reserves months
- —
- Total cash needed
- —
Loan-product check · same deal, 3 products live
Conventional
25% down · 7.5% · 30yr
- Down + closing
- —
- Monthly P&I
- —
- Monthly cashflow
- —
- DSCR
- —
- Eligible?
- —
Personal DTI + credit; lowest rate.
DSCR
20% down · 8.5% · 30yr
- Down + closing
- —
- Monthly P&I
- —
- Monthly cashflow
- —
- DSCR
- —
- Eligible?
- —
No personal income docs; deal must DSCR.
Hard money
10% down · 12.0% · 12mo
- Down + closing
- —
- Monthly P&I
- —
- Monthly cashflow
- —
- DSCR
- —
- Eligible?
- —
Short-term bridge; refi at stabilization.
Rent comps 10 comps
| Address | Beds | Baths | Sqft | Rent | $/sqft | DOM | Units | Dist |
|---|---|---|---|---|---|---|---|---|
| 476 Deserts Dr Socorro, TX | 4.0 | 2.0 | 1563 | $1,999 | $1.28 | 4d | 1 | 0.24mi |
| 629 Guy Meyers St El Paso, TX | 4.0 | 3.0 | 1913 | $2,000 | $1.05 | 13d | 1 | 0.35mi |
| 618 Rafael Marmolejo St El Paso, TX | 4.0 | 2.0 | 2362 | $2,300 | $0.97 | 4d | 1 | 0.44mi |
| 11571 Leonor Duran St El Paso, TX | 4.0 | 2.5 | 2142 | $2,100 | $0.98 | 5d | 1 | 0.51mi |
| 12049 Hidden Gardens Pl El Paso, TX | 4.0 | 2.0 | 1467 | $1,775 | $1.21 | 25d | 1 | 0.62mi |
| 11500 Summer Dr Unit B Socorro, TX | 4.0 | 2.0 | 1594 | $1,700 | $1.07 | 4d | 1 | 0.68mi |
| 629 David Ortiz St El Paso, TX | 3.0 | 2.0 | 1447 | $1,750 | $1.21 | 4d | 1 | 0.82mi |
| 301 Vida Bonita Way Clint, TX | 3.0 | 3.0 | 1400 | $1,350 | $0.96 | 4d | 1 | 1.14mi |
| 330 Plantation Clint, TX | 4.0 | 3.0 | 1680 | $1,750 | $1.04 | 4d | 1 | 1.34mi |
| 390 Burkett Clint, TX | 3.0 | 2.0 | 2040 | $1,850 | $0.91 | 4d | 1 | 1.48mi |
HOA detail condo
- Monthly dues
- $0 · $0/yr
- Assessments
- None detected in remarks — confirm with the listing agent.
Listing history 21 events
-
2026-06-21days on market $237,000 Active 3 DOM
-
2026-06-19pricedays on market $237,000 Active 1 DOM
-
2026-06-18days on market $474,000 Active 28 DOM
-
2026-06-17days on market $474,000 Active 27 DOM
-
2026-06-16days on market $474,000 Active 26 DOM
-
2026-06-15days on market $474,000 Active 25 DOM
-
2026-06-13days on market $474,000 Active 23 DOM
-
2026-06-10days on market $474,000 Active 20 DOM
-
2026-06-09days on market $474,000 Active 19 DOM
-
2026-06-08days on market $474,000 Active 18 DOM
-
2026-06-07days on market $474,000 Active 17 DOM
-
2026-06-05days on market $474,000 Active 14 DOM
-
2026-06-03days on market $474,000 Active 13 DOM
-
2026-06-03days on market $474,000 Active 12 DOM
-
2026-06-01days on market $474,000 Active 11 DOM
-
2026-05-31days on market $474,000 Active 10 DOM
-
2026-03-03$474,000 Active
-
2025-11-04historical
-
2025-10-04$299,950 Active
-
2025-09-28historical
-
2025-01-28$299,950 Active
ⓘ Source: listings_history table (triggers on properties + properties_extension) + one-shot
backfill from property_details.listing_events for pre-trigger history.
Climate risk First Street
- Flood 1/10 Low 0% chance over 30 yrs
- Wildfire 3/10 Moderate
- Heat 6/10 Major 7 d/yr ≥101°F today · 25 d/yr by 30 yrs out
- Wind 1/10 Low
- Air quality 3/10 Moderate 2 unhealthy d/yr today · 2 by 30 yrs out
Nearby sold comps map
Loading sold comps map…
Walkable amenities ~0.75 mi
Loading nearby amenities…
Taxation est. · year 1
- Rental income
- $23,360
- − Mortgage interest
- −$13,276
- − Property taxes
- −$3,555
- − Insurance
- −$1,185
- − Repairs & maintenance
- −$1,869
- − Management
- −$1,869
- − Depreciation
- −$6,895
- Taxable loss
- −$5,288
- Est. tax savings @ 24.0%
- +$1,269
- After-tax cash flow
- $69/yr
For passive investors: Depreciation is non-cash, so a rental often shows a tax loss while cash-flowing — sheltering income. Rental losses are passive: they offset passive income freely, and up to $25,000/yr can offset ordinary (W-2) income if you actively participate and your MAGI is under $100k (phasing out to $0 by $150k); unused losses carry forward. On sale, claimed depreciation is recaptured at up to 25%, and gains may owe capital-gains tax (a 1031 exchange can defer both). Figures are a year-1 estimate at your 24.0% rate — not tax advice; consult a CPA.
Condition & rehab AI · 3 photos
This modern, move-in-ready duplex is in excellent condition with new finishes and features. Minor updates to the interior and landscaping can further enhance its value.
Value-add opportunities
- Both Paint interior walls and trim — Fresh paint enhances curb appeal and interior aesthetics.
- Both Install new light fixtures — Modern light fixtures improve aesthetics and energy efficiency.
- Both Add decorative elements to living and dining areas — Decorative elements can make the space more inviting and visually appealing.
- Both Install smart home devices — Smart home devices can increase convenience and energy efficiency, making the property more attractive to buyers and renters.
- Both Add landscaping around the front yard — Landscaping can enhance curb appeal and add value to the property.
Renovation cost estimate screening
Value-add ROI direction
- Both Paint interior walls and trim — Fresh paint enhances curb appeal and interior aesthetics. ↑
- Both Install new light fixtures — Modern light fixtures improve aesthetics and energy efficiency. ↑
- Both Add decorative elements to living and dining areas — Decorative elements can make the space more inviting and visually appealing. ↑
- Both Install smart home devices — Smart home devices can increase convenience and energy efficiency, making the property more attractive to buyers and renters. ↑
- Both Add landscaping around the front yard — Landscaping can enhance curb appeal and add value to the property. ↑
ⓘ Cost ranges are severity-bucket heuristics (US national rule-of-thumb). Get contractor quotes + a written scope before underwriting a rehab budget.
Schools (NCES district)
- District
- Socorro ISD
- NCES district ID
- 4840710
- Math proficiency
- 23% ▼ -34.00%
- Reading proficiency
- 36% ▼ -14.00%
- Median HH income
- $49,318
- Composite
- 25.67/100
- National rank
- #7396
- State rank
- #624 of 826 in TX
Livability — Socorro
- Score
- 63/100
- State rank
- #830
- US rank
- #14960
Category grades
Schools grade is shown separately in the Schools card above.
Census & demographics
- Census place
- Socorro, TX
- County
- El Paso County · 761,266 people
- City population
- 44,444
- Metro
- El Paso, TX
- Population (ZIP)
- 44,444
- Household income
- $53,652
- Rent vs Own
- Severe rent burden
- 732.0
Population outlook (El Paso County) Hauer SSP2
- Today (2025)
- 897,899 people
- By 2030
- 922,694 · +2.8%
- By 2040
- 960,492 · +7.0%
- By 2050
- 982,919 · +9.5%
- By 2075
- 997,266 · +11.1%
- By 2100
- 900,630 · +0.3%
Race, ethnicity, and origin ACS 2023
- Neighborhood character
- Predominantly Hispanic (97%)
- Race & ethnicity
- Hispanic / Latino 97% Two or more races 39% Native American 2% White 2%
- Hispanic origin (detail)
- Mexican 94%
- Foreign-born
- 34% · Canada
- Languages at home
- 16% English-only · Spanish 84%
Political lean MEDSL · El Paso
- 2024 margin
- D (+15.1) · D 57.0% · R 41.8% · Other 1.2%
- 2008→2024 swing
- -17.4pp toward R · 2008: 32.5pp · 2024: 15.1pp
- All cycles
- 2024: D+15.1 2020: D+35.1 2016: D+43.2 2012: D+32.6 2008: D+32.5
Not yet ingested
- Civics
- —
Market trends
- HPI YoY
- ▼ -0.93%
- Current HPI
- 239.646
- Rent YoY
- ▲ 5.29%
- Metro
- El Paso, TX
- State GDP YoY
- ▲ 3.95%
- F500 in state
- 110
Industry mix (Fortune 500 HQ in TX)
| Industry | F500 HQs | Revenue |
|---|---|---|
| Energy | 16 | $1,198B |
|
||
| Technology | 5 | $198B |
|
||
| Engineering / Construction | 4 | $72B |
|
||
| Energy Services | 3 | $60B |
|
||
| Utilities | 3 | $41B |
|
||
| Healthcare | 2 | $330B |
|
||
Price history
+58.0% since first listed5 events — show timeline
- 2026-03-03 Listed $474,000 GEPARMLS
- 2025-11-04 Listing Removed — GEPARMLS
- 2025-10-04 Listed $299,950 GEPARMLS
- 2025-09-28 Listing Removed — GEPARMLS
- 2025-01-28 Listed $299,950 GEPARMLS
Cash-flow waterfall
monthlySold comps — $/sqft
last 12 mo · ≤1 miLoading sold comps…