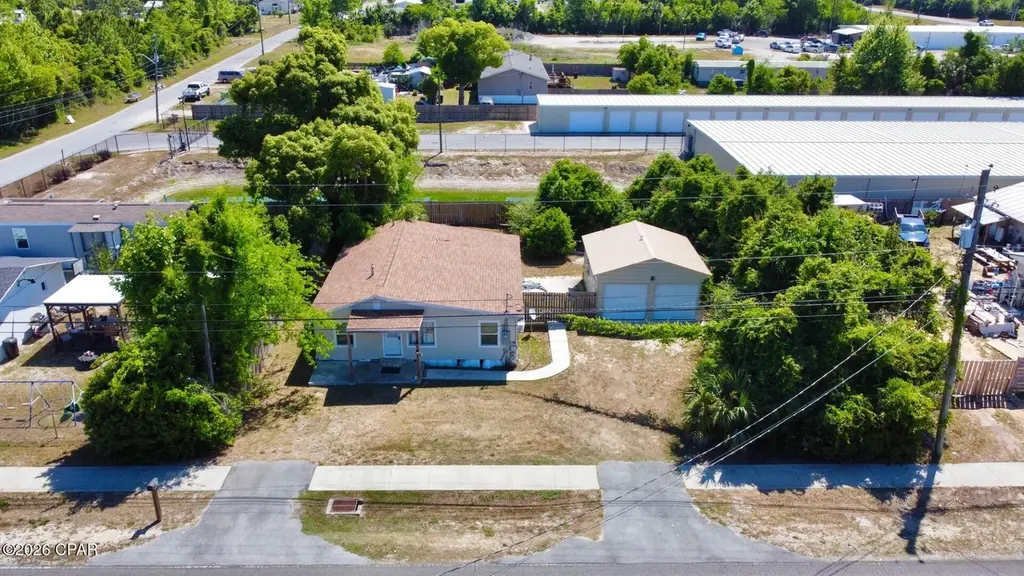
330 N Highway 22 A · Callaway, FL
Flood risk No data
- FEMA flood zone
- —
- Chance of flooding over 30 yrs
- —
- Est. flood insurance / yr
- —
Fire risk No data
- Est. fire insurance / yr
- —
Heat risk No data
- Hot days now (above threshold)
- —
- Hot days in 30 yrs
- —
Wind risk No data
- Chance of severe wind over 30 yrs
- —
Air-quality risk No data
- Unhealthy air days now
- —
- Unhealthy air days in 30 yrs
- —
Risk factors via First Street. Map © Google.
Why this score? — see what drove the B+ grade
The composite is a weighted blend of 9 inputs, each scored 0–100. Each bar is that input's sub-score; the figure is the points it added to the 100-point composite (weight × sub-score).
- Cash flow +30.0/30.0
- ARV discount +15.0/15.0
- DSCR +10.0/10.0
- 1% rule +8.7/10.0
- Schools +4.3/10.0
- Livability +3.2/5.0
- Rent growth +2.8/5.0
- Condition / age +1.0/5.0
- Appreciation +0.0/10.0
$119,900
🖨 Deal sheet 📄 Offer letter ✓ Due diligence
Listing remarks
Investment opportunity for this 3 bedroom 1 bath Callaway home located just minutes from the Tyndall Parkway corridor, shopping and dining. This property features a 3 bedroom 1 bath home in need of remodeling along with a 20x20x9 shop/garage with two 8x7 roll up doors built in 2023 all sitting on a 100x132 lot. If measurements are important, please verify.
Key facts
- 0.3 acre lot
- 2 garage spots
- Built 1948
Property features AI
Finance
- HOA & community: Short-term rentals allowed
Exterior
- Parking: Attached garage with 2 parking spaces; Additional garage structures on property
- Utilities: Electricity available; Sewer available
- Home design: Single-story residence; Zoned for single-family residential
- Construction: Vinyl siding with wood frame construction; Asphalt roof
- Exterior features: Patio; Privacy fencing; Paved lot
Interior
- Kitchen: Electric cooktop
- Bedrooms: Primary bedroom on the first level
- Bathrooms: 1 full bathroom
- Heating & cooling: Electric heating; Central air conditioning
- Interior features: 3 total rooms; Kitchen on the first level; Living room on the first level; Primary bedroom on the first level; Patio access from exterior
- Laundry & utility: Electric water heater
Neighborhood map
What this means for you Summary
Snapshot
- This is a 3-bed/1.0-bath single-family listed at $120k. Condition is rated poor.
Deal economics
- At list price, monthly cash flow is $472 ($6k/yr) — positive.
- The deal already cash-flows at list — no discount required.
- Meets the 1% rule at list price ($2k rent vs $120k).
- Recommended offer: $116k (3.0% below list) — sets the bar for market timing.
- Cap rate 11.0% vs local median 5.1% in Callaway — top-decile yield for the area; either an underpriced asset or a hidden risk that comps aren't pricing in. Stress-test before assuming the spread holds.
Location & tenants
- Location reads 64/100 on livability (#690 in FL) — a middle-class / working-renter tenant base. Strengths: cost of living A+, housing A+; Watch: employment D+, schools F, amenities F.
- Bay (suburban): math 51% / reading 51% proficiency, ranked #29 of 73 in FL (top 40%) — acceptable for families but not a draw, mixed tenant base, ~2y average lease.
- Market conditions: Rents rising (+1.1%/yr); 969 active listings in the ZIP; 30 comparable units currently listed for rent nearby; rentals at typical pace (median 21d on market — plan ~3-4 weeks tenant-placement turnaround); 2,473 units permitted in Bay County in 2024 (559 in 5+ unit buildings).
Forward outlook
- Local home prices are declining (-3.0%/yr); year-one equity from $829 of loan paydown is wiped out by about $4k of value loss. Plan a longer hold.
- Bay County population projected at +24% by 2050 — long-run rental-demand tailwind backs the buy-and-hold thesis.
- At projected returns (-3.0% appreciation + 1.1% rent growth), your $34k cash investment doubles in ~9 years — after that, you're playing with house money.
Negotiation context
- It's been on market 41 days — a 3% lower offer ($116k) is reasonable based on typical stale-listing flexibility.
Risks & watch-outs
- Watch-outs: built in 1948 — expect roof / HVAC / electrical / plumbing capex.
Questions for the listing agent
- It's been on market 41 days. Have you received any prior offers? Is the seller open to a 3% concession, seller financing, or rate buy-down credit?
- Have any recent inspections been done? Can we get a copy of the seller's disclosures and any deferred-maintenance estimates?
- Built in 1948 — when were the roof, HVAC, electrical panel, plumbing, and water heater last replaced?
- Is there a deadline driving the sale (1031 exchange, divorce, estate, relocation)? That informs how much negotiation room exists.
- Schools are F-rated, which usually means shorter tenancies and higher turnover. Who's the typical renter profile here, and what's been the actual vacancy rate?
- What's the average days-on-market for RENTAL listings here right now (not sales)? A rising rental-DOM trend means longer vacancies and softer asking-rent achievability than the comps imply.
- What's the recent tenant-quality profile in this submarket — average credit score on applications, eviction rate, late-payment / NSF rate, and stable-employment percentage? A property-management company in the area should have these aggregated.
- How much new for-sale + rental construction is in the pipeline within 1–3 miles? Heavy new supply typically softens prices + rents 12–24 months out; constrained supply supports both.
Investment metrics
- 1% rule
- 1.37% ✓
- Cap rate
- 11.01%
- Cash-on-cash
- 16.86%
- DSCR
- 1.75
- GRM
- 6.1
CMA / ARV
- ARV (median comp)
- $222,917
- List price
- $119,900
- Delta
- -46.21%
- Verdict
- UNDERPRICED
- Comps
- 20 within 1.0 mi
Show comp detail 12 sales within ~0.75 mi
| Address | Dist | Beds/Ba | Sqft | Sold | Price | $/sf | Match |
|---|---|---|---|---|---|---|---|
| 4819 Alameda St | 0.19mi | 3/2.0 | 1,312 (+1%) | 9mo | $255,000 | $194 | 77 |
| 5301 E Hwy 22 | 0.27mi | 3/2.0 | 1,408 (+9%) | 16mo | $277,000 | $197 | 55 |
| 4117 Cherry Ln | 0.45mi | 3/2.0 | 1,393 (+8%) | 14mo | $251,000 | $180 | 51 |
| 116 Martin Lake Dr | 0.43mi | 3/1.0 | 1,143 (-12%) | 12mo | $140,000 | $122 | 50 |
| 4004 E 7th Cir | 0.64mi | 3/2.0 | 1,236 (-5%) | 11mo | $265,000 | $214 | 50 |
| 4126 Leslie Ln | 0.37mi | 3/2.0 | 1,442 (+11%) | 13mo | $285,000 | $198 | 49 |
| 3753 E 4th | 0.64mi | 3/2.0 | 1,325 (+2%) | 19mo | $241,000 | $182 | 47 |
| 5329 Garden Cove Rd | 0.39mi | 3/2.0 | 1,110 (-14%) | 10mo | $205,000 | $185 | 46 |
| 3806 E 2nd Plz | 0.59mi | 3/2.0 | 1,183 (-9%) | 15mo | $227,000 | $192 | 42 |
| 4119 Cherry St | 0.61mi | 3/2.0 | 1,188 (-8%) | 18mo | $160,000 | $135 | 39 |
| 927 Bonnie Dr | 0.75mi | 3/2.0 | 1,142 (-12%) | 10mo | $265,000 | $232 | 33 |
| 807 Flight Ave | 0.72mi | 4/2.0 (+1) | 1,444 (+11%) | 9mo | $300,000 | $208 | 31 |
Match score weights: distance 35% · size 25% · config 20% · recency 20%. Top-matched comps best support the ARV.
Projected returns pro-forma
-3.0% appreciation · 1.12% rent growth · sell at horizon
- IRR
- 5.9%
- Equity multiple
- 1.23×
- Total profit
- $7,579
- Equity at exit
- $17,877
- IRR
- 13.6%
- Equity multiple
- 1.99×
- Total profit
- $33,306
- Equity at exit
- $10,367
Cash invested: $33,572 (down + closing). Projections, not guarantees.
Landlord ↔ Tenant lean methodology
- Overall (STATE)
- 87 Strongly Landlord-Friendly
- State Florida
- 87 Strongly Landlord-Friendly · R+3
- County
- — inherits STATE
- City
- — inherits STATE
ZIP-level market 32404
- Home prices YoY
- -16.1%
- Rents YoY
- 1.1%
- Active inventory
- 969
- Price-to-rent
- 6.1×
Monthly cashflow live
- Estimated rent
- $1,646 high interval (Pro) →
- Mortgage (P&I)
- −$629
- Tax est. 1.5%
- −$150 /mo · $1,798/yr
- Insurance
- −$50
- HOA
- −$0
- Vacancy / Maint / Mgmt
- −$346
- Net cashflow
- $472
Break-even live
UW: 25.0% down · 7.5% · 30yr · 1.5% tax · 5.0% vac · 8.0% maint · 8.0% mgmt
Financing live
Cash to close
- Down payment
- $29,975
- Closing costs
- $3,597
- Reserves months
- —
- Total cash needed
- —
Loan-product check · same deal, 3 products live
Conventional
25% down · 7.5% · 30yr
- Down + closing
- —
- Monthly P&I
- —
- Monthly cashflow
- —
- DSCR
- —
- Eligible?
- —
Personal DTI + credit; lowest rate.
DSCR
20% down · 8.5% · 30yr
- Down + closing
- —
- Monthly P&I
- —
- Monthly cashflow
- —
- DSCR
- —
- Eligible?
- —
No personal income docs; deal must DSCR.
Hard money
10% down · 12.0% · 12mo
- Down + closing
- —
- Monthly P&I
- —
- Monthly cashflow
- —
- DSCR
- —
- Eligible?
- —
Short-term bridge; refi at stabilization.
Rent comps 30 comps
| Address | Beds | Baths | Sqft | Rent | $/sqft | DOM | Units | Dist |
|---|---|---|---|---|---|---|---|---|
| 4905 Alameda St Unit 1 Panama City, FL | 3.0 | 2.0 | 942 | $1,295 | $1.37 | 20d | 1 | 0.15mi |
| 5101 Willow St Panama City, FL | 3.0 | 2.0 | 1099 | $1,500 | $1.36 | 13d | 1 | 0.17mi |
| 208 North Highway 22 A Unit 33 Panama City, FL | 3.0 | 2.0 | 1080 | $1,350 | $1.25 | 20d | 1 | 0.29mi |
| 526 Camellia Ave Panama City, FL | 3.0 | 2.0 | 1375 | $1,950 | $1.42 | 20d | 1 | 0.44mi |
| 149 North Highway 22 A Unit 5 Panama City, FL | 2.0 | 1.0 | 900 | $1,140 | $1.27 | 13d | 1 | 0.45mi |
| 129 Seneca Ave Panama City, FL | 3.0 | 2.0 | 1449 | $1,495 | $1.03 | 13d | 1 | 0.53mi |
| 420 Raven Ln Panama City, FL | 3.0 | 2.0 | 1251 | $1,750 | $1.40 | 20d | 1 | 0.57mi |
| 5817 Jasmine Ct Panama City, FL | 4.0 | 2.5 | 1633 | $2,000 | $1.22 | 13d | 1 | 0.70mi |
| 229 Callaway Chase Ln Panama City, FL | 3.0 | 2.5 | 1200 | $1,650 | $1.38 | 13d | 1 | 0.72mi |
| 5117 E 10th St Apt A Panama City, FL | 2.0 | 1.5 | 936 | $1,200 | $1.28 | 13d | 1 | 0.83mi |
| 5117 E 10th St Unit D Panama City, FL | 2.0 | 1.5 | 950 | $1,250 | $1.32 | 13d | 1 | 0.83mi |
| 5805 Cherry St Panama City, FL | 2.0 | 1.0 | 1025 | $1,200 | $1.17 | 13d | 1 | 0.84mi |
| 906 Kevin Ct Panama City, FL | 3.0 | 2.0 | 1266 | $1,795 | $1.42 | 20d | 1 | 0.85mi |
| 237 Helen Ave Panama City, FL | 2.0 | 2.0 | 1000 | $1,395 | $1.40 | 20d | 1 | 0.88mi |
| 6101 Harvey St #3 Panama City, FL | 2.0 | 1.5 | 1108 | $1,050 | $0.95 | 20d | 1 | 0.95mi |
| 6121 Harvey St Unit 8 Panama City, FL | 2.0 | 1.5 | 1200 | $1,050 | $0.88 | 20d | 1 | 0.96mi |
| 6121 Harvey St Apt 16 Panama City, FL | 2.0 | 1.5 | 1000 | $1,090 | $1.09 | 20d | 1 | 0.96mi |
| 4837 S Lakewood Dr Panama City, FL | 2.0 | 1.5 | 1116 | $1,500 | $1.34 | 20d | 1 | 1.01mi |
| 322 S Burkett Dr Panama City, FL | 1.0–2.0 | 1.0–2.0 | 600 | $1,519 | $2.53 | 13d | 13 | 1.05mi |
| 3719 E 8th Ct Panama City, FL | 1.0–4.0 | 1.0–1.5 | 950 | $1,300 | $1.37 | 20d | 1 | 1.06mi |
| 509 Phillips Ct Panama City, FL | 3.0 | 2.0 | 1411 | $1,700 | $1.20 | 13d | 1 | 1.17mi |
| 114 S Kimbrel Ave Panama City, FL | 3.0 | 2.0 | 1400 | $1,850 | $1.32 | 20d | 1 | 1.19mi |
| 5813 Hickory St Panama City, FL | 3.0 | 2.0 | 1200 | $1,950 | $1.62 | 20d | 1 | 1.26mi |
| 168 N Comet Ave Panama City, FL | 2.0 | 2.0 | 950 | $1,100 | $1.16 | 20d | 1 | 1.31mi |
| 5717 Rebecca Ct Unit B Panama City, FL | 2.0 | 1.0 | 1612 | $1,350 | $0.84 | 20d | 1 | 1.33mi |
| 5115 E 14th St Unit 3 Panama City, FL | 2.0 | 2.0 | 978 | $1,250 | $1.28 | 20d | 1 | 1.34mi |
| 6328 Olokee St Panama City, FL | 3.0 | 2.0 | 1131 | $1,850 | $1.64 | 13d | 1 | 1.40mi |
| 163 Lauren Ln Panama City, FL | 4.0 | 2.0 | 1731 | $2,300 | $1.33 | 20d | 1 | 1.42mi |
| 4141 E 15th St Panama City, FL | 2.0–3.0 | 2.0 | 1082 | $1,825 | $1.69 | 13d | 9 | 1.43mi |
| 1401 Transmitter Rd Unit 15 Panama City, FL | 3.0 | 2.0 | 1100 | $1,395 | $1.27 | 13d | 1 | 1.45mi |
Listing history 17 events
-
2026-06-17status $119,900 Pending 41 DOM
-
2026-06-17days on market $119,900 Active 41 DOM
-
2026-06-16days on market $119,900 Active 40 DOM
-
2026-06-15days on market $119,900 Active 39 DOM
-
2026-06-14days on market $119,900 Active 37 DOM
-
2026-06-13days on market $119,900 Active 36 DOM
-
2026-06-10days on market $119,900 Active 34 DOM
-
2026-06-09days on market $119,900 Active 33 DOM
-
2026-06-08days on market $119,900 Active 32 DOM
-
2026-06-07pricedays on market $119,900 Active 31 DOM
-
2026-06-05days on market $125,000 Active 28 DOM
-
2026-06-03days on market $125,000 Active 27 DOM
-
2026-06-02days on market $125,000 Active 26 DOM
-
2026-06-01days on market $125,000 Active 25 DOM
-
2026-05-31days on market $125,000 Active 24 DOM
-
2026-05-30days on market $125,000 Active 23 DOM
-
2026-05-07$125,000 Active 358-char remark
ⓘ Source: listings_history table (triggers on properties + properties_extension) + one-shot
backfill from property_details.listing_events for pre-trigger history.
Nearby sold comps map
Loading sold comps map…
Walkable amenities ~0.75 mi
Loading nearby amenities…
Taxation est. · year 1
- Rental income
- $19,751
- − Mortgage interest
- −$6,716
- − Property taxes
- −$1,798
- − Insurance
- −$600
- − Repairs & maintenance
- −$1,580
- − Management
- −$1,580
- − Depreciation
- −$3,488
- Taxable income
- $3,988
- Est. tax owed @ 24.0%
- −$957
- After-tax cash flow
- $4,703/yr
For passive investors: Depreciation is non-cash, so a rental often shows a tax loss while cash-flowing — sheltering income. Rental losses are passive: they offset passive income freely, and up to $25,000/yr can offset ordinary (W-2) income if you actively participate and your MAGI is under $100k (phasing out to $0 by $150k); unused losses carry forward. On sale, claimed depreciation is recaptured at up to 25%, and gains may owe capital-gains tax (a 1031 exchange can defer both). Figures are a year-1 estimate at your 24.0% rate — not tax advice; consult a CPA.
Condition & rehab AI · 11 photos
This property requires extensive renovations, including exterior siding repair, carpet replacement, and kitchen and bath fixture updates, to improve its condition and value.
Repairs flagged
- Major Exterior siding — Weathered and in need of repair.
- Major Carpeted flooring — Worn and dirty, needs replacement.
- Major Interior walls/paint — Chipped and dirty, needs repainting.
- Major Kitchen and bath fixtures — No visible fixtures, likely in need of replacement.
- Major Roof — No visible roof condition, likely in need of inspection and repair.
Value-add opportunities
- Both Exterior siding repair — Improves curb appeal and property value.
- Both Carpet replacement — Fresh carpet enhances interior appeal and comfort.
- Both Interior painting — Fresh paint improves aesthetics and property value.
- Both Kitchen and bath fixture replacement — Modern fixtures improve functionality and appeal.
- Both Roof inspection and repair — Ensures structural integrity and property value.
Renovation cost estimate screening
| Repair item | Severity | Est. cost |
|---|---|---|
| Exterior siding · Weathered and in need of repair. | Major | $15,000–50,000 |
| Carpeted flooring · Worn and dirty, needs replacement. | Major | $15,000–50,000 |
| Interior walls/paint · Chipped and dirty, needs repainting. | Major | $15,000–50,000 |
| Kitchen and bath fixtures · No visible fixtures, likely in need of replacement. | Major | $15,000–50,000 |
| Roof · No visible roof condition, likely in need of inspection and repair. | Major | $15,000–50,000 |
| Total estimated repair cost · 5 items | $75,000–250,000 |
Value-add ROI direction
- Both Exterior siding repair — Improves curb appeal and property value. ↑
- Both Carpet replacement — Fresh carpet enhances interior appeal and comfort. ↑
- Both Interior painting — Fresh paint improves aesthetics and property value. ↑
- Both Kitchen and bath fixture replacement — Modern fixtures improve functionality and appeal. ↑
- Both Roof inspection and repair — Ensures structural integrity and property value. ↑
ⓘ Cost ranges are severity-bucket heuristics (US national rule-of-thumb). Get contractor quotes + a written scope before underwriting a rehab budget.
Schools (NCES district)
- District
- Bay
- NCES district ID
- 1200090
- Math proficiency
- 51% ▼ -8.00%
- Reading proficiency
- 51% ▼ -7.00%
- Median HH income
- $47,740
- Composite
- 43.41/100
- National rank
- #3014
- State rank
- #29 of 73 in FL
Livability — Callaway
- Score
- 64/100
- State rank
- #690
- US rank
- #14384
Category grades
Schools grade is shown separately in the Schools card above.
Census & demographics
- Census place
- Callaway, FL
- County
- Bay County · 163,593 people
- Metro
- Panama City, FL
- Population (ZIP)
- 42,514
- Household income
- $74,708
- Rent vs Own
- Severe rent burden
- 1218.0
Population outlook (Bay County) Hauer SSP2
- Today (2025)
- 206,264 people
- By 2030
- 217,740 · +5.6%
- By 2040
- 238,738 · +15.7%
- By 2050
- 255,545 · +23.9%
- By 2075
- 288,295 · +39.8%
- By 2100
- 288,638 · +39.9%
Race, ethnicity, and origin ACS 2023
- Neighborhood character
- Predominantly White (69%)
- Race & ethnicity
- White 69% Black 12% Two or more races 10% Hispanic / Latino 9% Asian 3%
- Hispanic origin (detail)
- Mexican 2% Puerto Rican 3%
- Common ancestry
- Lithuanian 3% Slovak 2% Italian 2%
- Foreign-born
- 7% · Canada, Vietnam, Mexico
- Languages at home
- 90% English-only · Spanish 6% Vietnamese 1% Other Asian/Pacific 1%
Political lean MEDSL · Bay
- 2024 margin
- Solid R (+47.4) · D 25.8% · R 73.1% · Other 1.1%
- 2008→2024 swing
- -6.6pp toward R · 2008: -40.7pp · 2024: -47.4pp
- All cycles
- 2024: R+47.4 2020: R+43.5 2016: R+46.3 2012: R+43.6 2008: R+40.7
Not yet ingested
- Civics
- —
Market trends
- HPI YoY
- ▼ -50.59%
- Current HPI
- 263.7178
- Rent YoY
- ▲ 1.12%
- Metro
- Panama City, FL
- State GDP YoY
- ▲ 3.28%
- F500 in state
- 36
Industry mix (Fortune 500 HQ in FL)
| Industry | F500 HQs | Revenue |
|---|---|---|
| Industrial Technology | 2 | $29B |
|
||
| Insurance | 2 | $17B |
|
||
| Retail | 1 | $60B |
|
||
| Technology Distribution | 1 | $58B |
|
||
| Homebuilding | 1 | $35B |
|
||
| Technology Manufacturing | 1 | $35B |
|
||
Price history
-4.1% since first listed3 events — show timeline
- 2026-06-17 Pending — CPARMLS
- 2026-06-05 Price Changed $119,900 CPARMLS
- 2026-05-07 Listed $125,000 CPARMLS
Cash-flow waterfall
monthlySold comps — $/sqft
last 12 mo · ≤1 miLoading sold comps…