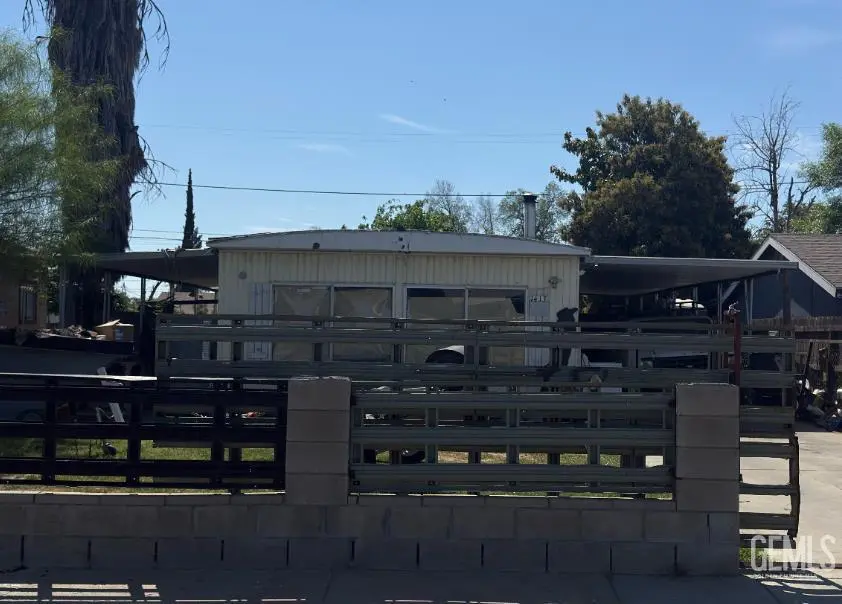
1413 N Gorrill St · Bakersfield, CA
Flood risk 1/10 · Minimal
- FEMA flood zone
- X (unshaded)
- Chance of flooding over 30 yrs
- 0.0%
- Est. flood insurance / yr
- $507 – $1,088
Fire risk 5/10 · Moderate
- Est. fire insurance / yr
- $659 – $1,223
Heat risk 8/10 · Major
- Hot days now (above 105°F)
- 7 days/yr
- Hot days in 30 yrs
- 19 days/yr
Wind risk 1/10 · Minimal
- Chance of severe wind over 30 yrs
- —
Air-quality risk 10/10 · Severe
- Unhealthy air days now
- 39 days/yr
- Unhealthy air days in 30 yrs
- 45 days/yr
Risk factors via First Street. Map © Google.
Why this score? — see what drove the C+ grade
The composite is a weighted blend of 9 inputs, each scored 0–100. Each bar is that input's sub-score; the figure is the points it added to the 100-point composite (weight × sub-score).
- Cash flow +21.4/30.0
- ARV discount +15.0/15.0
- DSCR +6.8/10.0
- 1% rule +4.8/10.0
- Rent growth +3.9/5.0
- Schools +3.4/10.0
- Livability +2.9/5.0
- Condition / age +2.5/5.0
- Appreciation +0.0/10.0
$160,000
🖨 Deal sheet (PDF) 📄 Offer letter ✓ Due diligence
Listing remarks MLS
A Mobile Home on a permanent foundation ready for a new owner or investor
Key facts
- Permanent foundation
- 6,534 sq ft lot
- Built 1969
Tags
Neighborhood map
What this means for you Summary
Snapshot
- This is a 3-bed/2.0-bath manufactured listed at $160k.
Deal economics
- At list price, monthly cash flow is $237 ($3k/yr) — positive.
- The deal already cash-flows at list — no discount required.
- To meet the 1% rule (rent ≥ 1% of price), the offer needs to be $157k (2.0% below list).
- Recommended offer: $150k (6.0% below list) — sets the bar for market timing.
- Cap rate 8.1% vs local median 3.6% in Bakersfield — top-decile yield for the area; either an underpriced asset or a hidden risk that comps aren't pricing in. Stress-test before assuming the spread holds.
Location & tenants
- Location reads 58/100 on livability (#716 in CA) — a working-class tenant base; expect higher turnover. Strengths: housing A+; Watch: health & safety D, crime F, amenities F.
- Kern High (urban): math 21% / reading 51% proficiency, ranked #860 of 1,400 in CA (top 61%) — families likely to look elsewhere, expect single-tenant / working-renter base with shorter leases.
- Zoned schools: Bessie E. Owens Elementary (889 students, 92% FRL); Abraham Lincoln Jr. High (620 students, 92% FRL); Bakersfield High (math 17% / reading 90%, grade C-, #281 of 1,170 statewide, top 24%, 3,004 students, 82% FRL).
- Zoned-school proficiency averages 54% at this address vs 36% district-wide (+18 pts) — the actual schools serving this property are materially stronger than the Kern High average implies; a family-tenant draw the district grade alone would hide.
- Market conditions: Rents rising fast (+5.7%/yr); 314 active listings in the ZIP; 29 comparable units currently listed for rent nearby; rentals leasing fast (median 4d on market — plan ~1-2 weeks tenant-placement turnaround); 3,244 units permitted in Kern County in 2024 (73 in 5+ unit buildings).
- This rent runs 33% of the median local income ($56k/yr) — at the standard rent-burdened threshold; future hikes will face affordability resistance.
Forward outlook
- Local home prices are declining (-3.0%/yr); year-one equity from $1k of loan paydown is wiped out by about $5k of value loss. Plan a longer hold.
- Kern County population projected at +17% by 2050 — long-run rental-demand tailwind backs the buy-and-hold thesis.
Negotiation context
- It's been on market 80 days — a 6% lower offer ($150k) is reasonable based on typical stale-listing flexibility.
- 2 sale attempts since 12y ago; this cycle's ask has dropped $10k (6%) from the opening price — seller is motivated, your offer sets the floor, not the list.
- Current owner paid $25k; list at $160k implies a 540% gain — meaningful room to come down on a strong offer.
Risks & watch-outs
- Climate carrying-cost: moderate wildfire risk; extreme-heat days projected 7→19/yr by 2055 (HVAC capex compounding) — expect insurance premiums to compound above CPI over the hold.
Questions for the listing agent
- It's been on market 80 days. Have you received any prior offers? Is the seller open to a 6% concession, seller financing, or rate buy-down credit?
- Built in 1969 — when were the roof, HVAC, electrical panel, plumbing, and water heater last replaced?
- Why hasn't it sold? Are there any deal-killer items the seller is aware of (foundation, flood, title, zoning, code violations)?
- Is there a deadline driving the sale (1031 exchange, divorce, estate, relocation)? That informs how much negotiation room exists.
- Schools are D-rated, which usually means shorter tenancies and higher turnover. Who's the typical renter profile here, and what's been the actual vacancy rate?
- Crime grade is F in this area — have there been break-ins, vandalism, or insurance claims at this property in the last 3 years? What carrier currently insures it and at what premium?
- What's the average days-on-market for RENTAL listings here right now (not sales)? A rising rental-DOM trend means longer vacancies and softer asking-rent achievability than the comps imply.
- What's the recent tenant-quality profile in this submarket — average credit score on applications, eviction rate, late-payment / NSF rate, and stable-employment percentage? A property-management company in the area should have these aggregated.
- How much new for-sale + rental construction is in the pipeline within 1–3 miles? Heavy new supply typically softens prices + rents 12–24 months out; constrained supply supports both.
Investment metrics
- 1% rule
- 0.98% ✗
- Cap rate
- 8.07%
- Cash-on-cash
- 6.34%
- DSCR
- 1.28
- GRM
- 8.5
CMA / ARV
- ARV (median comp)
- $231,913
- List price
- $160,000
- Delta
- -31.01%
- Verdict
- UNDERPRICED
- Comps
- 20 within 1.0 mi
Projected returns pro-forma
-3.0% appreciation · 5.71% rent growth · sell at horizon
- IRR
- -3.8%
- Equity multiple
- 0.85×
- Total profit
- $-6,499
- Equity at exit
- $23,857
- IRR
- 8.6%
- Equity multiple
- 1.73×
- Total profit
- $32,641
- Equity at exit
- $13,834
Cash invested: $44,800 (down + closing). Projections, not guarantees.
Landlord ↔ Tenant lean methodology
- Overall (STATE)
- 18 Strongly Tenant-Friendly
- State California
- 18 Strongly Tenant-Friendly · D+13
- County
- — inherits STATE
- City
- — inherits STATE
ZIP-level market 93307
- Rents YoY
- 5.7%
- Active inventory
- 314
- Price-to-rent
- 8.5×
Monthly cashflow live
- Estimated rent
- $1,568 high interval (Pro) →
- Mortgage (P&I)
- −$839
- Tax from tax record
- −$96 /mo · $1,154/yr
- Insurance
- −$67
- HOA
- −$0
- Vacancy / Maint / Mgmt
- −$329
- Net cashflow
- $237
Break-even live
Sensitivity live
| Price | -10% $327 | -5% $282 | +0% $237 | +5% $191 | +10% $146 |
|---|---|---|---|---|---|
| Rent | -10% $113 | -5% $175 | +0% $237 | +5% $299 | +10% $361 |
| Rate | -1.0pp $317 | -0.5pp $277 | base $237 | +0.5pp $195 | +1.0pp $153 |
UW: 25.0% down · 7.5% · 30yr · 1.5% tax · 5.0% vac · 8.0% maint · 8.0% mgmt
Financing live
Cash to close
- Down payment
- $40,000
- Closing costs
- $4,800
- Reserves months
- —
- Total cash needed
- —
Loan-product check · same deal, 3 products live
Conventional
25% down · 7.5% · 30yr
- Down + closing
- —
- Monthly P&I
- —
- Monthly cashflow
- —
- DSCR
- —
- Eligible?
- —
Personal DTI + credit; lowest rate.
DSCR
20% down · 8.5% · 30yr
- Down + closing
- —
- Monthly P&I
- —
- Monthly cashflow
- —
- DSCR
- —
- Eligible?
- —
No personal income docs; deal must DSCR.
Hard money
10% down · 12.0% · 12mo
- Down + closing
- —
- Monthly P&I
- —
- Monthly cashflow
- —
- DSCR
- —
- Eligible?
- —
Short-term bridge; refi at stabilization.
Rent comps 29 comps
| Address | Beds | Baths | Sqft | Rent | $/sqft | DOM | Units | Dist |
|---|---|---|---|---|---|---|---|---|
| 1517 Ralston St Unit 1517-A Bakersfield, CA | 3.0 | 2.0 | 960 | $1,295 | $1.35 | 4d | 1 | 0.11mi |
| 345 Doctor Martin Luther King Junior Blvd Apt A Bakersfield, CA | 2.0 | 1.0 | 750 | $1,050 | $1.40 | 4d | 1 | 0.25mi |
| 1230 Dolores St Unit A Bakersfield, CA | 2.0 | 1.0 | 927 | $1,250 | $1.35 | 4d | 1 | 0.40mi |
| 136 Clifton St Bakersfield, CA | 3.0 | 1.0 | 1308 | $1,775 | $1.36 | 4d | 1 | 0.47mi |
| 743 Monticello Ave Bakersfield, CA | 3.0 | 1.0 | 954 | $1,600 | $1.68 | 5d | 1 | 0.49mi |
| 720 Beverly Dr Bakersfield, CA | 3.0 | 2.0 | 900 | $1,650 | $1.83 | 45d | 1 | 0.68mi |
| 6 S Owens St Bakersfield, CA | 3.0 | 2.0 | 1088 | $1,950 | $1.79 | 45d | 1 | 0.71mi |
| 2010 Larcus Ave Unit 13 Bakersfield, CA | 2.0 | 1.5 | 800 | $1,200 | $1.50 | 4d | 1 | 0.85mi |
| 1004 Padre St Unit B Bakersfield, CA | 3.0 | 2.0 | 1200 | $1,695 | $1.41 | 12d | 1 | 0.87mi |
| 2010 Larcus Ave Bakersfield, CA | 2.0 | 1.5 | 800 | $1,400 | $1.75 | 23d | 1 | 0.87mi |
| 2010 Larcus Ave Bakersfield, CA | 2.0 | 1.5 | 800 | $1,300 | $1.62 | 5d | 3 | 0.87mi |
| 2010 Larcus Ave Unit 48 Bakersfield, CA | 2.0 | 1.5 | 1000 | $1,200 | $1.20 | 12d | 1 | 0.87mi |
| 2010 Larcus Ave Unit 33 Bakersfield, CA | 2.0 | 1.5 | 800 | $1,200 | $1.50 | 45d | 1 | 0.88mi |
| 820 Moore St Bakersfield, CA | 3.0 | 1.0 | 1084 | $1,600 | $1.48 | 20d | 1 | 0.99mi |
| 309 Lloyd St Bakersfield, CA | 2.0 | 1.0 | 798 | $1,595 | $2.00 | 4d | 1 | 1.02mi |
| 931 Monterey St Apt B Bakersfield, CA | 4.0 | 2.0 | 1320 | $1,650 | $1.25 | 4d | 1 | 1.08mi |
| 310 Ohio Dr Unit B Bakersfield, CA | 3.0 | 2.0 | 1100 | $2,000 | $1.82 | 12d | 1 | 1.09mi |
| 918 Monterey St Unit 918 Bakersfield, CA | 2.0 | 1.0 | 800 | $1,395 | $1.74 | 45d | 1 | 1.12mi |
| 419 8th St Bakersfield, CA | 3.0 | 2.0 | 916 | $2,200 | $2.40 | 4d | 1 | 1.12mi |
| 2006 Kentucky St Apt 48 Bakersfield, CA | 2.0 | 1.0 | 835 | $1,150 | $1.38 | 45d | 1 | 1.14mi |
| 2006 Kentucky St Apt 8 Bakersfield, CA | 2.0 | 1.0 | 835 | $1,150 | $1.38 | 4d | 1 | 1.14mi |
| 1417 Oregon St Unit B Bakersfield, CA | 2.0 | 1.0 | 744 | $1,475 | $1.98 | 4d | 1 | 1.19mi |
| 1405 Pacific St Apt E Bakersfield, CA | 2.0 | 1.5 | 850 | $995 | $1.17 | 45d | 1 | 1.26mi |
| 1813 Oregon St Unit 1815-3 Bakersfield, CA | 2.0 | 1.0 | 700 | $1,050 | $1.50 | 4d | 1 | 1.27mi |
| 1710 Oregon St Apt E Bakersfield, CA | 2.0 | 1.0 | 960 | $1,095 | $1.14 | 4d | 1 | 1.28mi |
| 2190 Monterey St Unit 9 Bakersfield, CA | 2.0 | 1.0 | 700 | $1,050 | $1.50 | 12d | 1 | 1.35mi |
| 2300 Lake St Unit C Bakersfield, CA | 3.0 | 1.0 | 1105 | $1,650 | $1.49 | 4d | 1 | 1.36mi |
| 1518 Palm Dr Bakersfield, CA | 2.0 | 1.0 | 715 | $1,100 | $1.54 | 4d | 1 | 1.44mi |
| 2124 Pacific St Bakersfield, CA | 2.0 | 1.0 | 823 | $1,395 | $1.70 | 4d | 1 | 1.49mi |
Listing history 24 events
-
2026-06-22days on market $160,000 Active 80 DOM
-
2026-06-18days on market $160,000 Active 77 DOM
-
2026-06-17days on market $160,000 Active 76 DOM
-
2026-06-16days on market $160,000 Active 75 DOM
-
2026-06-15days on market $160,000 Active 74 DOM
-
2026-06-14days on market $160,000 Active 72 DOM
-
2026-06-10pricedays on market $160,000 Active 69 DOM
-
2026-06-09days on market $170,000 Active 68 DOM
-
2026-06-08days on market $170,000 Active 67 DOM
-
2026-06-07days on market $170,000 Active 66 DOM
-
2026-06-05days on market $170,000 Active 63 DOM
-
2026-06-03days on market $170,000 Active 62 DOM
-
2026-06-03days on market $170,000 Active 61 DOM
-
2026-06-01days on market $170,000 Active 60 DOM
-
2026-05-31days on market $170,000 Active 59 DOM
-
2026-04-02$170,000 Active 73-char remark
Show marketing remark (73 chars)
A Mobile Home on a permanent foundation ready for a new owner or investor
-
2017-09-11price $75,000
-
2017-08-07price $61,999
-
2014-12-09soldstatus $25,000
-
2014-12-02soldstatus $25,000
-
2014-09-12price $39,000
-
2014-09-12historical
-
2014-04-21$25,000
-
1997-02-04soldstatus $11,000
ⓘ Source: listings_history table (triggers on properties + properties_extension) + one-shot
backfill from property_details.listing_events for pre-trigger history.
Tax reassessment forecast CA · Resets to sale price
- Current annual tax
- $1,154 · $96/mo
- Projected year-2 tax
- $1,216 · $101/mo
- Expected delta
- +$62/yr (+$5/mo · 5.4%)
ⓘ Screening estimate from a state-policy table — verify with the county assessor before closing.
Climate risk First Street
- Flood 1/10 Low FEMA zone X (unshaded) · 0% chance over 30 yrs
- Wildfire 5/10 Major
- Heat 8/10 Severe 7 d/yr ≥105°F today · 19 d/yr by 30 yrs out
- Wind 1/10 Low
- Air quality 10/10 Extreme 39 unhealthy d/yr today · 45 by 30 yrs out
Nearby sold comps map
Loading sold comps map…
Walkable amenities ~0.75 mi
Loading nearby amenities…
Taxation est. · year 1
- Rental income
- $18,814
- − Mortgage interest
- −$8,962
- − Property taxes
- −$1,154
- − Insurance
- −$800
- − Repairs & maintenance
- −$1,505
- − Management
- −$1,505
- − Depreciation
- −$4,655
- Taxable income
- $233
- Est. tax owed @ 24.0%
- −$56
- After-tax cash flow
- $2,785/yr
For passive investors: Depreciation is non-cash, so a rental often shows a tax loss while cash-flowing — sheltering income. Rental losses are passive: they offset passive income freely, and up to $25,000/yr can offset ordinary (W-2) income if you actively participate and your MAGI is under $100k (phasing out to $0 by $150k); unused losses carry forward. On sale, claimed depreciation is recaptured at up to 25%, and gains may owe capital-gains tax (a 1031 exchange can defer both). Figures are a year-1 estimate at your 24.0% rate — not tax advice; consult a CPA.
Schools (NCES district)
- District
- Kern High
- NCES district ID
- 0619540
- Math proficiency
- 21% ▬ 0.00%
- Reading proficiency
- 51% ▲ 2.00%
- Median HH income
- $49,686
- Composite
- 33.68/100
- National rank
- #10443
- State rank
- #860 of 1400 in CA
Livability — Bakersfield
- Score
- 58/100
- State rank
- #716
- US rank
- #21355
Category grades
Schools grade is shown separately in the Schools card above.
Census & demographics
- Census place
- Bakersfield, CA
- County
- Kern County · 710,371 people
- City population
- 499,124
- Metro
- Bakersfield, CA
- Population (ZIP)
- 85,945
- Household income
- $56,446
- Rent vs Own
- Severe rent burden
- 3246.0
Population outlook (Kern County) Hauer SSP2
- Today (2025)
- 947,286 people
- By 2030
- 978,984 · +3.3%
- By 2040
- 1,045,018 · +10.3%
- By 2050
- 1,105,232 · +16.7%
- By 2075
- 1,229,538 · +29.8%
- By 2100
- 1,238,059 · +30.7%
Race, ethnicity, and origin ACS 2023
- Neighborhood character
- Predominantly Hispanic (80%)
- Race & ethnicity
- Hispanic / Latino 80% Two or more races 12% White 10% Black 6% Asian 3% Native American 1%
- Hispanic origin (detail)
- Mexican 73%
- Common ancestry
- Lithuanian 0%
- Foreign-born
- 31% · Canada
- Languages at home
- 28% English-only · Spanish 69% Other Indo-European 1% Arabic 1%
Political lean MEDSL · Kern
- 2024 margin
- Strong R (+21.1) · D 38.2% · R 59.3% · Other 2.5%
- 2008→2024 swing
- -3.3pp toward R · 2008: -17.8pp · 2024: -21.1pp
- All cycles
- 2024: R+21.1 2020: R+10.2 2016: R+15.0 2012: R+20.9 2008: R+17.8
Not yet ingested
- Civics
- —
Market trends
- HPI YoY
- ▼ -263.59%
- Current HPI
- 447.1746
- Rent YoY
- ▲ 5.71%
- Metro
- Bakersfield, CA
- State GDP YoY
- ▲ 3.21%
- F500 in state
- 116
Industry mix (Fortune 500 HQ in CA)
| Industry | F500 HQs | Revenue |
|---|---|---|
| Technology | 27 | $1,492B |
|
||
| Financial Services | 3 | $174B |
|
||
| Retail | 3 | $44B |
|
||
| Insurance | 3 | $26B |
|
||
| Media / Entertainment | 2 | $115B |
|
||
| Pharmaceuticals / Biotech | 2 | $62B |
|
||
Price history
+1445.5% since first listed9 events — show timeline
- 2026-04-02 Listed $170,000 GEMLS
- 2017-09-11 Price Changed $75,000 GEMLS
- 2017-08-07 Price Changed $61,999 GEMLS
- 2014-12-09 Sold (MLS) $25,000 GEMLS
- 2014-12-02 Sold (Public Records) $25,000 Public Records
- 2014-09-12 Delisted — GEMLS
- 2014-09-12 Price Changed $39,000 GEMLS
- 2014-04-21 Listed $25,000 GEMLS
- 1997-02-04 Sold (Public Records) $11,000 Public Records
Property tax history
+1.5%/yrLatest (2025): $1,154 · +2.4% YoY. Source: county tax records.
Cash-flow waterfall
monthlySold comps — $/sqft
last 12 mo · ≤1 miLoading sold comps…