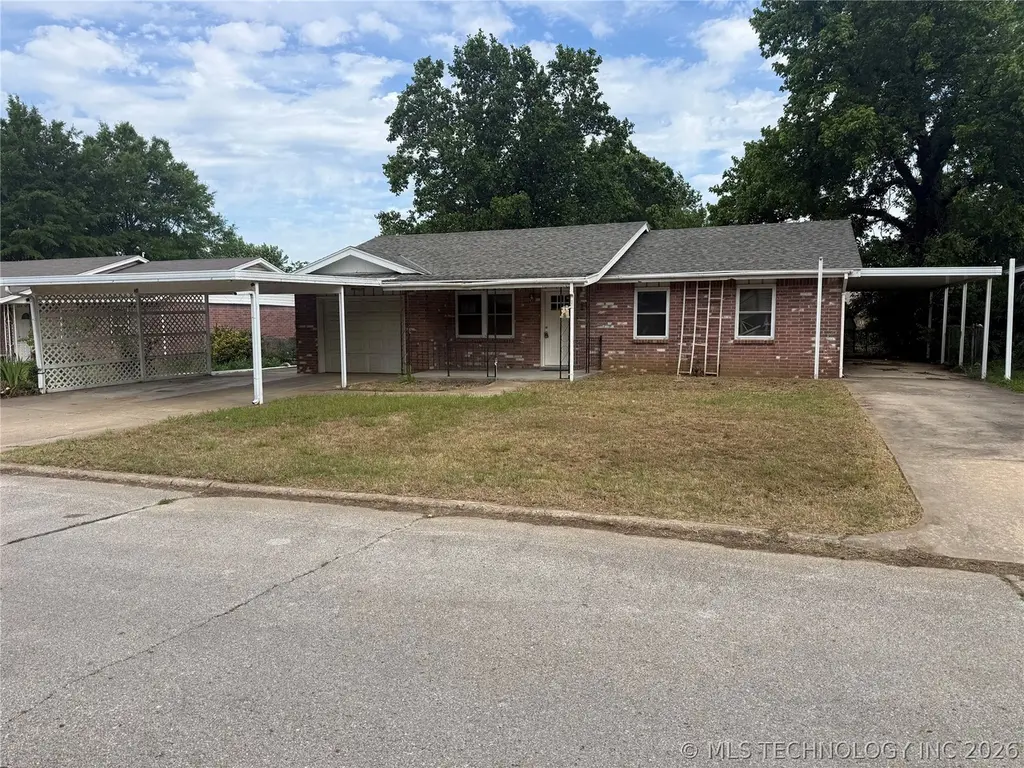
251 E 137th St · Glenpool, OK
Flood risk 1/10 · Minimal
- FEMA flood zone
- X (unshaded)
- Chance of flooding over 30 yrs
- 0.0%
- Est. flood insurance / yr
- $473 – $860
Fire risk 7/10 · Major
- Est. fire insurance / yr
- $2,463 – $4,575
Heat risk 6/10 · Moderate
- Hot days now (above 110°F)
- 7 days/yr
- Hot days in 30 yrs
- 18 days/yr
Wind risk 3/10 · Minor
- Chance of severe wind over 30 yrs
- 4.0%
Air-quality risk 2/10 · Minimal
- Unhealthy air days now
- 1 days/yr
- Unhealthy air days in 30 yrs
- 1 days/yr
Risk factors via First Street. Map © Google.
Why this score? — see what drove the C+ grade
The composite is a weighted blend of 9 inputs, each scored 0–100. Each bar is that input's sub-score; the figure is the points it added to the 100-point composite (weight × sub-score).
- Cash flow +23.3/30.0
- ARV discount +15.0/15.0
- DSCR +7.5/10.0
- 1% rule +5.1/10.0
- Livability +3.5/5.0
- Rent growth +2.5/5.0
- Condition / age +2.5/5.0
- Schools +2.4/10.0
- Appreciation +0.0/10.0
$149,900
🖨 Deal sheet (PDF) 📄 Offer letter ✓ Due diligence
Listing remarks
Glenpool hidden diamond with instant equity potential! Oversized yard and shed, new doors, 2 carports to store the boat and cars! NO HOA Roof Estimated 6 years old and in great shape! A little love and updates will go far! Only owner occupant buyers are eligible for first 30 days of listing through First Look Program. Sold AS-IS where is
Key facts
- 7,800 sq ft lot
- Garage
- Built 1978
Property features AI
Finance
- HOA & community: Sidewalks in the community
Exterior
- Parking: Attached garage with 1 garage space; Carport; Boat and RV access/parking; Workshop area in garage
- Security: Security system owned; No safety shelter
- Utilities: Public water; Public sewer
- Home design: Single-story home; Handicap accessible; Faces south; Slab foundation
- Construction: Brick and wood frame construction; Asphalt/fiberglass roof; Year built per public records
- Exterior features: Covered porch; Patio; Satellite dish; Shed(s) / storage; Chain link fencing; Mature trees
Interior
- Kitchen: Eat-in kitchen; Oven; Range; Dishwasher
- Bedrooms: Master bedroom with walk-in closet (first level)
- Flooring: Carpet; Vinyl
- Bathrooms: One full bathroom; One half bathroom; Master bath (first level)
- Heating & cooling: Central heating (gas); Central air conditioning
- Interior features: Ceiling fans; Insulated windows with aluminum frames; Insulated doors; Security system owned; Smoke detectors
- Laundry & utility: Utility room located inside (first level); Gas water heater
Neighborhood map
What this means for you Summary
Snapshot
- This is a 3-bed/1.5-bath single-family listed at $150k.
Deal economics
- At list price, monthly cash flow is $274 ($3k/yr) — positive.
- The deal already cash-flows at list — no discount required.
- Meets the 1% rule at list price ($2k rent vs $150k).
- Cap rate 8.5% vs local median 3.8% in Glenpool — top-decile yield for the area; either an underpriced asset or a hidden risk that comps aren't pricing in. Stress-test before assuming the spread holds.
Location & tenants
- Location reads 70/100 on livability (#39 in OK) — a middle-class / working-renter tenant base. Strengths: cost of living A+, housing A+, crime A; Watch: schools D+, amenities F, commute F.
- Glenpool (suburban): math 25% / reading 27% proficiency, ranked #78 of 270 in OK (top 29%) — low school quality limits family demand, transient renter base, plan for 1-2y turnover.
- Market conditions: 162 active listings in the ZIP; 3 comparable units currently listed for rent nearby; rentals leasing fast (median 3d on market — plan ~1-2 weeks tenant-placement turnaround); solid renter incomes; 2,818 units permitted in Tulsa County in 2024 (518 in 5+ unit buildings).
Forward outlook
- Local home prices are declining (-3.0%/yr); year-one equity from $1k of loan paydown is wiped out by about $4k of value loss. Plan a longer hold.
- Tulsa County population projected at +30% by 2050 — long-run rental-demand tailwind backs the buy-and-hold thesis.
Negotiation context
- Only 9 days on market — expect competitive offers; lowballing is unlikely to land.
- 4 sale attempts since 35y ago with the ask held roughly flat each time — persistent listings suggest the price (not the market) is what's stuck; bring a comps-based counter.
- Current owner paid $46k; list at $150k implies a 226% gain — meaningful room to come down on a strong offer.
Risks & watch-outs
- Climate carrying-cost: major wildfire risk; extreme-heat days projected 7→18/yr by 2055 (HVAC capex compounding) — expect insurance premiums to compound above CPI over the hold.
Questions for the listing agent
- Built in 1978 — when were the roof, HVAC, electrical panel, plumbing, and water heater last replaced?
- Is there a deadline driving the sale (1031 exchange, divorce, estate, relocation)? That informs how much negotiation room exists.
- Schools are D-rated, which usually means shorter tenancies and higher turnover. Who's the typical renter profile here, and what's been the actual vacancy rate?
- What's the average days-on-market for RENTAL listings here right now (not sales)? A rising rental-DOM trend means longer vacancies and softer asking-rent achievability than the comps imply.
- What's the recent tenant-quality profile in this submarket — average credit score on applications, eviction rate, late-payment / NSF rate, and stable-employment percentage? A property-management company in the area should have these aggregated.
- How much new for-sale + rental construction is in the pipeline within 1–3 miles? Heavy new supply typically softens prices + rents 12–24 months out; constrained supply supports both.
Investment metrics
- 1% rule
- 1.01% ✓
- Cap rate
- 8.49%
- Cash-on-cash
- 7.84%
- DSCR
- 1.35
- GRM
- 8.3
CMA / ARV
- ARV (on-the-fly)
- $186,438
- Comps found
- 12
Show comp detail 12 sales within ~0.75 mi
| Address | Dist | Beds/Ba | Sqft | Sold | Price | $/sf | Match |
|---|---|---|---|---|---|---|---|
| 306 E 136th Pl | 0.06mi | 3/1.5 | 1,143 (-1%) | 8mo | $192,000 | $168 | 89 |
| 475 E 138th Pl | 0.17mi | 3/1.5 | 1,158 (0%) | 6mo | $175,200 | $151 | 88 |
| 578 E 138th Pl | 0.29mi | 3/1.5 | 1,139 (-2%) | 0mo | $219,000 | $192 | 84 |
| 13804 S Glen Pl | 0.30mi | 3/1.5 | 1,188 (+3%) | 0mo | $182,000 | $153 | 81 |
| 401 E 137th St | 0.11mi | 2/1.5 (-1) | 1,098 (-5%) | 8mo | $141,000 | $128 | 74 |
| 13940 S Dogwood St | 0.28mi | 3/1.0 | 1,050 (-9%) | 1mo | $190,000 | $181 | 69 |
| 462 E 136th Pl | 0.17mi | 3/2.0 | 1,285 (+11%) | 8mo | $200,000 | $156 | 65 |
| 14324 S Dogwood St | 0.52mi | 4/1.5 (+1) | 1,186 (+2%) | 7mo | $175,000 | $148 | 61 |
| 590 E 134th Pl | 0.36mi | 3/1.0 | 1,028 (-11%) | 6mo | $182,000 | $177 | 57 |
| 501 E 141st Pl | 0.54mi | 3/2.0 | 1,284 (+11%) | 4mo | $120,000 | $93 | 52 |
| 660 E 143rd St | 0.72mi | 2/1.0 (-1) | 1,084 (-6%) | 7mo | $175,000 | $161 | 43 |
| 13760 S Maple St | 0.71mi | 3/2.0 | 1,312 (+13%) | 8mo | $225,000 | $171 | 36 |
Match score weights: distance 35% · size 25% · config 20% · recency 20%. Top-matched comps best support the ARV.
Projected returns pro-forma
-3.0% appreciation · 3.0% rent growth · sell at horizon
- IRR
- -4.4%
- Equity multiple
- 0.84×
- Total profit
- $-6,874
- Equity at exit
- $22,351
- IRR
- 5.3%
- Equity multiple
- 1.39×
- Total profit
- $16,306
- Equity at exit
- $12,961
Cash invested: $41,972 (down + closing). Projections, not guarantees.
Landlord ↔ Tenant lean methodology
- Overall (STATE)
- 83 Strongly Landlord-Friendly
- State Oklahoma
- 83 Strongly Landlord-Friendly · R+20
- County
- — inherits STATE
- City
- — inherits STATE
ZIP-level market 74033
- Home prices YoY
- -18.8%
- Active inventory
- 162
- Price-to-rent
- 8.3×
Monthly cashflow live
- Estimated rent
- $1,512 medium interval (Pro) →
- Mortgage (P&I)
- −$786
- Tax from tax record
- −$72 /mo · $864/yr
- Insurance
- −$62
- HOA
- −$0
- Vacancy / Maint / Mgmt
- −$318
- Net cashflow
- $274
Break-even live
Sensitivity live
| Price | -10% $359 | -5% $317 | +0% $274 | +5% $232 | +10% $189 |
|---|---|---|---|---|---|
| Rent | -10% $155 | -5% $214 | +0% $274 | +5% $334 | +10% $394 |
| Rate | -1.0pp $350 | -0.5pp $312 | base $274 | +0.5pp $235 | +1.0pp $196 |
UW: 25.0% down · 7.5% · 30yr · 1.5% tax · 5.0% vac · 8.0% maint · 8.0% mgmt
Financing live
Cash to close
- Down payment
- $37,475
- Closing costs
- $4,497
- Reserves months
- —
- Total cash needed
- —
Loan-product check · same deal, 3 products live
Conventional
25% down · 7.5% · 30yr
- Down + closing
- —
- Monthly P&I
- —
- Monthly cashflow
- —
- DSCR
- —
- Eligible?
- —
Personal DTI + credit; lowest rate.
DSCR
20% down · 8.5% · 30yr
- Down + closing
- —
- Monthly P&I
- —
- Monthly cashflow
- —
- DSCR
- —
- Eligible?
- —
No personal income docs; deal must DSCR.
Hard money
10% down · 12.0% · 12mo
- Down + closing
- —
- Monthly P&I
- —
- Monthly cashflow
- —
- DSCR
- —
- Eligible?
- —
Short-term bridge; refi at stabilization.
Rent comps 3 comps
| Address | Beds | Baths | Sqft | Rent | $/sqft | DOM | Units | Dist |
|---|---|---|---|---|---|---|---|---|
| 13743 S Fern St Glenpool, OK | 3.0 | 1.5 | 1139 | $1,450 | $1.27 | 11d | 1 | 0.21mi |
| 13486 S Fern St Glenpool, OK | 3.0 | 1.0 | 976 | $1,245 | $1.28 | 2d | 1 | 0.32mi |
| 14900 S Birch St Glenpool, OK | 1.0–2.0 | 1.0 | 842 | $875 | $1.04 | 2d | 1 | 1.04mi |
Listing history 15 events
-
2026-06-18status $149,900 Active 9 DOM
-
2026-06-10status $149,900 Pending 9 DOM
-
2026-06-09days on market $149,900 Active 9 DOM
-
2026-06-08days on market $149,900 Active 8 DOM
-
2026-06-07remarks 340-char remark
-
2026-06-07statusdays on market $149,900 Active 7 DOM
-
2026-05-11status Pending
-
2026-05-06$149,900 Active
-
2007-02-18historical
-
2006-08-18$90,000
-
2006-05-24historical
-
2006-02-18$90,000
-
1993-08-30soldstatus $46,000
-
1992-01-01soldstatus $34,000
-
1991-10-11$34,000
ⓘ Source: listings_history table (triggers on properties + properties_extension) + one-shot
backfill from property_details.listing_events for pre-trigger history.
Tax reassessment forecast OK · Resets to sale price
- Current annual tax
- $864 · $72/mo
- Projected year-2 tax
- $1,349 · $112/mo
- Expected delta
- +$485/yr (+$40/mo · 56.1%)
ⓘ Screening estimate from a state-policy table — verify with the county assessor before closing.
Climate risk First Street
- Flood 1/10 Low FEMA zone X (unshaded) · 0% chance over 30 yrs
- Wildfire 7/10 Severe
- Heat 6/10 Major 7 d/yr ≥110°F today · 18 d/yr by 30 yrs out
- Wind 3/10 Moderate 4% chance of damaging wind over 30 yrs
- Air quality 2/10 Low 1 unhealthy d/yr today · 1 by 30 yrs out
Nearby sold comps map
Loading sold comps map…
Walkable amenities ~0.75 mi
Loading nearby amenities…
Taxation est. · year 1
- Rental income
- $18,148
- − Mortgage interest
- −$8,397
- − Property taxes
- −$864
- − Insurance
- −$750
- − Repairs & maintenance
- −$1,452
- − Management
- −$1,452
- − Depreciation
- −$4,361
- Taxable income
- $873
- Est. tax owed @ 24.0%
- −$210
- After-tax cash flow
- $3,081/yr
For passive investors: Depreciation is non-cash, so a rental often shows a tax loss while cash-flowing — sheltering income. Rental losses are passive: they offset passive income freely, and up to $25,000/yr can offset ordinary (W-2) income if you actively participate and your MAGI is under $100k (phasing out to $0 by $150k); unused losses carry forward. On sale, claimed depreciation is recaptured at up to 25%, and gains may owe capital-gains tax (a 1031 exchange can defer both). Figures are a year-1 estimate at your 24.0% rate — not tax advice; consult a CPA.
Schools (NCES district)
- District
- Glenpool
- NCES district ID
- 4012720
- Math proficiency
- 25% ▼ -10.00%
- Reading proficiency
- 27% ▼ -6.00%
- Median HH income
- $60,823
- Composite
- 23.92/100
- National rank
- #7789
- State rank
- #78 of 270 in OK
Livability — Glenpool
- Score
- 70/100
- State rank
- #39
- US rank
- #7699
Category grades
Schools grade is shown separately in the Schools card above.
Census & demographics
- Census place
- Glenpool, OK
- County
- Tulsa County · 640,811 people
- City population
- 13,745
- Metro
- Tulsa, OK
- Population (ZIP)
- 13,745
- Household income
- $80,542
- Rent vs Own
- Severe rent burden
- 288.0
Population outlook (Tulsa County) Hauer SSP2
- Today (2025)
- 723,846 people
- By 2030
- 766,033 · +5.8%
- By 2040
- 851,386 · +17.6%
- By 2050
- 938,389 · +29.6%
- By 2075
- 1,166,011 · +61.1%
- By 2100
- 1,350,277 · +86.5%
Race, ethnicity, and origin ACS 2023
- Neighborhood character
- Diverse neighborhood (Simpson 0.61)
- Race & ethnicity
- White 61% Two or more races 17% Hispanic / Latino 11% Native American 7% Asian 4% Black 4%
- Hispanic origin (detail)
- Mexican 8%
- Common ancestry
- Lithuanian 3% Slovak 2% Romanian 2%
- Foreign-born
- 7% · Canada, Philippines, South Korea
- Languages at home
- 89% English-only · Spanish 6% Other Asian/Pacific 2% Tagalog/Filipino 1%
Political lean MEDSL · Tulsa
- 2024 margin
- R (+15.2) · D 41.3% · R 56.5% · Other 2.2%
- 2008→2024 swing
- +9.2pp toward D · 2008: -24.5pp · 2024: -15.2pp
- All cycles
- 2024: R+15.2 2020: R+15.6 2016: R+22.9 2012: R+27.4 2008: R+24.5
Not yet ingested
- Civics
- —
Market trends
- HPI YoY
- ▼ -51.90%
- Current HPI
- 223.9379
- Rent YoY
- —
- Metro
- Tulsa, OK
- State GDP YoY
- ▲ 1.55%
- F500 in state
- 6
Industry mix (Fortune 500 HQ in OK)
| Industry | F500 HQs | Revenue |
|---|---|---|
| Energy | 3 | $48B |
|
||
Price history
+340.9% since first listed9 events — show timeline
- 2026-05-11 Pending — MLS Technology, Inc.
- 2026-05-06 Listed $149,900 MLS Technology, Inc.
- 2007-02-18 Listing Removed — MLS Technology, Inc.
- 2006-08-18 Listed $90,000 MLS Technology, Inc.
- 2006-05-24 Listing Removed — MLS Technology, Inc.
- 2006-02-18 Listed $90,000 MLS Technology, Inc.
- 1993-08-30 Sold (Public Records) $46,000 Public Records
- 1992-01-01 Sold (Public Records) $34,000 Public Records
- 1991-10-11 Listed $34,000 MLS Technology, Inc.
Property tax history
+3.2%/yrLatest (2025): $864 · +4.9% YoY. Source: county tax records.
Cash-flow waterfall
monthlySold comps — $/sqft
last 12 mo · ≤1 miLoading sold comps…