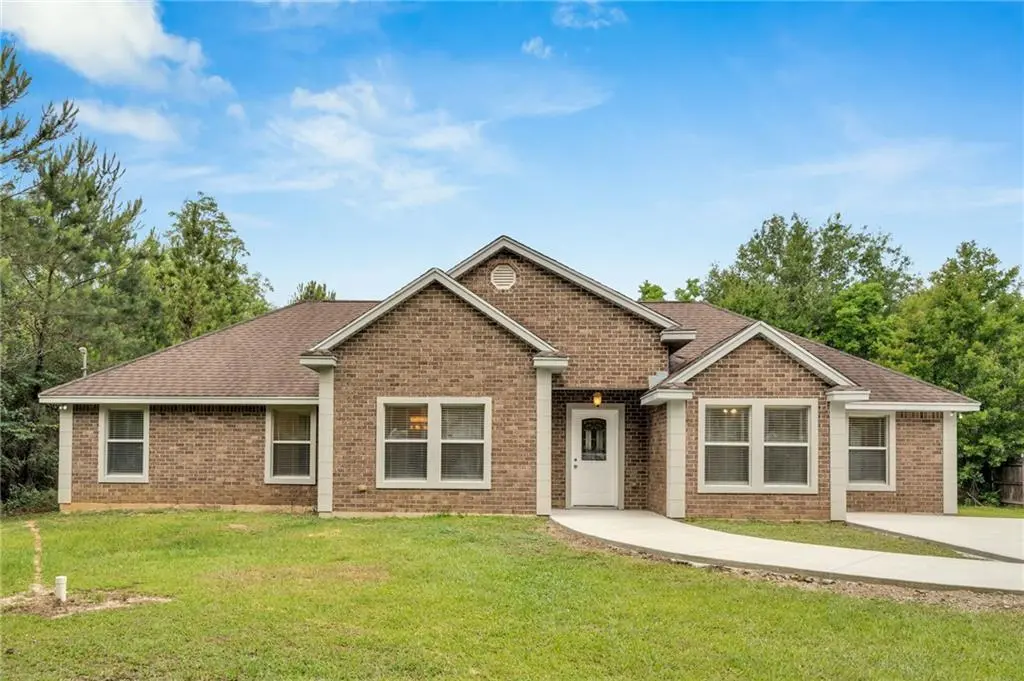
4306 Holly Dr · Slidell, LA
Flood risk 7/10 · Major
- FEMA flood zone
- X
- Chance of flooding over 30 yrs
- 0.76%
- Est. flood insurance / yr
- $507 – $1,088
Fire risk 3/10 · Minor
- Est. fire insurance / yr
- $1,269 – $2,357
Heat risk 9/10 · Severe
- Hot days now (above 107°F)
- 7 days/yr
- Hot days in 30 yrs
- 21 days/yr
Wind risk 9/10 · Severe
- Chance of severe wind over 30 yrs
- 99.0%
Air-quality risk 2/10 · Minimal
- Unhealthy air days now
- 1 days/yr
- Unhealthy air days in 30 yrs
- 2 days/yr
Risk factors via First Street. Map © Google.
Why this score? — see what drove the D grade
The composite is a weighted blend of 9 inputs, each scored 0–100. Each bar is that input's sub-score; the figure is the points it added to the 100-point composite (weight × sub-score).
- Cash flow +14.7/30.0
- ARV discount +7.6/15.0
- DSCR +4.5/10.0
- Schools +4.3/10.0
- Livability +3.5/5.0
- 1% rule +3.3/10.0
- Rent growth +2.9/5.0
- Condition / age +2.5/5.0
- Appreciation +0.0/10.0
$309,000
🖨 Deal sheet (PDF) 📄 Offer letter ✓ Due diligence
Listing remarks MLS
Beautiful Spacious Family Home on Oversized lot. Redone and updated 2025. Brand new driveway and walkway. Open flowing floor plan with dining room and breakfast room. Very large family room with wet bar. Primary Bedroom with sitting area. Vacant and easy to see.
Key facts
- Wet bar
- Brand new driveway
- Brand new walkway
Tags
Property features AI
Exterior
- Parking: Off-street parking
- Utilities: Private well water; Septic tank sewer
- Home design: Single-story; Brick construction; Updated in 2026; Shingle/asphalt roof; Slab foundation; Property in excellent condition
- Construction: Brick exterior; Asphalt shingle roof; Built/updated in 2026; Slab foundation
- Exterior features: Outside city limits; Oversized, rectangular lot (100 x 150)
Interior
- Kitchen: Dishwasher; Disposal; Microwave; Oven; Range; Refrigerator
- Bathrooms: 2 full bathrooms; 1 half bathroom
- Heating & cooling: Central heating; Central air conditioning
- Interior features: Attic access with pull-down stairs; Wet bar; Tray ceilings; Ceiling fans; Granite countertops
Neighborhood map
What this means for you Summary
Snapshot
- This is a 3-bed/2.5-bath single-family listed at $309k.
Deal economics
- At list price, monthly cash flow is $13 ($155/yr) — positive.
- The deal already cash-flows at list — no discount required.
- To meet the 1% rule (rent ≥ 1% of price), the offer needs to be $256k (17.2% below list).
- Recommended offer: $256k (17.2% below list) — sets the bar for 1% rule.
Location & tenants
- Location reads 70/100 on livability (#57 in LA) — a middle-class / working-renter tenant base. Strengths: cost of living A+, housing A+, health & safety A+; Watch: amenities F, commute F.
- St. Tammany Parish (suburban): math 43% / reading 55% proficiency, ranked #11 of 98 in LA (top 11%) — families likely to look elsewhere, expect single-tenant / working-renter base with shorter leases.
- Zoned schools: Cypress Cove Elementary School (657 students, 53% FRL); Little Oak Middle School (math 50% / reading 58%, grade B-, #19 of 218 statewide, top 9%, 929 students, 41% FRL); Pearl River High School (math 22% / reading 36%, grade F, #132 of 265 statewide, top 50%, 830 students, 55% FRL).
- Market conditions: Rents rising (+1.7%/yr); 594 active listings in the ZIP; 3 comparable units currently listed for rent nearby; rentals at typical pace (median 26d on market — plan ~3-4 weeks tenant-placement turnaround); solid renter incomes; 1,064 units permitted in St. Tammany Parish in 2024 (0 in 5+ unit buildings).
- This rent runs 34% of the median local income ($89k/yr) — at the standard rent-burdened threshold; future hikes will face affordability resistance.
Forward outlook
- Local home prices are declining (-3.0%/yr); year-one equity from $2k of loan paydown is wiped out by about $9k of value loss. Plan a longer hold.
- St. Tammany County population projected at +27% by 2050 — long-run rental-demand tailwind backs the buy-and-hold thesis.
Negotiation context
- It's been on market 29 days — a 2% lower offer ($304k) is reasonable based on typical stale-listing flexibility.
- 8 sale attempts since 19y ago; this cycle's ask has dropped $30k (9%) from the opening price — seller is motivated, your offer sets the floor, not the list.
- Current owner paid $155k; list at $309k implies a 99% gain — meaningful room to come down on a strong offer.
Risks & watch-outs
- Watch-outs: flood insurance adds $66/mo.
- Climate carrying-cost: major flood risk; severe wind risk, 99% chance of damaging wind over 30y; extreme-heat days projected 7→21/yr by 2055 (HVAC capex compounding) — expect insurance premiums to compound above CPI over the hold.
Questions for the listing agent
- What's the actual annual flood-insurance premium (NFIP or private), and is the property in a SFHA with mandatory coverage?
- Is there a deadline driving the sale (1031 exchange, divorce, estate, relocation)? That informs how much negotiation room exists.
- Schools are B-rated — typically a magnet for longer-tenancy family renters. What's the average tenant stay here, and is there a school-zone premium baked into asking?
- The area grade is low — what's the realistic commute time and amenity access for the typical tenant pool here? Any planned neighborhood developments (good or bad) we should know about?
- What's the average days-on-market for RENTAL listings here right now (not sales)? A rising rental-DOM trend means longer vacancies and softer asking-rent achievability than the comps imply.
- What's the recent tenant-quality profile in this submarket — average credit score on applications, eviction rate, late-payment / NSF rate, and stable-employment percentage? A property-management company in the area should have these aggregated.
- How much new for-sale + rental construction is in the pipeline within 1–3 miles? Heavy new supply typically softens prices + rents 12–24 months out; constrained supply supports both.
Investment metrics
- 1% rule
- 0.83% ✗
- Cap rate
- 6.60%
- Cash-on-cash
- 1.10%
- DSCR
- 1.05
- GRM
- 10.1
CMA / ARV
- ARV (on-the-fly)
- $309,420
- Comps found
- 5
Show comp detail 5 sales within ~0.75 mi
| Address | Dist | Beds/Ba | Sqft | Sold | Price | $/sf | Match |
|---|---|---|---|---|---|---|---|
| 439 Parlange Dr | 0.45mi | 4/2.5 (+1) | 2,182 (-5%) | 14mo | $287,500 | $132 | 55 |
| 437 Parlange Dr | 0.41mi | 3/2.5 | 2,471 (+8%) | 19mo | $335,000 | $136 | 52 |
| 208 Tulip Dr | 0.52mi | 4/2.5 (+1) | 2,365 (+3%) | 21mo | $276,000 | $117 | 48 |
| 40633 Cara Mae St | 0.69mi | 4/3.0 (+1) | 2,484 (+8%) | 2mo | $334,900 | $135 | 45 |
| 40590 Cara Mae St | 0.69mi | 4/3.0 (+1) | 2,038 (-11%) | 1mo | $309,900 | $152 | 42 |
Match score weights: distance 35% · size 25% · config 20% · recency 20%. Top-matched comps best support the ARV.
Projected returns pro-forma
-3.0% appreciation · 1.72% rent growth · sell at horizon
- IRR
- -17.4%
- Equity multiple
- 0.39×
- Total profit
- $-52,540
- Equity at exit
- $46,073
- IRR
- -11.9%
- Equity multiple
- 0.33×
- Total profit
- $-57,860
- Equity at exit
- $26,717
Cash invested: $86,520 (down + closing). Projections, not guarantees.
Landlord ↔ Tenant lean methodology
- Overall (STATE)
- 90 Strongly Landlord-Friendly
- State Louisiana
- 90 Strongly Landlord-Friendly · R+12
- County
- — inherits STATE
- City
- — inherits STATE
ZIP-level market 70461
- Home prices YoY
- -33.0%
- Rents YoY
- 1.7%
- Active inventory
- 594
- Price-to-rent
- 10.1×
Monthly cashflow live
- Estimated rent
- $2,557 medium interval (Pro) →
- Mortgage (P&I)
- −$1,620
- Tax from tax record
- −$191 /mo · $2,298/yr
- Insurance
- −$129
- Flood insurance flood zone
- −$66 /mo · $798/yr
- HOA
- −$0
- Vacancy / Maint / Mgmt
- −$537
- Net cashflow
- $13
Break-even live
Sensitivity live
| Price | -10% $188 | -5% $100 | +0% $13 | +5% $-75 | +10% $-162 |
|---|---|---|---|---|---|
| Rent | -10% $-189 | -5% $-88 | +0% $13 | +5% $114 | +10% $215 |
| Rate | -1.0pp $169 | -0.5pp $92 | base $13 | +0.5pp $-67 | +1.0pp $-149 |
UW: 25.0% down · 7.5% · 30yr · 1.5% tax · 5.0% vac · 8.0% maint · 8.0% mgmt
Financing live
Cash to close
- Down payment
- $77,250
- Closing costs
- $9,270
- Reserves months
- —
- Total cash needed
- —
Loan-product check · same deal, 3 products live
Conventional
25% down · 7.5% · 30yr
- Down + closing
- —
- Monthly P&I
- —
- Monthly cashflow
- —
- DSCR
- —
- Eligible?
- —
Personal DTI + credit; lowest rate.
DSCR
20% down · 8.5% · 30yr
- Down + closing
- —
- Monthly P&I
- —
- Monthly cashflow
- —
- DSCR
- —
- Eligible?
- —
No personal income docs; deal must DSCR.
Hard money
10% down · 12.0% · 12mo
- Down + closing
- —
- Monthly P&I
- —
- Monthly cashflow
- —
- DSCR
- —
- Eligible?
- —
Short-term bridge; refi at stabilization.
Rent comps 3 comps
| Address | Beds | Baths | Sqft | Rent | $/sqft | DOM | Units | Dist |
|---|---|---|---|---|---|---|---|---|
| 61258 N Military Rd Slidell, LA | 4.0 | 3.0 | 2900 | $3,000 | $1.03 | 25d | 1 | 0.39mi |
| 812 N Lake Verret Ct Slidell, LA | 3.0 | 2.0 | 1862 | $2,500 | $1.34 | 25d | 1 | 0.93mi |
| 555 Cross Gates Blvd Slidell, LA | 4.0 | 2.5 | 2300 | $2,425 | $1.05 | 45d | 1 | 1.20mi |
Listing history 31 events
-
2026-06-21days on market $309,000 Active 29 DOM
-
2026-06-18days on market $309,000 Active 26 DOM
-
2026-06-17days on market $309,000 Active 25 DOM
-
2026-06-16days on market $309,000 Active 24 DOM
-
2026-06-15days on market $309,000 Active 23 DOM
-
2026-06-13days on market $309,000 Active 21 DOM
-
2026-06-10days on market $309,000 Active 18 DOM
-
2026-06-09days on market $309,000 Active 17 DOM
-
2026-06-08days on market $309,000 Active 16 DOM
-
2026-06-07days on market $309,000 Active 15 DOM
-
2026-06-03days on market $309,000 Active 11 DOM
-
2026-06-02days on market $309,000 Active 10 DOM
-
2026-06-02price $309,000 Active 9 DOM
-
2026-06-01days on market $339,000 Active 9 DOM
-
2026-05-31days on market $339,000 Active 8 DOM
-
2026-05-21$339,000 Active
Show marketing remark (262 chars)
Beautiful Spacious Family Home on Oversized lot. Redone and updated 2025. Brand new driveway and walkway. Open flowing floor plan with dining room and breakfast room. Very large family room with wet bar. Primary Bedroom with sitting area. Vacant and easy to see.
-
2026-05-21$339,000 Active 262-char remark
Show marketing remark (262 chars)
Beautiful Spacious Family Home on Oversized lot. Redone and updated 2025. Brand new driveway and walkway. Open flowing floor plan with dining room and breakfast room. Very large family room with wet bar. Primary Bedroom with sitting area. Vacant and easy to see.
-
2025-11-24soldstatus $155,000
-
2025-07-22price $200,000
-
2025-07-22price $200,000
-
2025-07-22price $200,000
-
2025-07-08$215,000 Active
-
2025-06-25price $215,000
-
2025-06-04price $217,500
-
2025-05-28price $220,000
-
2025-05-17$225,000 Active
-
2008-12-23soldstatus $155,000
-
2008-10-10$159,000
-
2008-10-10$159,000
-
2007-12-14$199,900
-
2007-12-14$199,900
ⓘ Source: listings_history table (triggers on properties + properties_extension) + one-shot
backfill from property_details.listing_events for pre-trigger history.
Tax reassessment forecast LA · Resets to sale price
- Current annual tax
- $2,298 · $191/mo
- Projected year-2 tax
- $2,298 · $191/mo
- Expected delta
- $0/yr ($0/mo · 0.0%)
ⓘ Screening estimate from a state-policy table — verify with the county assessor before closing.
Climate risk First Street
- Flood 7/10 Severe FEMA zone X · 76% chance over 30 yrs
- Wildfire 3/10 Moderate
- Heat 9/10 Extreme 7 d/yr ≥107°F today · 21 d/yr by 30 yrs out
- Wind 9/10 Extreme 99% chance of damaging wind over 30 yrs
- Air quality 2/10 Low 1 unhealthy d/yr today · 2 by 30 yrs out
Nearby sold comps map
Loading sold comps map…
Walkable amenities ~0.75 mi
Loading nearby amenities…
Taxation est. · year 1
- Rental income
- $30,684
- − Mortgage interest
- −$17,309
- − Property taxes
- −$2,298
- − Insurance
- −$2,342
- − Repairs & maintenance
- −$2,455
- − Management
- −$2,455
- − Depreciation
- −$8,989
- Taxable loss
- −$5,163
- Est. tax savings @ 24.0%
- +$1,239
- After-tax cash flow
- $1,394/yr
For passive investors: Depreciation is non-cash, so a rental often shows a tax loss while cash-flowing — sheltering income. Rental losses are passive: they offset passive income freely, and up to $25,000/yr can offset ordinary (W-2) income if you actively participate and your MAGI is under $100k (phasing out to $0 by $150k); unused losses carry forward. On sale, claimed depreciation is recaptured at up to 25%, and gains may owe capital-gains tax (a 1031 exchange can defer both). Figures are a year-1 estimate at your 24.0% rate — not tax advice; consult a CPA.
Schools (NCES district)
- District
- St. Tammany Parish
- NCES district ID
- 2201650
- Math proficiency
- 43% ▼ -32.00%
- Reading proficiency
- 55% ▼ -26.00%
- Median HH income
- $61,752
- Composite
- 43.04/100
- National rank
- #3098
- State rank
- #11 of 98 in LA
Livability — Slidell
- Score
- 70/100
- State rank
- #57
- US rank
- #7673
Category grades
Schools grade is shown separately in the Schools card above.
Census & demographics
- County
- Saint Tammany Parish · 228,296 people
- City population
- 95,511
- Metro
- New Orleans-Metairie, LA
- Population (ZIP)
- 34,808
- Household income
- $89,003
- Rent vs Own
- Severe rent burden
- 328.0
Population outlook (St. Tammany County) Hauer SSP2
- Today (2025)
- 286,725 people
- By 2030
- 304,175 · +6.1%
- By 2040
- 336,203 · +17.3%
- By 2050
- 364,590 · +27.2%
- By 2075
- 433,362 · +51.1%
- By 2100
- 470,333 · +64.0%
Race, ethnicity, and origin ACS 2023
- Neighborhood character
- Diverse neighborhood (Simpson 0.63)
- Race & ethnicity
- White 55% Black 24% Two or more races 14% Hispanic / Latino 11% Asian 3%
- Hispanic origin (detail)
- Common ancestry
- Lithuanian 9% Italian 1% Romanian 1%
- Foreign-born
- 8% · Canada, China, Vietnam
- Languages at home
- 89% English-only · Spanish 7% Chinese 1% Vietnamese 1%
Political lean MEDSL · St. Tammany
- 2024 margin
- Solid R (+43.8) · D 27.3% · R 71.1% · Other 1.6%
- 2008→2024 swing
- +9.6pp toward D · 2008: -53.4pp · 2024: -43.8pp
- All cycles
- 2024: R+43.8 2020: R+44.2 2016: R+50.8 2012: R+52.2 2008: R+53.4
Not yet ingested
- Civics
- —
Market trends
- HPI YoY
- ▼ -74.47%
- Current HPI
- 151.3353
- Rent YoY
- ▲ 1.72%
- Metro
- New Orleans-Metairie, LA
- State GDP YoY
- ▲ 3.29%
- F500 in state
- 10
Industry mix (Fortune 500 HQ in LA)
| Industry | F500 HQs | Revenue |
|---|---|---|
| Telecommunications | 2 | $23B |
|
||
| Utilities | 1 | $12B |
|
||
| Wholesale / Distribution | 1 | $5B |
|
||
| Advertising | 1 | $2B |
|
||
Price history
+69.6% since first listed16 events — show timeline
- 2026-05-21 Listed $339,000 AcadianaMLS
- 2026-05-21 Listed $339,000 GSREIN
- 2025-11-24 Sold (Public Records) $155,000 Public Records
- 2025-07-22 Price Changed $200,000 AcadianaMLS
- 2025-07-22 Price Changed $200,000 AcadianaMLS
- 2025-07-22 Price Changed $200,000 GSREIN
- 2025-07-08 Listed $215,000 AcadianaMLS
- 2025-06-25 Price Changed $215,000 AcadianaMLS
- 2025-06-04 Price Changed $217,500 AcadianaMLS
- 2025-05-28 Price Changed $220,000 AcadianaMLS
- 2025-05-17 Listed $225,000 AcadianaMLS
- 2008-12-23 Sold (MLS) $155,000 GSREIN
- 2008-10-10 Listed $159,000 AcadianaMLS
- 2008-10-10 Listed $159,000 GSREIN
- 2007-12-14 Listed $199,900 GSREIN
- 2007-12-14 Listed $199,900 AcadianaMLS
Property tax history
-1.6%/yrLatest (2025): $2,298 · -3.9% YoY. Source: county tax records.
Cash-flow waterfall
monthlySold comps — $/sqft
last 12 mo · ≤1 miLoading sold comps…