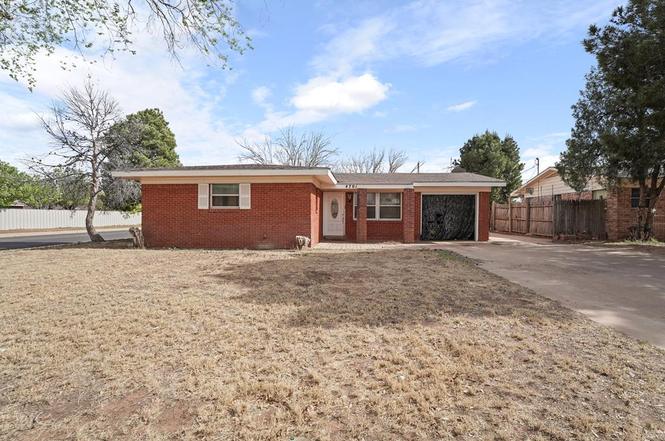
4701 Erie Dr · Midland, TX
Flood risk 1/10 · Minimal
- FEMA flood zone
- X
- Chance of flooding over 30 yrs
- 0.0%
- Est. flood insurance / yr
- $507 – $1,088
Fire risk 8/10 · Major
- Est. fire insurance / yr
- $1,222 – $2,270
Heat risk 6/10 · Moderate
- Hot days now (above 102°F)
- 7 days/yr
- Hot days in 30 yrs
- 21 days/yr
Wind risk 2/10 · Minimal
- Chance of severe wind over 30 yrs
- 3.0%
Air-quality risk 1/10 · Minimal
- Unhealthy air days now
- 0 days/yr
- Unhealthy air days in 30 yrs
- 0 days/yr
Risk factors via First Street. Map © Google.
Why this score? — see what drove the B- grade
The composite is a weighted blend of 9 inputs, each scored 0–100. Each bar is that input's sub-score; the figure is the points it added to the 100-point composite (weight × sub-score).
- Cash flow +28.2/30.0
- DSCR +10.0/10.0
- ARV discount +9.7/15.0
- 1% rule +7.9/10.0
- Livability +4.0/5.0
- Schools +3.2/10.0
- Condition / age +2.5/5.0
- Rent growth +2.4/5.0
- Appreciation +0.0/10.0
$149,900
🖨 Deal sheet (PDF) 📄 Offer letter ✓ Due diligence
Listing remarks MLS
Nice home near park and school. Carpet after the owner left, newer paint, newer ceramic tiles. This home is very clean and maintained. You need to see to appreciate, this is a sleeper. Extra parking pad, central air and heat.
Key facts
- 9,235 sq ft lot
- Garage
- Built 1959
Neighborhood map
What this means for you Summary
Snapshot
- This is a 3-bed/2.0-bath single-family listed at $150k.
Deal economics
- At list price, monthly cash flow is $474 ($6k/yr) — positive.
- The deal already cash-flows at list — no discount required.
- Meets the 1% rule at list price ($2k rent vs $150k).
- Cap rate 10.1% vs local median 4.7% in Midland — top-decile yield for the area; either an underpriced asset or a hidden risk that comps aren't pricing in. Stress-test before assuming the spread holds.
Location & tenants
- Location reads 79/100 on livability (#57 in TX, #2,192 nationally) — a middle-class / working-renter tenant base. Strengths: employment A+, housing A+, health & safety A+; Watch: crime C-, commute D+, amenities D.
- Midland ISD (urban): math 34% / reading 36% proficiency, ranked #477 of 826 in TX (top 58%) — families likely to look elsewhere, expect single-tenant / working-renter base with shorter leases.
- Zoned schools: Henderson El (math 42% / reading 27%, grade F, #1,995 of 4,322 statewide, top 50%, 491 students, 79% FRL); Goddard J H (math 23% / reading 32%, grade F, #1,156 of 1,662 statewide, top 71%, 1,024 students, 58% FRL, charter); Midland H S (math 37% / reading 7%, grade F, #1,366 of 1,632 statewide, top 84%, 2,492 students, 44% FRL).
- Market conditions: Rents soft (-0.3%/yr); 64 active listings in the ZIP; 26 comparable units currently listed for rent nearby; rentals at typical pace (median 22d on market — plan ~3-4 weeks tenant-placement turnaround); solid renter incomes; 1,504 units permitted in Midland County in 2024 (0 in 5+ unit buildings).
- This rent runs 30% of the median local income ($77k/yr) — at the standard rent-burdened threshold; future hikes will face affordability resistance.
Forward outlook
- Local home prices are declining (-3.0%/yr); year-one equity from $1k of loan paydown is wiped out by about $4k of value loss. Plan a longer hold.
- Midland County population projected at +83% by 2050 — long-run rental-demand tailwind backs the buy-and-hold thesis.
Negotiation context
- Only 3 days on market — expect competitive offers; lowballing is unlikely to land.
- 3 sale attempts since 26y ago; this cycle's ask has dropped $30k (17%) from the opening price — seller is motivated, your offer sets the floor, not the list.
Risks & watch-outs
- Watch-outs: built in 1959 — expect roof / HVAC / electrical / plumbing capex.
- Climate carrying-cost: severe wildfire risk; extreme-heat days projected 7→21/yr by 2055 (HVAC capex compounding) — expect insurance premiums to compound above CPI over the hold.
Questions for the listing agent
- Built in 1959 — when were the roof, HVAC, electrical panel, plumbing, and water heater last replaced?
- Is there a deadline driving the sale (1031 exchange, divorce, estate, relocation)? That informs how much negotiation room exists.
- What's the average days-on-market for RENTAL listings here right now (not sales)? A rising rental-DOM trend means longer vacancies and softer asking-rent achievability than the comps imply.
- What's the recent tenant-quality profile in this submarket — average credit score on applications, eviction rate, late-payment / NSF rate, and stable-employment percentage? A property-management company in the area should have these aggregated.
- How much new for-sale + rental construction is in the pipeline within 1–3 miles? Heavy new supply typically softens prices + rents 12–24 months out; constrained supply supports both.
Investment metrics
- 1% rule
- 1.29% ✓
- Cap rate
- 10.08%
- Cash-on-cash
- 13.54%
- DSCR
- 1.60
- GRM
- 6.5
CMA / ARV
- ARV (on-the-fly)
- $157,687
- Comps found
- 2
Show comp detail 2 sales within ~0.75 mi
| Address | Dist | Beds/Ba | Sqft | Sold | Price | $/sf | Match |
|---|---|---|---|---|---|---|---|
| 4626 Wilshire Dr | 0.10mi | 3/2.0 | 1,166 (+1%) | 8mo | $160,000 | $137 | 87 |
| 4210 Pleasant Dr | 0.60mi | 3/1.0 | 1,259 (+9%) | 15mo | $160,000 | $127 | 40 |
Match score weights: distance 35% · size 25% · config 20% · recency 20%. Top-matched comps best support the ARV.
Projected returns pro-forma
-3.0% appreciation · 0.0% rent growth · sell at horizon
- IRR
- 0.2%
- Equity multiple
- 1.01×
- Total profit
- $239
- Equity at exit
- $22,351
- IRR
- 6.4%
- Equity multiple
- 1.41×
- Total profit
- $17,299
- Equity at exit
- $12,961
Cash invested: $41,972 (down + closing). Projections, not guarantees.
Landlord ↔ Tenant lean methodology
- Overall (STATE)
- 87 Strongly Landlord-Friendly
- State Texas
- 87 Strongly Landlord-Friendly · R+5
- County
- — inherits STATE
- City
- — inherits STATE
ZIP-level market 79703
- Rents YoY
- -0.3%
- Active inventory
- 64
- Price-to-rent
- 6.5×
Monthly cashflow live
- Estimated rent
- $1,934 high interval (Pro) →
- Mortgage (P&I)
- −$786
- Tax from tax record
- −$206 /mo · $2,473/yr
- Insurance
- −$62
- HOA
- −$0
- Vacancy / Maint / Mgmt
- −$406
- Net cashflow
- $474
Break-even live
Sensitivity live
| Price | -10% $558 | -5% $516 | +0% $474 | +5% $431 | +10% $389 |
|---|---|---|---|---|---|
| Rent | -10% $321 | -5% $397 | +0% $474 | +5% $550 | +10% $626 |
| Rate | -1.0pp $549 | -0.5pp $512 | base $474 | +0.5pp $435 | +1.0pp $395 |
UW: 25.0% down · 7.5% · 30yr · 1.5% tax · 5.0% vac · 8.0% maint · 8.0% mgmt
Financing live
Cash to close
- Down payment
- $37,475
- Closing costs
- $4,497
- Reserves months
- —
- Total cash needed
- —
Loan-product check · same deal, 3 products live
Conventional
25% down · 7.5% · 30yr
- Down + closing
- —
- Monthly P&I
- —
- Monthly cashflow
- —
- DSCR
- —
- Eligible?
- —
Personal DTI + credit; lowest rate.
DSCR
20% down · 8.5% · 30yr
- Down + closing
- —
- Monthly P&I
- —
- Monthly cashflow
- —
- DSCR
- —
- Eligible?
- —
No personal income docs; deal must DSCR.
Hard money
10% down · 12.0% · 12mo
- Down + closing
- —
- Monthly P&I
- —
- Monthly cashflow
- —
- DSCR
- —
- Eligible?
- —
Short-term bridge; refi at stabilization.
Rent comps 26 comps
| Address | Beds | Baths | Sqft | Rent | $/sqft | DOM | Units | Dist |
|---|---|---|---|---|---|---|---|---|
| 5109 Graceland Dr Unit A Midland, TX | 3.0 | 2.0 | 1365 | $2,250 | $1.65 | 45d | 1 | 0.38mi |
| 117 N Glenwood Dr Unit D Midland, TX | 2.0 | 2.0 | 1000 | $1,795 | $1.79 | 22d | 1 | 0.53mi |
| 4409 Roosevelt Dr Midland, TX | 3.0 | 2.0 | 1230 | $1,750 | $1.42 | 45d | 1 | 0.55mi |
| 4707 Shadylane Dr Unit B Midland, TX | 2.0 | 1.0 | 960 | $1,400 | $1.46 | 14d | 1 | 0.55mi |
| 123 N Glenwood Dr Unit A Midland, TX | 2.0 | 1.0 | 1000 | $1,695 | $1.70 | 45d | 1 | 0.57mi |
| 4701 W Illinois Ave Unit D Midland, TX | 2.0 | 1.0 | 942 | $1,050 | $1.11 | 22d | 1 | 0.63mi |
| 4610 Storey Ave Midland, TX | 3.0 | 2.0 | 1184 | $1,899 | $1.60 | 22d | 1 | 0.78mi |
| 4506 Storey Ave Midland, TX | 3.0 | 1.0 | 1400 | $1,650 | $1.18 | 14d | 1 | 0.84mi |
| 3811 Cedar Spring Dr Midland, TX | 4.0 | 2.0 | 1500 | $2,600 | $1.73 | 45d | 1 | 0.88mi |
| 5202 Ric Dr Midland, TX | 3.0 | 2.0 | 1258 | $1,975 | $1.57 | 22d | 1 | 0.91mi |
| 4525 Crockett Ave Midland, TX | 2.0 | 2.0 | 1400 | $4,250 | $3.04 | 22d | 1 | 0.92mi |
| 4519 Crockett Ave Midland, TX | 2.0 | 2.0 | 1465 | $1,900 | $1.30 | 22d | 1 | 0.93mi |
| 4503 Crockett Ave Unit B Midland, TX | 2.0 | 2.0 | 1250 | $2,000 | $1.60 | 45d | 1 | 0.95mi |
| 4719 Bowie Dr Midland, TX | 3.0 | 2.0 | 991 | $4,500 | $4.54 | 22d | 1 | 0.96mi |
| 516 North Loop 250 W Midland, TX | 1.0–2.0 | 1.0–2.0 | 757 | $1,724 | $2.28 | 14d | 28 | 0.96mi |
| 4405 Crockett Ave Unit A Midland, TX | 3.0 | 2.0 | 1100 | $1,800 | $1.64 | 45d | 1 | 0.98mi |
| 4000 W Illinois Ave Midland, TX | 1.0–2.0 | 1.0–2.0 | 755 | $1,545 | $2.05 | 22d | 10 | 0.99mi |
| 4403 Crockett Ave Unit A Midland, TX | 3.0 | 2.0 | 1065 | $1,800 | $1.69 | 22d | 1 | 0.99mi |
| 3712 Amelia Dr Midland, TX | 3.0 | 1.0 | 1046 | $2,000 | $1.91 | 22d | 1 | 1.02mi |
| 4313 Storey Ave Unit A Midland, TX | 3.0 | 2.0 | 1255 | $2,000 | $1.59 | 45d | 1 | 1.02mi |
| 509 Delmar St Midland, TX | 1.0–2.0 | 1.0–2.5 | 1116 | $1,796 | $1.61 | 14d | 8 | 1.03mi |
| 3506 Apache Dr Midland, TX | 2.0 | 1.0 | 1004 | $1,800 | $1.79 | 22d | 1 | 1.22mi |
| 1811 Tradewinds Blvd Midland, TX | 1.0–3.0 | 1.0–2.0 | 1013 | $1,617 | $1.60 | 45d | 1 | 1.30mi |
| 3403 Thomas Ave Midland, TX | 2.0 | 2.0 | 1472 | $2,000 | $1.36 | 14d | 1 | 1.37mi |
| 1808 Tradewinds Blvd Midland, TX | 1.0–3.0 | 1.0–2.0 | 1126 | $2,078 | $1.84 | 14d | 13 | 1.39mi |
| 704 Nolan Ryan Dr Midland, TX | 3.0 | 2.0 | 1454 | $2,500 | $1.72 | 45d | 1 | 1.43mi |
Listing history 8 events
-
2025-04-18status Pending
-
2025-04-15status Active
-
2025-04-15price $149,900
-
2025-04-01status Pending
-
2025-03-30$179,900 Active
-
2000-12-29soldstatus
-
2000-12-22soldstatus 225-char remark
Show marketing remark (225 chars)
Nice home near park and school. Carpet after the owner left, newer paint, newer ceramic tiles. This home is very clean and maintained. You need to see to appreciate, this is a sleeper. Extra parking pad, central air and heat.
-
2000-09-25$42,000 225-char remark
Show marketing remark (225 chars)
Nice home near park and school. Carpet after the owner left, newer paint, newer ceramic tiles. This home is very clean and maintained. You need to see to appreciate, this is a sleeper. Extra parking pad, central air and heat.
ⓘ Source: listings_history table (triggers on properties + properties_extension) + one-shot
backfill from property_details.listing_events for pre-trigger history.
Tax reassessment forecast TX · Resets to sale price
- Current annual tax
- $2,473 · $206/mo
- Projected year-2 tax
- $2,743 · $229/mo
- Expected delta
- +$270/yr (+$23/mo · 10.9%)
ⓘ Screening estimate from a state-policy table — verify with the county assessor before closing.
Climate risk First Street
- Flood 1/10 Low FEMA zone X · 0% chance over 30 yrs
- Wildfire 8/10 Severe
- Heat 6/10 Major 7 d/yr ≥102°F today · 21 d/yr by 30 yrs out
- Wind 2/10 Low 3% chance of damaging wind over 30 yrs
- Air quality 1/10 Low 0 unhealthy d/yr today · 0 by 30 yrs out
Nearby sold comps map
Loading sold comps map…
Walkable amenities ~0.75 mi
Loading nearby amenities…
Taxation est. · year 1
- Rental income
- $23,212
- − Mortgage interest
- −$8,397
- − Property taxes
- −$2,473
- − Insurance
- −$750
- − Repairs & maintenance
- −$1,857
- − Management
- −$1,857
- − Depreciation
- −$4,361
- Taxable income
- $3,518
- Est. tax owed @ 24.0%
- −$844
- After-tax cash flow
- $4,838/yr
For passive investors: Depreciation is non-cash, so a rental often shows a tax loss while cash-flowing — sheltering income. Rental losses are passive: they offset passive income freely, and up to $25,000/yr can offset ordinary (W-2) income if you actively participate and your MAGI is under $100k (phasing out to $0 by $150k); unused losses carry forward. On sale, claimed depreciation is recaptured at up to 25%, and gains may owe capital-gains tax (a 1031 exchange can defer both). Figures are a year-1 estimate at your 24.0% rate — not tax advice; consult a CPA.
Schools (NCES district)
- District
- Midland ISD
- NCES district ID
- 4830570
- Math proficiency
- 34% ▼ -7.00%
- Reading proficiency
- 36% ▬ 0.00%
- Median HH income
- $63,457
- Composite
- 31.63/100
- National rank
- #5938
- State rank
- #477 of 826 in TX
Livability — Midland
- Score
- 79/100
- State rank
- #57
- US rank
- #2192
Category grades
Schools grade is shown separately in the Schools card above.
Census & demographics
- Census place
- Midland, TX
- County
- Midland County · 168,494 people
- City population
- 168,494
- Metro
- Midland, TX
- Population (ZIP)
- 20,419
- Household income
- $77,285
- Rent vs Own
- Severe rent burden
- 417.0
Population outlook (Midland County) Hauer SSP2
- Today (2025)
- 220,895 people
- By 2030
- 253,667 · +14.8%
- By 2040
- 325,498 · +47.4%
- By 2050
- 404,168 · +83.0%
- By 2075
- 609,802 · +176.1%
- By 2100
- 760,172 · +244.1%
Race, ethnicity, and origin ACS 2023
- Neighborhood character
- Diverse neighborhood (Simpson 0.59)
- Race & ethnicity
- Hispanic / Latino 54% White 34% Two or more races 16% Black 8% Asian 2%
- Hispanic origin (detail)
- Mexican 45% Cuban 4%
- Common ancestry
- Slovak 1% Italian 1% Serbian 1%
- Foreign-born
- 20% · Canada, Jamaica, Vietnam
- Languages at home
- 58% English-only · Spanish 38% Arabic 1% Chinese 1%
Political lean MEDSL · Midland
- 2024 margin
- Solid R (+60.5) · D 19.3% · R 79.8%
- 2008→2024 swing
- -3.3pp toward R · 2008: -57.3pp · 2024: -60.5pp
- All cycles
- 2024: R+60.5 2020: R+56.6 2016: R+55.2 2012: R+61.5 2008: R+57.3
Not yet ingested
- Civics
- —
Market trends
- HPI YoY
- ▼ -250.72%
- Current HPI
- 224.6222
- Rent YoY
- ▼ -0.33%
- Metro
- Midland, TX
- State GDP YoY
- ▲ 3.95%
- F500 in state
- 110
Industry mix (Fortune 500 HQ in TX)
| Industry | F500 HQs | Revenue |
|---|---|---|
| Energy | 16 | $1,198B |
|
||
| Technology | 5 | $198B |
|
||
| Engineering / Construction | 4 | $72B |
|
||
| Energy Services | 3 | $60B |
|
||
| Utilities | 3 | $41B |
|
||
| Healthcare | 2 | $330B |
|
||
Price history
+256.9% since first listed8 events — show timeline
- 2025-04-18 Pending — PBBOR
- 2025-04-15 Relisted — PBBOR
- 2025-04-15 Price Changed $149,900 PBBOR
- 2025-04-01 Pending — PBBOR
- 2025-03-30 Listed $179,900 PBBOR
- 2000-12-29 Sold (Public Records) — Public Records
- 2000-12-22 Sold (MLS) — ODMLS
- 2000-09-25 Listed $42,000 ODMLS
Property tax history
+2.1%/yrLatest (2025): $2,473 · +3.1% YoY. Source: county tax records.
Cash-flow waterfall
monthlySold comps — $/sqft
last 12 mo · ≤1 miLoading sold comps…