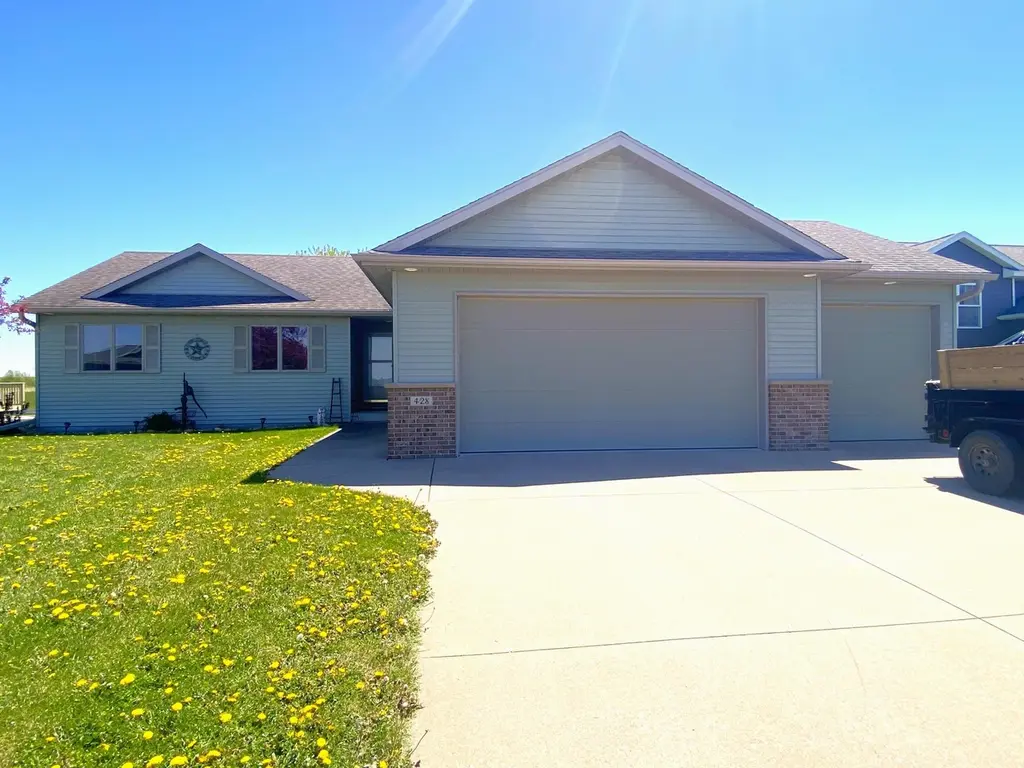
428 6th Ct SE · Dover, MN
Flood risk 1/10 · Minimal
- FEMA flood zone
- X (unshaded)
- Chance of flooding over 30 yrs
- 0.0%
- Est. flood insurance / yr
- $473 – $860
Fire risk 1/10 · Minimal
- Est. fire insurance / yr
- $888 – $1,650
Heat risk 2/10 · Minimal
- Hot days now (above 98°F)
- 7 days/yr
- Hot days in 30 yrs
- 15 days/yr
Wind risk 2/10 · Minimal
- Chance of severe wind over 30 yrs
- —
Air-quality risk 1/10 · Minimal
- Unhealthy air days now
- 0 days/yr
- Unhealthy air days in 30 yrs
- 0 days/yr
Risk factors via First Street. Map © Google.
Why this score? — see what drove the D- grade
The composite is a weighted blend of 9 inputs, each scored 0–100. Each bar is that input's sub-score; the figure is the points it added to the 100-point composite (weight × sub-score).
- Appreciation +10.0/10.0
- ARV discount +7.5/15.0
- Cash flow +6.7/30.0
- Schools +4.6/10.0
- Livability +3.4/5.0
- Rent growth +2.5/5.0
- Condition / age +2.5/5.0
- 1% rule +1.7/10.0
- DSCR +1.0/10.0
$184,000
🖨 Deal sheet 📄 Offer letter ✓ Due diligence
Listing remarks MLS
Move-in ranch home has 3 bedrooms and 3 car garage. Open floor plan with all you need on one level. Master bedroom walk-in closet. Nice deck for entertaining leads to a spacious backyard. Short drive to Rochester or Winona to commute. Property in First Homes Community Land Trust.
Key facts
- 0.24 acre lot
- 3 garage spots
- Built 2006
Property features AI
Finance
- Other: Lot size about 0.24 acres (dimensions approximately 79 x 130)
- Financial info: Land is leased with a lease payment of $25
Exterior
- Parking: Attached 3-car garage
- Utilities: City water connected; City sewer connected; Natural gas
- Home design: Residential property; Entry level: main level living; Facing direction not specified
- Construction: Shallow foundation area approximately 1,200; Above-grade finished area approximately 1,200; Below-grade area approximately 1,200; Total building area approximately 2,400
- Exterior features: Vinyl exterior
Interior
- Bedrooms: 3 bedrooms
- Bathrooms: 1 full bathroom
- Heating & cooling: Forced air heating; Central air conditioning
- Interior features: Unfinished basement; Block foundation; One level
Neighborhood map
What this means for you Summary
Snapshot
- This is a 3-bed/1.0-bath single-family listed at $184k.
Deal economics
- At list price, monthly cash flow is $-294 ($-4k/yr) — negative.
- To cash-flow at today's rent, offer at most $132k (28.2% below list).
- To meet the 1% rule (rent ≥ 1% of price), the offer needs to be $123k (33.3% below list).
- Recommended offer: $123k (33.3% below list) — sets the bar for 1% rule.
Location & tenants
- Location reads 68/100 on livability (#408 in MN) — a middle-class / working-renter tenant base. Strengths: employment A+, cost of living A+, housing A+; Watch: schools C-, amenities F, commute F.
- Dover-Eyota Public School District (rural): math 51% / reading 53% proficiency, ranked #76 of 301 in MN (top 25%) — acceptable for families but not a draw, mixed tenant base, ~2y average lease; only 14% free/reduced lunch — higher-income household profile.
- Market conditions: 2 active listings in the ZIP; 1,267 units permitted in Olmsted County in 2024 (915 in 5+ unit buildings).
Forward outlook
- In year one you build about $20k of equity ($1k loan paydown + $18k appreciation (10.0% local appreciation)).
- Olmsted County population projected at +16% by 2050 — long-run rental-demand tailwind backs the buy-and-hold thesis.
- By year 2, paydown + projected appreciation supports a ~$32k cash-out refi (75% LTV) — recoverable capital for the next deal without selling this one.
Negotiation context
- Only 2 days on market — expect competitive offers; lowballing is unlikely to land.
- 4 sale attempts since 16y ago with the ask held roughly flat each time — persistent listings suggest the price (not the market) is what's stuck; bring a comps-based counter.
Questions for the listing agent
- What do current leases actually rent for vs. the listed asking? Can we see a recent rent roll and the last 12 months of T-12 income?
- Is there a deadline driving the sale (1031 exchange, divorce, estate, relocation)? That informs how much negotiation room exists.
- The area grade is low — what's the realistic commute time and amenity access for the typical tenant pool here? Any planned neighborhood developments (good or bad) we should know about?
- What's the average days-on-market for RENTAL listings here right now (not sales)? A rising rental-DOM trend means longer vacancies and softer asking-rent achievability than the comps imply.
- What's the recent tenant-quality profile in this submarket — average credit score on applications, eviction rate, late-payment / NSF rate, and stable-employment percentage? A property-management company in the area should have these aggregated.
- How much new for-sale + rental construction is in the pipeline within 1–3 miles? Heavy new supply typically softens prices + rents 12–24 months out; constrained supply supports both.
Investment metrics
- 1% rule
- 0.67% ✗
- Cap rate
- 4.37%
- Cash-on-cash
- -6.85%
- DSCR
- 0.70
- GRM
- 12.5
CMA / ARV
No comps found within radius.
Projected returns pro-forma
10.0% appreciation · 3.0% rent growth · sell at horizon
- IRR
- 19.4%
- Equity multiple
- 2.58×
- Total profit
- $81,492
- Equity at exit
- $165,762
- IRR
- 17.9%
- Equity multiple
- 5.94×
- Total profit
- $254,739
- Equity at exit
- $357,472
Cash invested: $51,520 (down + closing). Projections, not guarantees.
Landlord ↔ Tenant lean methodology
- Overall (STATE)
- 46 Balanced
- State Minnesota
- 46 Balanced · D+2
- County
- — inherits STATE
- City
- — inherits STATE
ZIP-level market 55929
- Home prices YoY
- 10.2%
- Active inventory
- 2
- Price-to-rent
- 12.5×
Monthly cashflow live
- Estimated rent
- $1,227 medium interval (Pro) →
- Mortgage (P&I)
- −$965
- Tax from tax record
- −$222 /mo · $2,664/yr
- Insurance
- −$77
- HOA
- −$0
- Vacancy / Maint / Mgmt
- −$258
- Net cashflow
- $-294
Break-even live
UW: 25.0% down · 7.5% · 30yr · 1.5% tax · 5.0% vac · 8.0% maint · 8.0% mgmt
Financing live
Cash to close
- Down payment
- $46,000
- Closing costs
- $5,520
- Reserves months
- —
- Total cash needed
- —
Loan-product check · same deal, 3 products live
Conventional
25% down · 7.5% · 30yr
- Down + closing
- —
- Monthly P&I
- —
- Monthly cashflow
- —
- DSCR
- —
- Eligible?
- —
Personal DTI + credit; lowest rate.
DSCR
20% down · 8.5% · 30yr
- Down + closing
- —
- Monthly P&I
- —
- Monthly cashflow
- —
- DSCR
- —
- Eligible?
- —
No personal income docs; deal must DSCR.
Hard money
10% down · 12.0% · 12mo
- Down + closing
- —
- Monthly P&I
- —
- Monthly cashflow
- —
- DSCR
- —
- Eligible?
- —
Short-term bridge; refi at stabilization.
Listing history 3 events
-
2026-06-05statusdays on market $184,000 Pending 2 DOM
-
2026-06-03remarks 141-char remark
-
2026-06-03$184,000 Active 1 DOM
ⓘ Source: listings_history table (triggers on properties + properties_extension) + one-shot
backfill from property_details.listing_events for pre-trigger history.
Tax reassessment forecast MN · Partial reset (capped growth)
- Current annual tax
- $2,664 · $222/mo
- Projected year-2 tax
- $2,664 · $222/mo
- Expected delta
- $0/yr ($0/mo · 0.0%)
ⓘ Screening estimate from a state-policy table — verify with the county assessor before closing.
Climate risk First Street
- Flood 1/10 Low FEMA zone X (unshaded) · 0% chance over 30 yrs
- Wildfire 1/10 Low
- Heat 2/10 Low 7 d/yr ≥98°F today · 15 d/yr by 30 yrs out
- Wind 2/10 Low
- Air quality 1/10 Low 0 unhealthy d/yr today · 0 by 30 yrs out
Nearby sold comps map
Loading sold comps map…
Walkable amenities ~0.75 mi
Loading nearby amenities…
Taxation est. · year 1
- Rental income
- $14,726
- − Mortgage interest
- −$10,307
- − Property taxes
- −$2,664
- − Insurance
- −$920
- − Repairs & maintenance
- −$1,178
- − Management
- −$1,178
- − Depreciation
- −$5,353
- Taxable loss
- −$6,874
- Est. tax savings @ 24.0%
- +$1,650
- After-tax cash flow
- $-1,880/yr
For passive investors: Depreciation is non-cash, so a rental often shows a tax loss while cash-flowing — sheltering income. Rental losses are passive: they offset passive income freely, and up to $25,000/yr can offset ordinary (W-2) income if you actively participate and your MAGI is under $100k (phasing out to $0 by $150k); unused losses carry forward. On sale, claimed depreciation is recaptured at up to 25%, and gains may owe capital-gains tax (a 1031 exchange can defer both). Figures are a year-1 estimate at your 24.0% rate — not tax advice; consult a CPA.
Schools (NCES district)
- District
- Dover-Eyota Public School District
- NCES district ID
- 2711010
- Math proficiency
- 51% ▼ -14.00%
- Reading proficiency
- 53% ▼ -10.00%
- Median HH income
- $69,529
- Composite
- 46.31/100
- National rank
- #2473
- State rank
- #76 of 301 in MN
Livability — Dover
- Score
- 68/100
- State rank
- #408
- US rank
- #9527
Category grades
Schools grade is shown separately in the Schools card above.
Census & demographics
- Census place
- Dover, MN
- Population (ZIP)
- 1,348
Population outlook (Olmsted County) Hauer SSP2
- Today (2025)
- 165,999 people
- By 2030
- 172,425 · +3.9%
- By 2040
- 183,785 · +10.7%
- By 2050
- 192,981 · +16.3%
- By 2075
- 215,284 · +29.7%
- By 2100
- 224,887 · +35.5%
Race, ethnicity, and origin ACS 2023
- Neighborhood character
- Predominantly White (89%)
- Race & ethnicity
- White 89% Two or more races 8% Hispanic / Latino 8%
- Hispanic origin (detail)
- Mexican 7%
- Common ancestry
- Portuguese 14% Romanian 3% Italian 2%
- Foreign-born
- 2% · Canada
- Languages at home
- 93% English-only · Spanish 7% Other Asian/Pacific 1%
Political lean MEDSL · Olmsted
- 2024 margin
- D (+10.7) · D 54.3% · R 43.6% · Other 2.1%
- 2008→2024 swing
- +7.4pp toward D · 2008: 3.3pp · 2024: 10.7pp
- All cycles
- 2024: D+10.7 2020: D+10.7 2016: D+0.8 2012: D+3.2 2008: D+3.3
Not yet ingested
- Civics
- —
Market trends
- HPI YoY
- ▲ 24.49%
- Current HPI
- 265.758
- Rent YoY
- —
- Metro
- —
- State GDP YoY
- ▲ 2.41%
- F500 in state
- 34
Industry mix (Fortune 500 HQ in MN)
| Industry | F500 HQs | Revenue |
|---|---|---|
| Healthcare | 2 | $407B |
|
||
| Retail | 2 | $150B |
|
||
| Consumer Goods | 2 | $32B |
|
||
| Industrial Machinery | 2 | $6B |
|
||
| Agriculture | 1 | $40B |
|
||
| Healthcare / Medical Devices | 1 | $32B |
|
||
Price history
+360.0% since first listed12 events — show timeline
- 2026-06-02 Listed $184,000 NORTHSTARMLS as Distributed by MLS Grid
- 2020-06-15 Sold (MLS) $213,000 NORTHSTARMLS as Distributed by MLS Grid
- 2020-05-13 Pending — NORTHSTARMLS as Distributed by MLS Grid
- 2020-05-10 Contingent — NORTHSTARMLS as Distributed by MLS Grid
- 2020-05-07 Listed $144,900 NORTHSTARMLS as Distributed by MLS Grid
- 2018-12-11 Listing Removed — NORTHSTARMLS as Distributed by MLS Grid
- 2010-09-10 Sold (MLS) $165,000 NORTHSTARMLS as Distributed by MLS Grid
- 2010-09-10 Sold (MLS) $165,000 NORTHSTARMLS as Distributed by MLS Grid
- 2010-06-15 Listed $129,000 NORTHSTARMLS as Distributed by MLS Grid
- 2010-06-15 Listed $129,000 NORTHSTARMLS as Distributed by MLS Grid
- 2007-01-03 Sold (Public Records) $108,461 Public Records
- 2007-01-03 Sold (Public Records) $40,000 Public Records
Property tax history
+1.6%/yrLatest (2025): $2,664 · -21.5% YoY. Source: county tax records.
Cash-flow waterfall
monthlySold comps — $/sqft
last 12 mo · ≤1 miLoading sold comps…