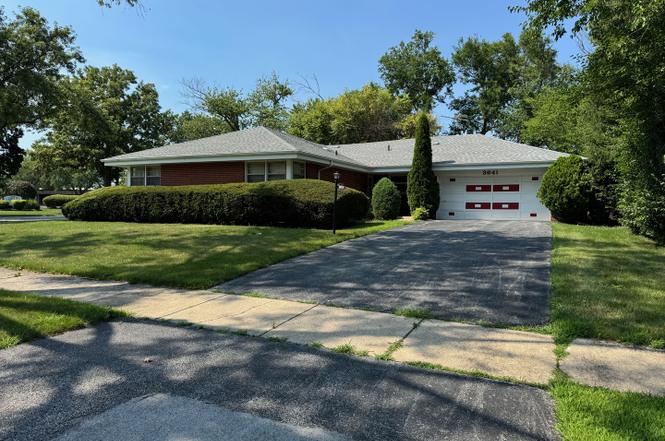
3641 W Beech St · Flossmoor, IL
Flood risk 1/10 · Minimal
- FEMA flood zone
- X (unshaded)
- Chance of flooding over 30 yrs
- 0.0%
- Est. flood insurance / yr
- $473 – $860
Fire risk 1/10 · Minimal
- Est. fire insurance / yr
- $804 – $1,492
Heat risk 3/10 · Minor
- Hot days now (above 101°F)
- 7 days/yr
- Hot days in 30 yrs
- 15 days/yr
Wind risk 2/10 · Minimal
- Chance of severe wind over 30 yrs
- —
Air-quality risk 2/10 · Minimal
- Unhealthy air days now
- 1 days/yr
- Unhealthy air days in 30 yrs
- 1 days/yr
Risk factors via First Street. Map © Google.
Why this score? — see what drove the D+ grade
The composite is a weighted blend of 9 inputs, each scored 0–100. Each bar is that input's sub-score; the figure is the points it added to the 100-point composite (weight × sub-score).
- Cash flow +14.5/30.0
- ARV discount +11.2/15.0
- 1% rule +4.9/10.0
- DSCR +4.4/10.0
- Livability +4.0/5.0
- Rent growth +2.5/5.0
- Condition / age +2.5/5.0
- Schools +2.4/10.0
- Appreciation +0.0/10.0
$259,871
🖨 Deal sheet (PDF) 📄 Offer letter ✓ Due diligence
Listing remarks
Quality-Built, All-Brick Ranch on a Prime Corner Lot! This well-maintained, all-face brick ranch offers everything on one convenient level. Featuring 3 spacious bedrooms and 2 full baths, it's the perfect home for comfortable living. Enjoy a generous living room with oversized windows and a cozy fireplace, ideal for relaxing or entertaining. The bright kitchen opens to a dinette area and adjoining family room for easy everyday living. Additional highlights include main level laundry, a secure attached 2.5-car garage, newer furnace and central air, aluminum gutters and soffits, and a newer water heater. Outstanding corner location-don't miss this one! Although this home was very well maint
Key facts
- Bright kitchen
- All brick ranch
- Prime corner lot
Tags
Property features AI
Finance
- Other: Living area per assessor
- HOA & community: No master association fee required; Neighborhood features: park, curbs, sidewalks, street lights, paved streets
Exterior
- Parking: Attached garage (2 spaces, owned); Two total parking spaces
- Utilities: Water from Lake Michigan; Public sewer; Electric and gas available (natural gas heating)
- Home design: Detached single-family ranch; One-story; Fee simple ownership; Disability access/equipped; Built before 1978
- Construction: Brick construction; Asphalt roof; Age: approximately 61–70 years
- Exterior features: Patio; Landscaped yard; Corner lot (70 x 135)
Interior
- Kitchen: Eating area/table space; Range; Dishwasher; Refrigerator
- Bedrooms: Master bedroom on main level (15 x 14); Bedroom 2 on main level (14 x 12); Bedroom 3 on main level (11 x 11)
- Flooring: Hardwood flooring (general); Carpet in living areas and bedrooms; Vinyl in kitchen and laundry; Slate in foyer
- Bathrooms: Two full bathrooms
- Heating & cooling: Natural gas forced-air heating; Central air conditioning
- Interior features: Open floorplan; Built-in features; First-floor bedroom; First-floor full bath; Crawl space basement; Six total rooms
- Laundry & utility: Main-level laundry (19 x 6); Washer; Dryer
Neighborhood map
What this means for you Summary
Snapshot
- This is a 3-bed/2.5-bath single-family listed at $260k.
Deal economics
- At list price, monthly cash flow is $59 ($708/yr) — positive.
- The deal already cash-flows at list — no discount required.
- To meet the 1% rule (rent ≥ 1% of price), the offer needs to be $257k (1.2% below list).
- Recommended offer: $229k (12.0% below list) — sets the bar for market timing.
- Cap rate 6.6% vs local median 4.3% in Flossmoor — top-decile yield for the area; either an underpriced asset or a hidden risk that comps aren't pricing in. Stress-test before assuming the spread holds.
Location & tenants
- Location reads 80/100 on livability (#107 in IL, #1,718 nationally) — a professional / high-income tenant draw. Strengths: employment A+, housing A+, crime B+; Watch: cost of living D, amenities F.
- Homewood Flossmoor Chsd 233 (suburban): math 21% / reading 27% proficiency, ranked #272 of 620 in IL (top 44%) — low school quality limits family demand, transient renter base, plan for 1-2y turnover.
- Zoned schools: Flossmoor Hills Elem School (math 22% / reading 27%, grade F, #850 of 2,056 statewide, top 45%, 340 students, 0% FRL); Parker Junior High School (math 16% / reading 21%, grade F, #438 of 665 statewide, top 67%, 858 students, 0% FRL); Homewood-Flossmoor High School (math 21% / reading 27%, grade F, #304 of 693 statewide, top 44%, 2,798 students, 0% FRL).
- Market conditions: 95 active listings in the ZIP; 10 comparable units currently listed for rent nearby; rentals leasing fast (median 0d on market — plan ~1-2 weeks tenant-placement turnaround); 6,272 units permitted in Cook County in 2024 (4,658 in 5+ unit buildings).
Forward outlook
- Local home prices are declining (-3.0%/yr); year-one equity from $2k of loan paydown is wiped out by about $8k of value loss. Plan a longer hold.
Negotiation context
- It's been on market 312 days — a 12% lower offer ($229k) is reasonable based on typical stale-listing flexibility.
Questions for the listing agent
- It's been on market 312 days. Have you received any prior offers? Is the seller open to a 12% concession, seller financing, or rate buy-down credit?
- Built in 1960 — when were the roof, HVAC, electrical panel, plumbing, and water heater last replaced?
- Why hasn't it sold? Are there any deal-killer items the seller is aware of (foundation, flood, title, zoning, code violations)?
- Is there a deadline driving the sale (1031 exchange, divorce, estate, relocation)? That informs how much negotiation room exists.
- Schools are B-rated — typically a magnet for longer-tenancy family renters. What's the average tenant stay here, and is there a school-zone premium baked into asking?
- The area grade is low — what's the realistic commute time and amenity access for the typical tenant pool here? Any planned neighborhood developments (good or bad) we should know about?
- What's the average days-on-market for RENTAL listings here right now (not sales)? A rising rental-DOM trend means longer vacancies and softer asking-rent achievability than the comps imply.
- What's the recent tenant-quality profile in this submarket — average credit score on applications, eviction rate, late-payment / NSF rate, and stable-employment percentage? A property-management company in the area should have these aggregated.
- How much new for-sale + rental construction is in the pipeline within 1–3 miles? Heavy new supply typically softens prices + rents 12–24 months out; constrained supply supports both.
Investment metrics
- 1% rule
- 0.99% ✗
- Cap rate
- 6.57%
- Cash-on-cash
- 0.97%
- DSCR
- 1.04
- GRM
- 8.4
CMA / ARV
- ARV (on-the-fly)
- $283,014
- Comps found
- 12
Show comp detail 12 sales within ~0.75 mi
| Address | Dist | Beds/Ba | Sqft | Sold | Price | $/sf | Match |
|---|---|---|---|---|---|---|---|
| 3641 W Beech St | 0.00mi | 3/2.0 | 1,747 (0%) | 0mo | $255,700 | $146 | 98 |
| 809 Elm St | 0.05mi | 4/2.5 (+1) | 1,851 (+6%) | 1mo | $349,900 | $189 | 82 |
| 754 Ash St | 0.04mi | 4/2.5 (+1) | 1,835 (+5%) | 11mo | $200,000 | $109 | 76 |
| 1034 Central Park Ave | 0.31mi | 4/2.0 (+1) | 1,800 (+3%) | 1mo | $255,000 | $142 | 73 |
| 3645 Elm Ct | 0.24mi | 3/2.0 | 1,827 (+5%) | 12mo | $296,225 | $162 | 70 |
| 18921 Oakwood Ct | 0.45mi | 3/2.0 | 1,752 (+0%) | 9mo | $245,000 | $140 | 69 |
| 712 Central Park Ave | 0.14mi | 3/1.5 | 1,622 (-7%) | 11mo | $199,900 | $123 | 69 |
| 18711 Oakwood Ave | 0.44mi | 3/1.5 | 1,690 (-3%) | 8mo | $260,000 | $154 | 64 |
| 4117 186th Pl | 0.57mi | 3/2.0 | 1,752 (+0%) | 9mo | $294,000 | $168 | 63 |
| 4008 192nd Pl | 0.72mi | 3/2.5 | 1,657 (-5%) | 2mo | $325,000 | $196 | 56 |
| 4215 188th St | 0.66mi | 3/2.0 | 1,529 (-12%) | 5mo | $267,000 | $175 | 42 |
| 4211 190th Pl | 0.74mi | 3/2.0 | 1,560 (-11%) | 10mo | $267,732 | $172 | 37 |
Match score weights: distance 35% · size 25% · config 20% · recency 20%. Top-matched comps best support the ARV.
Projected returns pro-forma
-3.0% appreciation · 3.0% rent growth · sell at horizon
- IRR
- -14.7%
- Equity multiple
- 0.47×
- Total profit
- $-38,205
- Equity at exit
- $38,748
- IRR
- -5.9%
- Equity multiple
- 0.62×
- Total profit
- $-27,838
- Equity at exit
- $22,469
Cash invested: $72,764 (down + closing). Projections, not guarantees.
Landlord ↔ Tenant lean methodology
- Overall (STATE)
- 43 Moderately Tenant-Leaning
- State Illinois
- 43 Moderately Tenant-Leaning · D+7
- County
- — inherits STATE
- City
- — inherits STATE
ZIP-level market 60422
- Home prices YoY
- -26.3%
- Active inventory
- 95
- Price-to-rent
- 8.4×
Monthly cashflow live
- Estimated rent
- $2,567 high interval (Pro) →
- Mortgage (P&I)
- −$1,363
- Tax from tax record
- −$498 /mo · $5,973/yr
- Insurance
- −$108
- HOA
- −$0
- Vacancy / Maint / Mgmt
- −$539
- Net cashflow
- $59
Break-even live
Sensitivity live
| Price | -10% $206 | -5% $133 | +0% $59 | +5% $-15 | +10% $-88 |
|---|---|---|---|---|---|
| Rent | -10% $-144 | -5% $-42 | +0% $59 | +5% $160 | +10% $262 |
| Rate | -1.0pp $190 | -0.5pp $125 | base $59 | +0.5pp $-8 | +1.0pp $-77 |
UW: 25.0% down · 7.5% · 30yr · 1.5% tax · 5.0% vac · 8.0% maint · 8.0% mgmt
Financing live
Cash to close
- Down payment
- $64,968
- Closing costs
- $7,796
- Reserves months
- —
- Total cash needed
- —
Loan-product check · same deal, 3 products live
Conventional
25% down · 7.5% · 30yr
- Down + closing
- —
- Monthly P&I
- —
- Monthly cashflow
- —
- DSCR
- —
- Eligible?
- —
Personal DTI + credit; lowest rate.
DSCR
20% down · 8.5% · 30yr
- Down + closing
- —
- Monthly P&I
- —
- Monthly cashflow
- —
- DSCR
- —
- Eligible?
- —
No personal income docs; deal must DSCR.
Hard money
10% down · 12.0% · 12mo
- Down + closing
- —
- Monthly P&I
- —
- Monthly cashflow
- —
- DSCR
- —
- Eligible?
- —
Short-term bridge; refi at stabilization.
Rent comps 10 comps
| Address | Beds | Baths | Sqft | Rent | $/sqft | DOM | Units | Dist |
|---|---|---|---|---|---|---|---|---|
| 4453 Provincetown Dr Country Club Hills, IL | 3.0 | 2.5 | 1300 | $2,500 | $1.92 | 0d | 1 | 0.54mi |
| 1153 Williamsburg Rd Country Club Hills, IL | 2.0 | 1.5 | 1216 | $1,900 | $1.56 | 0d | 1 | 0.65mi |
| 4193 186th St Country Club Hills, IL | 4.0 | 2.5 | 1704 | $3,200 | $1.88 | 0d | 1 | 0.68mi |
| 18960 Keeler Ave Country Club Hills, IL | 4.0 | 2.0 | 1537 | $2,650 | $1.72 | 3d | 1 | 0.68mi |
| 18960 Keeler Ave Country Club Hills, IL | 4.0 | 2.0 | 1537 | $2,650 | $1.72 | 0d | 1 | 0.68mi |
| 2256 Windsor Ln Country Club Hills, IL | 3.0 | 1.0 | 1212 | $2,250 | $1.86 | 0d | 1 | 0.75mi |
| 3515 Bordeaux Ct Hazel Crest, IL | 4.0 | 2.0 | 1486 | $2,900 | $1.95 | 3d | 1 | 0.89mi |
| 3212 Charlemagne Ave Hazel Crest, IL | 3.0 | 2.5 | 1412 | $2,650 | $1.88 | 0d | 1 | 1.12mi |
| 18019 Ravisloe Ter Country Club Hills, IL | 3.0 | 1.5 | 1150 | $2,800 | $2.43 | 0d | 1 | 1.15mi |
| 2817 Sunset Ave Flossmoor, IL | 3.0 | 1.5 | 1648 | $1,900 | $1.15 | 26d | 1 | 1.17mi |
Listing history 10 events
-
2026-06-08statusdays on market $259,871 Pending 312 DOM
-
2026-06-07days on market $259,871 Active 311 DOM
-
2026-06-04days on market $259,871 Active 308 DOM
-
2026-06-03days on market $259,871 Active 307 DOM
-
2026-06-02days on market $259,871 Active 306 DOM
-
2026-06-01days on market $259,871 Active 305 DOM
-
2026-05-31days on market $259,871 Active 304 DOM
-
2026-01-21price $259,871
-
2025-09-04price $264,777
-
2025-07-30$269,500 Active
ⓘ Source: listings_history table (triggers on properties + properties_extension) + one-shot
backfill from property_details.listing_events for pre-trigger history.
Tax reassessment forecast IL · Partial reset (capped growth)
- Current annual tax
- $5,973 · $498/mo
- Projected year-2 tax
- $5,973 · $498/mo
- Expected delta
- $0/yr ($0/mo · 0.0%)
ⓘ Screening estimate from a state-policy table — verify with the county assessor before closing.
Climate risk First Street
- Flood 1/10 Low FEMA zone X (unshaded) · 0% chance over 30 yrs
- Wildfire 1/10 Low
- Heat 3/10 Moderate 7 d/yr ≥101°F today · 15 d/yr by 30 yrs out
- Wind 2/10 Low
- Air quality 2/10 Low 1 unhealthy d/yr today · 1 by 30 yrs out
Nearby sold comps map
Loading sold comps map…
Walkable amenities ~0.75 mi
Loading nearby amenities…
Taxation est. · year 1
- Rental income
- $30,802
- − Mortgage interest
- −$14,557
- − Property taxes
- −$5,973
- − Insurance
- −$1,299
- − Repairs & maintenance
- −$2,464
- − Management
- −$2,464
- − Depreciation
- −$7,560
- Taxable loss
- −$3,515
- Est. tax savings @ 24.0%
- +$844
- After-tax cash flow
- $1,552/yr
For passive investors: Depreciation is non-cash, so a rental often shows a tax loss while cash-flowing — sheltering income. Rental losses are passive: they offset passive income freely, and up to $25,000/yr can offset ordinary (W-2) income if you actively participate and your MAGI is under $100k (phasing out to $0 by $150k); unused losses carry forward. On sale, claimed depreciation is recaptured at up to 25%, and gains may owe capital-gains tax (a 1031 exchange can defer both). Figures are a year-1 estimate at your 24.0% rate — not tax advice; consult a CPA.
Schools (NCES district)
- District
- Homewood Flossmoor Chsd 233
- NCES district ID
- 1719560
- Math proficiency
- 21% ▼ -15.00%
- Reading proficiency
- 27% ▼ -13.00%
- Median HH income
- $83,564
- Composite
- 24.42/100
- National rank
- #7681
- State rank
- #272 of 620 in IL
Livability — Flossmoor
- Score
- 80/100
- State rank
- #107
- US rank
- #1718
Category grades
Schools grade is shown separately in the Schools card above.
Census & demographics
- Census place
- Flossmoor, IL
- City population
- 9,885
- Population (ZIP)
- 9,885
Population outlook (Cook County) Hauer SSP2
- Today (2025)
- 5,347,519 people
- By 2030
- 5,357,703 · +0.2%
- By 2040
- 5,324,924 · -0.4%
- By 2050
- 5,230,762 · -2.2%
- By 2075
- 4,785,735 · -10.5%
- By 2100
- 4,188,836 · -21.7%
Race, ethnicity, and origin ACS 2023
- Neighborhood character
- Majority Black (63%)
- Race & ethnicity
- Black 63% White 28% Hispanic / Latino 5% Two or more races 4% Asian 2%
- Common ancestry
- Iranian 3% Romanian 3% Portuguese 2%
- Foreign-born
- 5% · Canada
- Languages at home
- 92% English-only · Spanish 4% Other Asian/Pacific 2% Other Indo-European 1%
Political lean MEDSL · Cook
- 2024 margin
- Solid D (+42.0) · D 70.4% · R 28.4% · Other 1.2%
- 2008→2024 swing
- -11.4pp toward R · 2008: 53.4pp · 2024: 42.0pp
- All cycles
- 2024: D+42.0 2020: D+50.3 2016: D+53.0 2012: D+49.4 2008: D+53.4
Not yet ingested
- Civics
- —
Market trends
- HPI YoY
- ▼ -67.78%
- Current HPI
- 189.5534
- Rent YoY
- —
- Metro
- —
- State GDP YoY
- ▲ 1.59%
- F500 in state
- 60
Industry mix (Fortune 500 HQ in IL)
| Industry | F500 HQs | Revenue |
|---|---|---|
| Insurance | 4 | $201B |
|
||
| Consumer Goods | 4 | $87B |
|
||
| Industrial Machinery | 3 | $64B |
|
||
| Healthcare | 2 | $55B |
|
||
| Retail / Pharmacy | 1 | $148B |
|
||
| Agriculture / Food | 1 | $86B |
|
||
Price history
-3.6% since first listed3 events — show timeline
- 2026-01-21 Price Changed $259,871 MRED as Distributed by MLS Grid
- 2025-09-04 Price Changed $264,777 MRED as Distributed by MLS Grid
- 2025-07-30 Listed $269,500 MRED as Distributed by MLS Grid
Property tax history
+0.7%/yrLatest (2023): $5,973 · +43.0% YoY. Source: county tax records.
Cash-flow waterfall
monthlySold comps — $/sqft
last 12 mo · ≤1 miLoading sold comps…