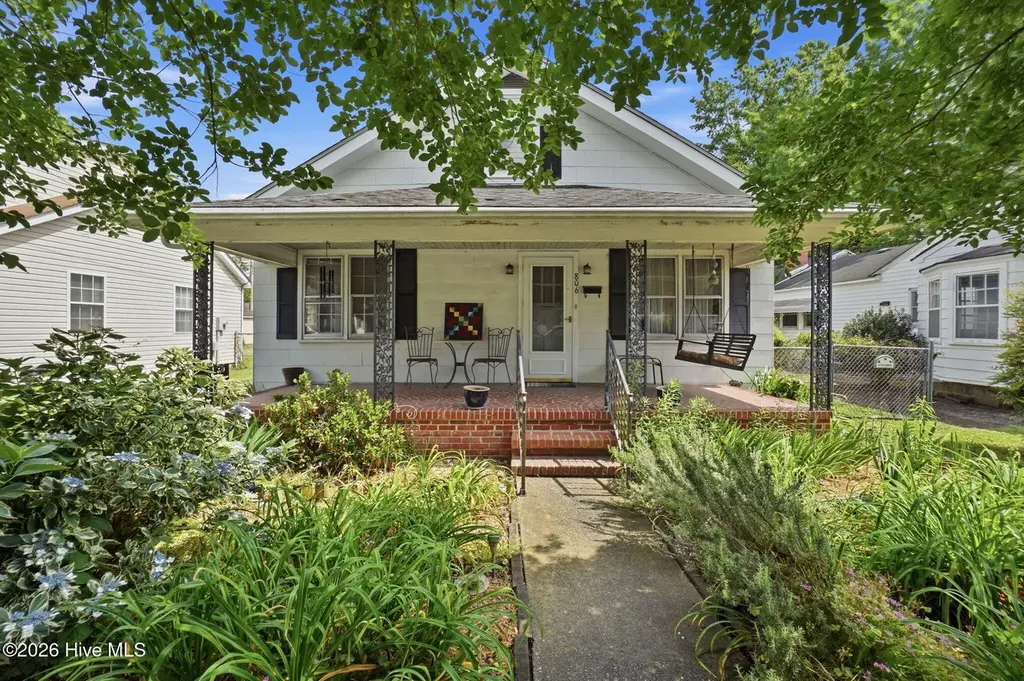
806 Maple St · Elizabeth City, NC
Flood risk 8/10 · Major
- FEMA flood zone
- X (unshaded)
- Chance of flooding over 30 yrs
- 0.97%
- Est. flood insurance / yr
- $507 – $1,088
Fire risk 3/10 · Minor
- Est. fire insurance / yr
- $906 – $1,684
Heat risk 9/10 · Severe
- Hot days now (above 107°F)
- 7 days/yr
- Hot days in 30 yrs
- 17 days/yr
Wind risk 8/10 · Major
- Chance of severe wind over 30 yrs
- 99.0%
Air-quality risk 1/10 · Minimal
- Unhealthy air days now
- 0 days/yr
- Unhealthy air days in 30 yrs
- 0 days/yr
Risk factors via First Street. Map © Google.
Why this score? — see what drove the C- grade
The composite is a weighted blend of 9 inputs, each scored 0–100. Each bar is that input's sub-score; the figure is the points it added to the 100-point composite (weight × sub-score).
- Cash flow +22.1/30.0
- ARV discount +7.5/15.0
- DSCR +7.1/10.0
- 1% rule +5.1/10.0
- Livability +3.6/5.0
- Rent growth +3.5/5.0
- Condition / age +2.5/5.0
- Schools +2.4/10.0
- Appreciation +0.0/10.0
$157,500
🖨 Deal sheet 📄 Offer letter ✓ Due diligence
Listing remarks
Wonderful cottage with 1384 square feet on first floor and 374 attic space on second floor walkable. Wood floors, arched doorway between LR and DR, large kitchen, nice pantry with washer and dryer in place. 2 BR with bonus room in between could be used as nursery, office or anything you like. Small den at back of house with gas logs vented fireplace, a place for enjoying a book! Shed in fenced back yard with alley behind for access to back yard or parking in back on the lot if desired. Lots of flowers and herbs planted with love over the past years! Nice, covered front porch with tiled floor. Two stately Crepe Myrtle trees adorn the front sidewalk for cooling shade.
Key facts
- Wood floors
- Large kitchen
- Arched doorway
Tags
Property features AI
Exterior
- Parking: On-street parking; Off-street parking; No garage; Concrete surfaces
- Security: Smoke detector(s)
- Utilities: Public water; Public sewer; Natural gas connected; Water connected; Sewer connected; Cable available
- Home design: Single-family residence; One story; Entry level: 4
- Construction: Asbestos and frame construction; Brick/mortar foundation; Asbestos shingle / shingle / composition roof; Built with crawl space
- Exterior features: Outdoor grill; Covered front porch; Storm door(s); Chain link fenced backyard; Shed(s); Has a view
Interior
- Kitchen: Electric range; Refrigerator; Pantry
- Bedrooms: Master downstairs
- Flooring: Vinyl flooring; Wood flooring
- Bathrooms: 1 full bathroom
- Heating & cooling: Natural gas heating; Central air conditioning
- Interior features: Master bedroom on the main floor; Ceiling fan(s); Pantry; Storm windows; Gas log fireplace
- Laundry & utility: Washer; Dryer; Washer hookup; Dedicated laundry room; Gas water heater; Tankless water heater
Neighborhood map
What this means for you Summary
Snapshot
- This is a 3-bed/1.0-bath other listed at $158k.
Deal economics
- At list price, monthly cash flow is $187 ($2k/yr) — positive.
- The deal already cash-flows at list — no discount required.
- Meets the 1% rule at list price ($2k rent vs $158k).
- Cap rate 8.2% vs local median 2.9% in Elizabeth City — top-decile yield for the area; either an underpriced asset or a hidden risk that comps aren't pricing in. Stress-test before assuming the spread holds.
Location & tenants
- Location reads 71/100 on livability (#119 in NC) — a middle-class / working-renter tenant base. Strengths: cost of living A+, housing A+, health & safety A+; Watch: crime D+, commute F, employment F.
- Elizabeth City-Pasquotank Public Schools (rural): math 21% / reading 34% proficiency, ranked #152 of 178 in NC (top 85%) — low school quality limits family demand, transient renter base, plan for 1-2y turnover.
- Zoned schools: Sheep-Harney Elementary (math 17% / reading 32%, grade F, #1,112 of 1,410 statewide, top 82%, 473 students, 99% FRL); Elizabeth City Middle (math 16% / reading 31%, grade F, #402 of 475 statewide, top 85%, 515 students, 99% FRL); Pasquotank County High (math 27% / reading 37%, grade F, #445 of 535 statewide, top 84%, 628 students, 100% FRL) — zoned schools average 99% FRL vs 56% district-wide (43 pts higher); higher-poverty schools than district average — tighter screening recommended.
- Market conditions: Rents rising fast (+4.0%/yr); 343 active listings in the ZIP; 1 comparable units currently listed for rent nearby; 153 units permitted in Pasquotank County in 2024 (0 in 5+ unit buildings).
Forward outlook
- Local home prices are declining (-3.0%/yr); year-one equity from $1k of loan paydown is wiped out by about $5k of value loss. Plan a longer hold.
- Pasquotank County population projected at -19% by 2050 — secular population decline; favor cash flow + early exit over multi-decade hold.
Negotiation context
- Only 3 days on market — expect competitive offers; lowballing is unlikely to land.
- Current owner paid $128k; 24% above their basis — modest negotiation headroom, anchor on the comps not their cost.
Risks & watch-outs
- Watch-outs: flood insurance adds $66/mo; built in 1948 — expect roof / HVAC / electrical / plumbing capex.
- Climate carrying-cost: severe flood risk; severe wind risk, 99% chance of damaging wind over 30y; extreme-heat days projected 7→17/yr by 2055 (HVAC capex compounding) — expect insurance premiums to compound above CPI over the hold.
Questions for the listing agent
- Built in 1948 — when were the roof, HVAC, electrical panel, plumbing, and water heater last replaced?
- What's the actual annual flood-insurance premium (NFIP or private), and is the property in a SFHA with mandatory coverage?
- Is there a deadline driving the sale (1031 exchange, divorce, estate, relocation)? That informs how much negotiation room exists.
- Schools are F-rated, which usually means shorter tenancies and higher turnover. Who's the typical renter profile here, and what's been the actual vacancy rate?
- Crime grade is D in this area — have there been break-ins, vandalism, or insurance claims at this property in the last 3 years? What carrier currently insures it and at what premium?
- What's the average days-on-market for RENTAL listings here right now (not sales)? A rising rental-DOM trend means longer vacancies and softer asking-rent achievability than the comps imply.
- What's the recent tenant-quality profile in this submarket — average credit score on applications, eviction rate, late-payment / NSF rate, and stable-employment percentage? A property-management company in the area should have these aggregated.
- How much new for-sale + rental construction is in the pipeline within 1–3 miles? Heavy new supply typically softens prices + rents 12–24 months out; constrained supply supports both.
Investment metrics
- 1% rule
- 1.01% ✓
- Cap rate
- 8.23%
- Cash-on-cash
- 6.91%
- DSCR
- 1.31
- GRM
- 8.3
CMA / ARV
No comps found within radius.
Projected returns pro-forma
-3.0% appreciation · 4.02% rent growth · sell at horizon
- IRR
- -7.3%
- Equity multiple
- 0.73×
- Total profit
- $-11,936
- Equity at exit
- $23,484
- IRR
- 3.6%
- Equity multiple
- 1.27×
- Total profit
- $11,892
- Equity at exit
- $13,618
Cash invested: $44,100 (down + closing). Projections, not guarantees.
Landlord ↔ Tenant lean methodology
- Overall (STATE)
- 85 Strongly Landlord-Friendly
- State North Carolina
- 85 Strongly Landlord-Friendly · R+3
- County
- — inherits STATE
- City
- — inherits STATE
ZIP-level market 27909
- Rents YoY
- 4.0%
- Active inventory
- 343
- Price-to-rent
- 8.3×
Monthly cashflow live
- Estimated rent
- $1,584 medium interval (Pro) →
- Mortgage (P&I)
- −$826
- Tax from tax record
- −$106 /mo · $1,276/yr
- Insurance
- −$66
- Flood insurance flood zone
- −$66 /mo · $798/yr
- HOA
- −$0
- Vacancy / Maint / Mgmt
- −$333
- Net cashflow
- $187
Break-even live
UW: 25.0% down · 7.5% · 30yr · 1.5% tax · 5.0% vac · 8.0% maint · 8.0% mgmt
Financing live
Cash to close
- Down payment
- $39,375
- Closing costs
- $4,725
- Reserves months
- —
- Total cash needed
- —
Loan-product check · same deal, 3 products live
Conventional
25% down · 7.5% · 30yr
- Down + closing
- —
- Monthly P&I
- —
- Monthly cashflow
- —
- DSCR
- —
- Eligible?
- —
Personal DTI + credit; lowest rate.
DSCR
20% down · 8.5% · 30yr
- Down + closing
- —
- Monthly P&I
- —
- Monthly cashflow
- —
- DSCR
- —
- Eligible?
- —
No personal income docs; deal must DSCR.
Hard money
10% down · 12.0% · 12mo
- Down + closing
- —
- Monthly P&I
- —
- Monthly cashflow
- —
- DSCR
- —
- Eligible?
- —
Short-term bridge; refi at stabilization.
Rent comps 1 comps
| Address | Beds | Baths | Sqft | Rent | $/sqft | DOM | Units | Dist |
|---|---|---|---|---|---|---|---|---|
| 805 Hunter St Elizabeth City, NC | 3.0 | 1.0 | 924 | $1,250 | $1.35 | 11d | 1 | 1.13mi |
Listing history 2 events
-
2026-05-26$157,500 Active
-
2006-08-10soldstatus $127,500
ⓘ Source: listings_history table (triggers on properties + properties_extension) + one-shot
backfill from property_details.listing_events for pre-trigger history.
Tax reassessment forecast NC · Resets to sale price
- Current annual tax
- $1,276 · $106/mo
- Projected year-2 tax
- $1,292 · $108/mo
- Expected delta
- +$16/yr (+$1/mo · 1.3%)
ⓘ Screening estimate from a state-policy table — verify with the county assessor before closing.
Climate risk First Street
- Flood 8/10 Severe FEMA zone X (unshaded) · 97% chance over 30 yrs
- Wildfire 3/10 Moderate
- Heat 9/10 Extreme 7 d/yr ≥107°F today · 17 d/yr by 30 yrs out
- Wind 8/10 Severe 99% chance of damaging wind over 30 yrs
- Air quality 1/10 Low 0 unhealthy d/yr today · 0 by 30 yrs out
Nearby sold comps map
Loading sold comps map…
Walkable amenities ~0.75 mi
Loading nearby amenities…
Taxation est. · year 1
- Rental income
- $19,013
- − Mortgage interest
- −$8,822
- − Property taxes
- −$1,276
- − Insurance
- −$1,585
- − Repairs & maintenance
- −$1,521
- − Management
- −$1,521
- − Depreciation
- −$4,582
- Taxable loss
- −$294
- Est. tax savings @ 24.0%
- +$70
- After-tax cash flow
- $2,319/yr
For passive investors: Depreciation is non-cash, so a rental often shows a tax loss while cash-flowing — sheltering income. Rental losses are passive: they offset passive income freely, and up to $25,000/yr can offset ordinary (W-2) income if you actively participate and your MAGI is under $100k (phasing out to $0 by $150k); unused losses carry forward. On sale, claimed depreciation is recaptured at up to 25%, and gains may owe capital-gains tax (a 1031 exchange can defer both). Figures are a year-1 estimate at your 24.0% rate — not tax advice; consult a CPA.
Schools (NCES district)
- District
- Elizabeth City-Pasquotank Public Schools
- NCES district ID
- 3703540
- Math proficiency
- 21% ▼ -7.00%
- Reading proficiency
- 34% ▼ -1.00%
- Median HH income
- $45,294
- Composite
- 23.63/100
- National rank
- #7847
- State rank
- #152 of 178 in NC
Livability — Elizabeth City
- Score
- 71/100
- State rank
- #119
- US rank
- #7304
Category grades
Schools grade is shown separately in the Schools card above.
Census & demographics
- Census place
- Elizabeth City, NC
- County
- Pasquotank County · 40,869 people
- City population
- 40,869
- Metro
- Elizabeth City, NC
- Population (ZIP)
- 40,869
- Household income
- $66,732
- Rent vs Own
- Severe rent burden
- 1160.0
Population outlook (Pasquotank County) Hauer SSP2
- Today (2025)
- 38,172 people
- By 2030
- 36,890 · -3.4%
- By 2040
- 33,845 · -11.3%
- By 2050
- 31,086 · -18.6%
- By 2075
- 27,191 · -28.8%
- By 2100
- 26,093 · -31.6%
Race, ethnicity, and origin ACS 2023
- Neighborhood character
- Diverse neighborhood (Simpson 0.59)
- Race & ethnicity
- White 54% Black 35% Hispanic / Latino 6% Two or more races 6% Asian 1%
- Hispanic origin (detail)
- Mexican 2% Puerto Rican 2%
- Common ancestry
- Slovak 2% Romanian 1% Lithuanian 1%
- Foreign-born
- 3% · Canada, Vietnam
- Languages at home
- 96% English-only · Spanish 2% Other Asian/Pacific 1% Vietnamese 1%
Political lean MEDSL · Pasquotank
- 2024 margin
- Toss-up / Even · D 47.1% · R 52.0%
- 2008→2024 swing
- -18.6pp toward R · 2008: 13.7pp · 2024: -4.9pp
- All cycles
- 2024: R+4.9 2020: D+0.3 2016: D+2.2 2012: D+15.9 2008: D+13.7
Not yet ingested
- Civics
- —
Market trends
- HPI YoY
- ▼ -141.03%
- Current HPI
- 164.7511
- Rent YoY
- ▲ 4.02%
- Metro
- Elizabeth City, NC
- State GDP YoY
- ▲ 3.28%
- F500 in state
- 26
Industry mix (Fortune 500 HQ in NC)
| Industry | F500 HQs | Revenue |
|---|---|---|
| Financial Services | 2 | $213B |
|
||
| Retail | 2 | $95B |
|
||
| Industrial Conglomerate | 1 | $38B |
|
||
| Metals / Steel | 1 | $35B |
|
||
| Utilities | 1 | $30B |
|
||
| Industrial Machinery | 1 | $19B |
|
||
Price history
+23.5% since first listed2 events — show timeline
- 2026-05-26 Listed $157,500 Hive MLS
- 2006-08-10 Sold (Public Records) $127,500 Public Records
Property tax history
+1.8%/yrLatest (2025): $1,276 · +3.9% YoY. Source: county tax records.
Cash-flow waterfall
monthlySold comps — $/sqft
last 12 mo · ≤1 miLoading sold comps…