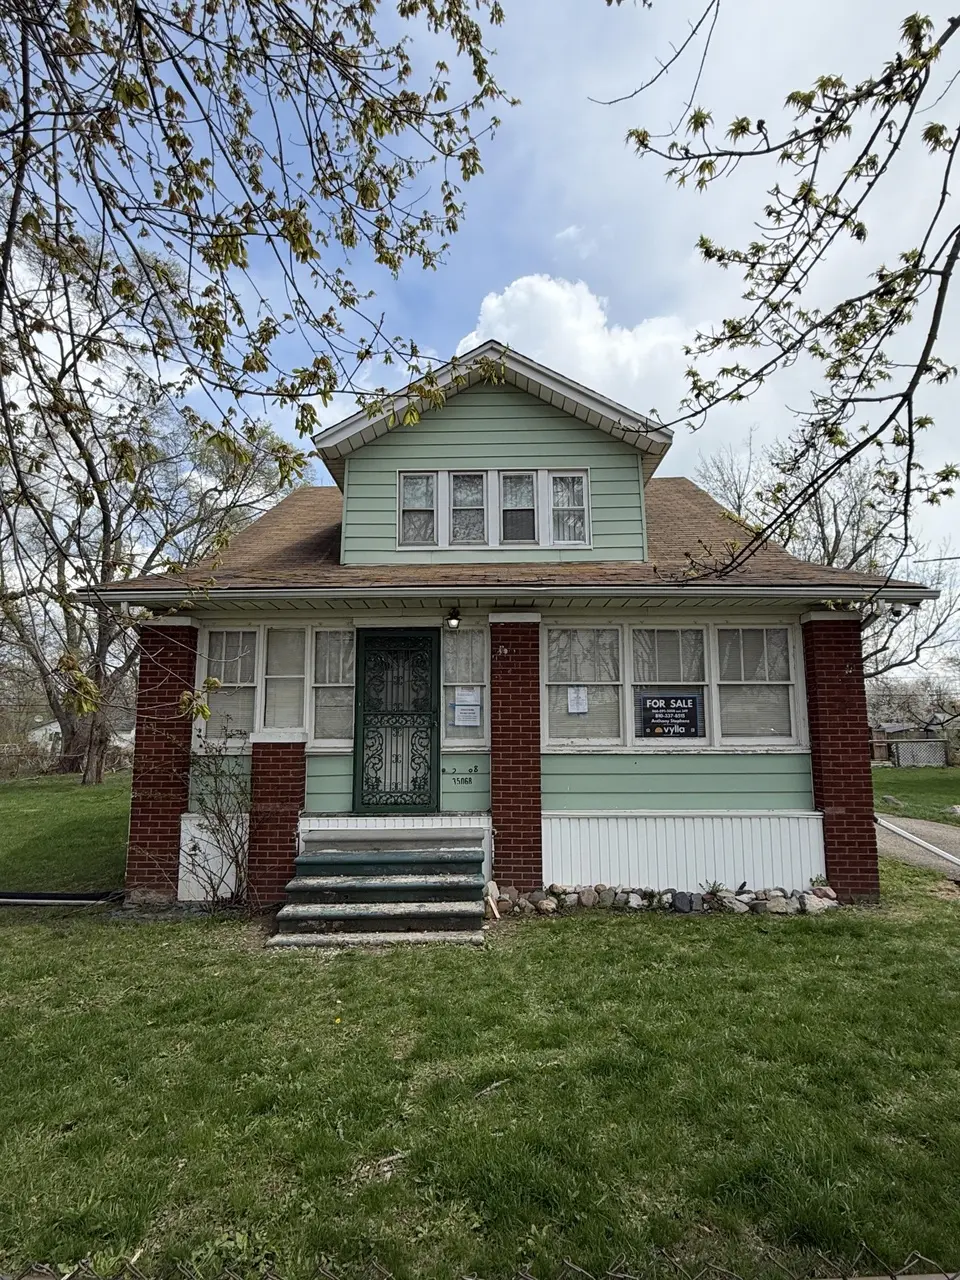
35068 Ellen St · St. Clair Shores, MI
Flood risk 1/10 · Minimal
- FEMA flood zone
- X (unshaded)
- Chance of flooding over 30 yrs
- 0.0%
- Est. flood insurance / yr
- $473 – $860
Fire risk 1/10 · Minimal
- Est. fire insurance / yr
- $784 – $1,456
Heat risk 3/10 · Minor
- Hot days now (above 96°F)
- 7 days/yr
- Hot days in 30 yrs
- 15 days/yr
Wind risk 1/10 · Minimal
- Chance of severe wind over 30 yrs
- —
Air-quality risk 4/10 · Minor
- Unhealthy air days now
- 4 days/yr
- Unhealthy air days in 30 yrs
- 6 days/yr
Risk factors via First Street. Map © Google.
Why this score? — see what drove the B- grade
The composite is a weighted blend of 9 inputs, each scored 0–100. Each bar is that input's sub-score; the figure is the points it added to the 100-point composite (weight × sub-score).
- Cash flow +26.4/30.0
- ARV discount +15.0/15.0
- DSCR +9.0/10.0
- 1% rule +8.7/10.0
- Rent growth +3.6/5.0
- Livability +2.5/5.0
- Condition / age +2.5/5.0
- Schools +1.2/10.0
- Appreciation +0.0/10.0
$139,000
🖨 Deal sheet (PDF) 📄 Offer letter ✓ Due diligence
Listing remarks MLS
Spacious 5-bedroom, 2-bath home located in a quiet Clinton Township neighborhood close to shopping, dining, schools, and everyday conveniences. Features include a large lot, detached 2-car garage, unfinished basement ready for your finishing touches, and a second-floor Juliet balcony full of character. Great opportunity for an owner-occupant or investor. Cash or 203k financing only. B/BATVAI. Bank-owned property. This property may also be marketed through an auction event on Hubzu.com. Seller will review offers submitted through the auction site as well as through the listing agent.
Key facts
- Unfinished basement
- Large lot
- Detached garage
Tags
Property features AI
Exterior
- Parking: Detached 2-car garage
- Utilities: Public water
- Home design: Colonial-style single family residence; Residential property
- Construction: Built in 1940
- Exterior features: Vinyl siding; 0.34-acre lot; Public water
Interior
- Kitchen: Kitchen (11 x 14)
- Bedrooms: Primary bedroom (14 x 16); Bedroom 2 (13 x 11); Bedroom 3 (11 x 10); Bedroom 4 (13 x 11)
- Bathrooms: Two full bathrooms (one listed as Bathroom 1, another listed as Bathroom 2)
- Heating & cooling: Forced air heating
- Interior features: Full basement; Total of 10 rooms
Neighborhood map
What this means for you Summary
Snapshot
- This is a 5-bed/1.0-bath single-family listed at $139k.
Deal economics
- At list price, monthly cash flow is $362 ($4k/yr) — positive.
- The deal already cash-flows at list — no discount required.
- Meets the 1% rule at list price ($2k rent vs $139k).
- Cap rate 9.4% vs local median 4.2% in St. Clair Shores — top-decile yield for the area; either an underpriced asset or a hidden risk that comps aren't pricing in. Stress-test before assuming the spread holds.
Location & tenants
- Location reads: area grade B — affects rentability + tenant quality, not the cash-flow math above.
- Clintondale Community Schools (suburban): math 7% / reading 20% proficiency, ranked #506 of 540 in MI (top 94%) — low school quality limits family demand, transient renter base, plan for 1-2y turnover; 74% free/reduced lunch — lower-income household profile, screen leases tightly.
- Market conditions: Rents rising fast (+4.2%/yr); 169 active listings in the ZIP; 1,321 units permitted in Macomb County in 2024 (86 in 5+ unit buildings).
- This rent runs 31% of the median local income ($73k/yr) — at the standard rent-burdened threshold; future hikes will face affordability resistance.
Forward outlook
- Local home prices are declining (-3.0%/yr); year-one equity from $961 of loan paydown is wiped out by about $4k of value loss. Plan a longer hold.
- Macomb County population projected at +9% by 2050 — modest demand growth; plan on rents tracking national, not racing it.
- At projected returns (-3.0% appreciation + 4.2% rent growth), your $39k cash investment doubles in ~9 years — after that, you're playing with house money.
Negotiation context
- Only 14 days on market — expect competitive offers; lowballing is unlikely to land.
- 3 sale attempts with the ask held roughly flat each time — persistent listings suggest the price (not the market) is what's stuck; bring a comps-based counter.
Risks & watch-outs
- Watch-outs: property tax is 3.0% of price; built in 1940 — expect roof / HVAC / electrical / plumbing capex.
Questions for the listing agent
- Built in 1940 — when were the roof, HVAC, electrical panel, plumbing, and water heater last replaced?
- Property tax is high relative to price — has the assessment been appealed recently, and will the sale trigger a re-assessment?
- Is there a deadline driving the sale (1031 exchange, divorce, estate, relocation)? That informs how much negotiation room exists.
- What's the average days-on-market for RENTAL listings here right now (not sales)? A rising rental-DOM trend means longer vacancies and softer asking-rent achievability than the comps imply.
- What's the recent tenant-quality profile in this submarket — average credit score on applications, eviction rate, late-payment / NSF rate, and stable-employment percentage? A property-management company in the area should have these aggregated.
- How much new for-sale + rental construction is in the pipeline within 1–3 miles? Heavy new supply typically softens prices + rents 12–24 months out; constrained supply supports both.
Investment metrics
- 1% rule
- 1.37% ✓
- Cap rate
- 9.42%
- Cash-on-cash
- 11.15%
- DSCR
- 1.50
- GRM
- 6.1
CMA / ARV
- ARV (median comp)
- $257,881
- List price
- $139,000
- Delta
- -46.10%
- Verdict
- UNDERPRICED
- Comps
- 20 within 1.0 mi
Show comp detail 4 sales within ~0.75 mi
| Address | Dist | Beds/Ba | Sqft | Sold | Price | $/sf | Match |
|---|---|---|---|---|---|---|---|
| 35811 Weideman St | 0.56mi | 4/2.0 (-1) | 1,978 (+6%) | 9mo | $290,000 | $147 | 47 |
| 34151 Kentucky | 0.57mi | 4/2.0 (-1) | 1,780 (-4%) | 13mo | $289,900 | $163 | 47 |
| 35088 Quinton St | 0.07mi | 4/2.5 (-1) | 1,587 (-15%) | 19mo | $235,000 | $148 | 46 |
| 22348 Thomson St | 0.65mi | 4/1.5 (-1) | 2,018 (+8%) | 16mo | $230,000 | $114 | 35 |
Match score weights: distance 35% · size 25% · config 20% · recency 20%. Top-matched comps best support the ARV.
Projected returns pro-forma
-3.0% appreciation · 4.25% rent growth · sell at horizon
- IRR
- 2.0%
- Equity multiple
- 1.08×
- Total profit
- $3,072
- Equity at exit
- $20,725
- IRR
- 13.0%
- Equity multiple
- 2.11×
- Total profit
- $43,091
- Equity at exit
- $12,018
Cash invested: $38,920 (down + closing). Projections, not guarantees.
Landlord ↔ Tenant lean methodology
- Overall (STATE)
- 62 Landlord-Friendly
- State Michigan
- 62 Landlord-Friendly · EVEN
- County
- — inherits STATE
- City
- — inherits STATE
ZIP-level market 48035
- Home prices YoY
- -29.1%
- Rents YoY
- 4.2%
- Active inventory
- 169
- Price-to-rent
- 6.1×
Monthly cashflow live
- Estimated rent
- $1,901 medium interval (Pro) →
- Mortgage (P&I)
- −$729
- Tax from tax record
- −$353 /mo · $4,239/yr
- Insurance
- −$58
- HOA
- −$0
- Vacancy / Maint / Mgmt
- −$399
- Net cashflow
- $362
Break-even live
Sensitivity live
| Price | -10% $440 | -5% $401 | +0% $362 | +5% $322 | +10% $283 |
|---|---|---|---|---|---|
| Rent | -10% $212 | -5% $287 | +0% $362 | +5% $437 | +10% $512 |
| Rate | -1.0pp $432 | -0.5pp $397 | base $362 | +0.5pp $326 | +1.0pp $289 |
UW: 25.0% down · 7.5% · 30yr · 1.5% tax · 5.0% vac · 8.0% maint · 8.0% mgmt
Financing live
Cash to close
- Down payment
- $34,750
- Closing costs
- $4,170
- Reserves months
- —
- Total cash needed
- —
Loan-product check · same deal, 3 products live
Conventional
25% down · 7.5% · 30yr
- Down + closing
- —
- Monthly P&I
- —
- Monthly cashflow
- —
- DSCR
- —
- Eligible?
- —
Personal DTI + credit; lowest rate.
DSCR
20% down · 8.5% · 30yr
- Down + closing
- —
- Monthly P&I
- —
- Monthly cashflow
- —
- DSCR
- —
- Eligible?
- —
No personal income docs; deal must DSCR.
Hard money
10% down · 12.0% · 12mo
- Down + closing
- —
- Monthly P&I
- —
- Monthly cashflow
- —
- DSCR
- —
- Eligible?
- —
Short-term bridge; refi at stabilization.
Listing history 3 events
-
2026-05-12$139,000 Active 589-char remark
Show marketing remark (589 chars)
Spacious 5-bedroom, 2-bath home located in a quiet Clinton Township neighborhood close to shopping, dining, schools, and everyday conveniences. Features include a large lot, detached 2-car garage, unfinished basement ready for your finishing touches, and a second-floor Juliet balcony full of character. Great opportunity for an owner-occupant or investor. Cash or 203k financing only. B/BATVAI. Bank-owned property. This property may also be marketed through an auction event on Hubzu.com. Seller will review offers submitted through the auction site as well as through the listing agent.
-
2026-05-12$139,000 Active
Show marketing remark (589 chars)
Spacious 5-bedroom, 2-bath home located in a quiet Clinton Township neighborhood close to shopping, dining, schools, and everyday conveniences. Features include a large lot, detached 2-car garage, unfinished basement ready for your finishing touches, and a second-floor Juliet balcony full of character. Great opportunity for an owner-occupant or investor. Cash or 203k financing only. B/BATVAI. Bank-owned property. This property may also be marketed through an auction event on Hubzu.com. Seller will review offers submitted through the auction site as well as through the listing agent.
ⓘ Source: listings_history table (triggers on properties + properties_extension) + one-shot
backfill from property_details.listing_events for pre-trigger history.
Tax reassessment forecast MI · Partial reset (capped growth)
- Current annual tax
- $4,239 · $353/mo
- Projected year-2 tax
- $4,239 · $353/mo
- Expected delta
- $0/yr ($0/mo · 0.0%)
ⓘ Screening estimate from a state-policy table — verify with the county assessor before closing.
Climate risk First Street
- Flood 1/10 Low FEMA zone X (unshaded) · 0% chance over 30 yrs
- Wildfire 1/10 Low
- Heat 3/10 Moderate 7 d/yr ≥96°F today · 15 d/yr by 30 yrs out
- Wind 1/10 Low
- Air quality 4/10 Moderate 4 unhealthy d/yr today · 6 by 30 yrs out
Nearby sold comps map
Loading sold comps map…
Walkable amenities ~0.75 mi
Loading nearby amenities…
Taxation est. · year 1
- Rental income
- $22,811
- − Mortgage interest
- −$7,786
- − Property taxes
- −$4,239
- − Insurance
- −$695
- − Repairs & maintenance
- −$1,825
- − Management
- −$1,825
- − Depreciation
- −$4,044
- Taxable income
- $2,398
- Est. tax owed @ 24.0%
- −$576
- After-tax cash flow
- $3,765/yr
For passive investors: Depreciation is non-cash, so a rental often shows a tax loss while cash-flowing — sheltering income. Rental losses are passive: they offset passive income freely, and up to $25,000/yr can offset ordinary (W-2) income if you actively participate and your MAGI is under $100k (phasing out to $0 by $150k); unused losses carry forward. On sale, claimed depreciation is recaptured at up to 25%, and gains may owe capital-gains tax (a 1031 exchange can defer both). Figures are a year-1 estimate at your 24.0% rate — not tax advice; consult a CPA.
Schools (NCES district)
- District
- Clintondale Community Schools
- NCES district ID
- 2610080
- Math proficiency
- 7% ▼ -6.00%
- Reading proficiency
- 20% ▼ -5.00%
- Median HH income
- $43,253
- Composite
- 11.83/100
- National rank
- #9675
- State rank
- #506 of 540 in MI
Livability — St. Clair Shores
No livability data for this city. (Only ~50 U.S. cities are tracked.)
Census & demographics
- County
- Macomb County · 638,552 people
- City population
- 58,217
- Metro
- Detroit-Warren-Dearborn, MI
- Population (ZIP)
- 33,569
- Household income
- $73,015
- Rent vs Own
- Severe rent burden
- 978.0
Population outlook (Macomb County) Hauer SSP2
- Today (2025)
- 925,296 people
- By 2030
- 948,226 · +2.5%
- By 2040
- 983,961 · +6.3%
- By 2050
- 1,010,200 · +9.2%
- By 2075
- 1,076,222 · +16.3%
- By 2100
- 1,077,065 · +16.4%
Race, ethnicity, and origin ACS 2023
- Neighborhood character
- Predominantly White (68%)
- Race & ethnicity
- White 68% Black 21% Two or more races 6% Hispanic / Latino 4% Asian 2%
- Common ancestry
- Romanian 14% Lithuanian 5% Slovak 2%
- Foreign-born
- 6% · Canada
- Languages at home
- 93% English-only · Spanish 2% Other Indo-European 1% Arabic 1%
Political lean MEDSL · Macomb
- 2024 margin
- R (+13.7) · D 42.2% · R 55.9% · Other 1.9%
- 2008→2024 swing
- -22.3pp toward R · 2008: 8.6pp · 2024: -13.7pp
- All cycles
- 2024: R+13.7 2020: R+8.1 2016: R+11.6 2012: D+4.0 2008: D+8.6
Not yet ingested
- Civics
- —
Market trends
- HPI YoY
- ▼ -148.36%
- Current HPI
- 362.1471
- Rent YoY
- ▲ 4.25%
- Metro
- Detroit-Warren-Dearborn, MI
- State GDP YoY
- ▲ 1.37%
- F500 in state
- 28
Industry mix (Fortune 500 HQ in MI)
| Industry | F500 HQs | Revenue |
|---|---|---|
| Automotive Parts | 3 | $48B |
|
||
| Automotive | 2 | $372B |
|
||
| Chemicals | 1 | $45B |
|
||
| Automotive Retail | 1 | $29B |
|
||
| Healthcare / Medical Devices | 1 | $23B |
|
||
| Automotive Technology | 1 | $20B |
|
||
Price history
+0.0% since first listed6 events — show timeline
- 2026-05-28 Pending — REALCOMP
- 2026-05-28 Pending — MiRealSource-MiMLS
- 2026-05-28 Pending — SW Michigan MLS
- 2026-05-12 Listed $139,000 SW Michigan MLS
- 2026-05-12 Listed $139,000 MiRealSource-MiMLS
- 2026-05-12 Listed $139,000 REALCOMP
Property tax history
+7.5%/yrLatest (2025): $4,239 · +7.5% YoY. Source: county tax records.
Cash-flow waterfall
monthlySold comps — $/sqft
last 12 mo · ≤1 miLoading sold comps…