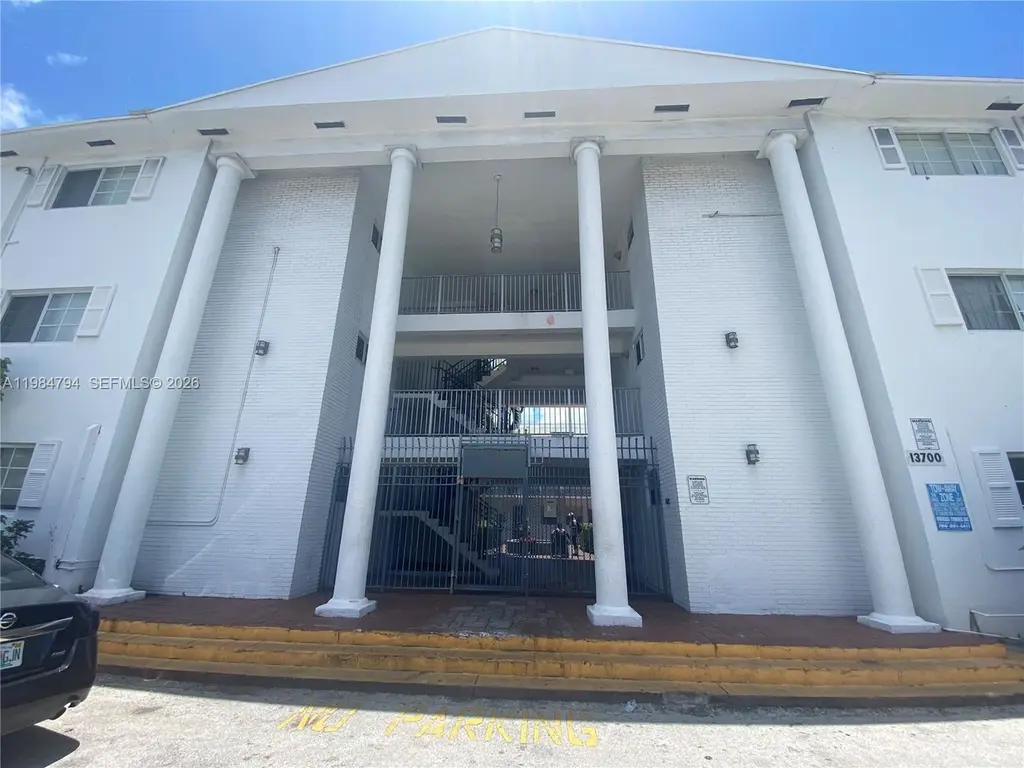
13700 NE 6th Ave #305 · North Miami, FL
Flood risk 4/10 · Minor
- FEMA flood zone
- X (unshaded)
- Chance of flooding over 30 yrs
- 0.22%
- Est. flood insurance / yr
- $507 – $1,088
Fire risk 1/10 · Minimal
- Est. fire insurance / yr
- $947 – $1,759
Heat risk 10/10 · Severe
- Hot days now (above 104°F)
- 7 days/yr
- Hot days in 30 yrs
- 29 days/yr
Wind risk 10/10 · Severe
- Chance of severe wind over 30 yrs
- 99.0%
Air-quality risk 2/10 · Minimal
- Unhealthy air days now
- 1 days/yr
- Unhealthy air days in 30 yrs
- 2 days/yr
Risk factors via First Street. Map © Google.
Why this score? — see what drove the B grade
The composite is a weighted blend of 9 inputs, each scored 0–100. Each bar is that input's sub-score; the figure is the points it added to the 100-point composite (weight × sub-score).
- Cash flow +30.0/30.0
- 1% rule +10.0/10.0
- DSCR +10.0/10.0
- ARV discount +7.5/15.0
- Schools +4.2/10.0
- Livability +4.2/5.0
- Condition / age +2.5/5.0
- Rent growth +2.3/5.0
- Appreciation +0.0/10.0
$152,500
🖨 Deal sheet 📄 Offer letter ✓ Due diligence
Listing remarks MLS
ATTENTION INVESTORS! Charming one bedroom apartment in North Miami. HOA fees are $158 monthly, which is being used to completely fix the whole condominium. Light debts were just paid, elevators are being fixed, the pool is receiving a new motor, and the whole building interior is being cemented and re-painted. NEW BOARD OF DIRECTORS. 10.11% RETURN ON INVESTMENT. Unit was just vacant by tenant, can be rented for $950-$1000
Key facts
- $387 HOA
- Garage
- Built 1964
Property features AI
Finance
- Financial info: Pets not allowed
- HOA & community: HOA fee $387 monthly
Exterior
- Parking: Garage with 1 covered space
- Home design: 3-story building; Entry on level 3
- Construction: Resale property
- Exterior features: Attached property
Interior
- Bedrooms: Bedroom located on main level
- Bathrooms: 1 full bathroom
- Interior features: Bedroom on main level; First-floor entry
Neighborhood map
What this means for you Summary
Snapshot
- This is a 1-bed/1.0-bath condo listed at $152k.
Deal economics
- At list price, monthly cash flow is $1k ($15k/yr) — positive.
- The deal already cash-flows at list — no discount required.
- Meets the 1% rule at list price ($3k rent vs $152k).
- Recommended offer: $139k (9.0% below list) — sets the bar for market timing.
- Cap rate 16.4% vs local median 4.1% in North Miami — top-decile yield for the area; either an underpriced asset or a hidden risk that comps aren't pricing in. Stress-test before assuming the spread holds.
Location & tenants
- Location reads 83/100 on livability (#51 in FL, #914 nationally) — a professional / high-income tenant draw. Strengths: amenities A+, commute A+, health & safety A+; Watch: schools D+, employment D.
- Miami-Dade (suburban): math 45% / reading 54% proficiency, ranked #40 of 73 in FL (top 55%) — families likely to look elsewhere, expect single-tenant / working-renter base with shorter leases; 64% free/reduced lunch — lower-income household profile, screen leases tightly.
- Market conditions: Rents soft (-0.7%/yr); 338 active listings in the ZIP; 10,051 units permitted in Miami-Dade County in 2024 (7,758 in 5+ unit buildings).
- At $3,437/mo this rent would consume 71% of the median local household income ($58k/yr) (locally 3226% of renters already pay >50% of income on rent) — very limited rent-growth headroom before tenants either downsize or default.
Forward outlook
- Local home prices are declining (-3.0%/yr); year-one equity from $1k of loan paydown is wiped out by about $5k of value loss. Plan a longer hold.
- Miami-Dade County population projected at +28% by 2050 — long-run rental-demand tailwind backs the buy-and-hold thesis.
- At projected returns (-3.0% appreciation + 0.0% rent growth), your $43k cash investment doubles in ~4 years — after that, you're playing with house money.
Negotiation context
- It's been on market 93 days — a 9% lower offer ($139k) is reasonable based on typical stale-listing flexibility.
- 7 sale attempts since 12y ago with the ask held roughly flat each time — persistent listings suggest the price (not the market) is what's stuck; bring a comps-based counter.
- Current owner paid $70k; list at $152k implies a 118% gain — meaningful room to come down on a strong offer.
Risks & watch-outs
- Climate carrying-cost: severe wind risk, 99% chance of damaging wind over 30y; extreme-heat days projected 7→29/yr by 2055 (HVAC capex compounding) — expect insurance premiums to compound above CPI over the hold.
Questions for the listing agent
- It's been on market 93 days. Have you received any prior offers? Is the seller open to a 9% concession, seller financing, or rate buy-down credit?
- Built in 1964 — when were the roof, HVAC, electrical panel, plumbing, and water heater last replaced?
- What does the HOA fee cover, when was the last increase, and are there any pending special assessments or reserve-fund shortfalls?
- Any open or pending special assessments — roof, HVAC, plumbing, elevator, façade? What's the per-unit balance and payoff schedule, and is the seller paying it off at close or rolling it to the buyer?
- Why hasn't it sold? Are there any deal-killer items the seller is aware of (foundation, flood, title, zoning, code violations)?
- Is there a deadline driving the sale (1031 exchange, divorce, estate, relocation)? That informs how much negotiation room exists.
- Schools are D-rated, which usually means shorter tenancies and higher turnover. Who's the typical renter profile here, and what's been the actual vacancy rate?
- What's the average days-on-market for RENTAL listings here right now (not sales)? A rising rental-DOM trend means longer vacancies and softer asking-rent achievability than the comps imply.
- What's the recent tenant-quality profile in this submarket — average credit score on applications, eviction rate, late-payment / NSF rate, and stable-employment percentage? A property-management company in the area should have these aggregated.
- How much new apartment / multifamily construction is in the pipeline within 1–3 miles? Heavy new supply (>2% of stock underway) typically softens rents 12–24 months out; light construction supports rent growth.
Investment metrics
- 1% rule
- 2.25% ✓
- Cap rate
- 16.45%
- Cash-on-cash
- 36.27%
- DSCR
- 2.61
- GRM
- 3.7
CMA / ARV
No comps found within radius.
Projected returns pro-forma
-3.0% appreciation · 0.0% rent growth · sell at horizon
- IRR
- 28.1%
- Equity multiple
- 2.12×
- Total profit
- $47,702
- Equity at exit
- $22,738
- IRR
- 33.5%
- Equity multiple
- 3.57×
- Total profit
- $109,604
- Equity at exit
- $13,185
Cash invested: $42,700 (down + closing). Projections, not guarantees.
Landlord ↔ Tenant lean methodology
- Overall (STATE)
- 87 Strongly Landlord-Friendly
- State Florida
- 87 Strongly Landlord-Friendly · R+3
- County
- — inherits STATE
- City
- — inherits STATE
ZIP-level market 33161
- Rents YoY
- -0.7%
- Active inventory
- 338
- Price-to-rent
- 3.7×
Monthly cashflow live
- Estimated rent
- $3,437 medium interval (Pro) →
- Mortgage (P&I)
- −$800
- Tax from tax record
- −$174 /mo · $2,088/yr
- Insurance
- −$64
- HOA
- −$387
- Vacancy / Maint / Mgmt
- −$722
- Net cashflow
- $1,291
Break-even live
UW: 25.0% down · 7.5% · 30yr · 1.5% tax · 5.0% vac · 8.0% maint · 8.0% mgmt
Financing live
Cash to close
- Down payment
- $38,125
- Closing costs
- $4,575
- Reserves months
- —
- Total cash needed
- —
Loan-product check · same deal, 3 products live
Conventional
25% down · 7.5% · 30yr
- Down + closing
- —
- Monthly P&I
- —
- Monthly cashflow
- —
- DSCR
- —
- Eligible?
- —
Personal DTI + credit; lowest rate.
DSCR
20% down · 8.5% · 30yr
- Down + closing
- —
- Monthly P&I
- —
- Monthly cashflow
- —
- DSCR
- —
- Eligible?
- —
No personal income docs; deal must DSCR.
Hard money
10% down · 12.0% · 12mo
- Down + closing
- —
- Monthly P&I
- —
- Monthly cashflow
- —
- DSCR
- —
- Eligible?
- —
Short-term bridge; refi at stabilization.
HOA detail condo
- Monthly dues
- $387 · $4,644/yr
- Likely covers
- pool
- Assessments
- None detected in remarks — confirm with the listing agent.
Listing history 32 events
-
2026-06-18days on market $152,500 Active 93 DOM
-
2026-06-17days on market $152,500 Active 92 DOM
-
2026-06-16days on market $152,500 Active 91 DOM
-
2026-06-15days on market $152,500 Active 90 DOM
-
2026-06-13days on market $152,500 Active 88 DOM
-
2026-06-09days on market $152,500 Active 84 DOM
-
2026-06-08days on market $152,500 Active 83 DOM
-
2026-06-07days on market $152,500 Active 82 DOM
-
2026-06-04days on market $152,500 Active 79 DOM
-
2026-06-03days on market $152,500 Active 78 DOM
-
2026-06-02days on market $152,500 Active 77 DOM
-
2026-06-01days on market $152,500 Active 76 DOM
-
2026-05-31days on market $152,500 Active 75 DOM
-
2026-03-17$152,500 Active
-
2018-03-14soldstatus $70,000
-
2018-03-05soldstatus $70,000 Sold 425-char remark
Show marketing remark (425 chars)
ATTENTION INVESTORS! Charming one bedroom apartment in North Miami. HOA fees are $158 monthly, which is being used to completely fix the whole condominium. Light debts were just paid, elevators are being fixed, the pool is receiving a new motor, and the whole building interior is being cemented and re-painted. NEW BOARD OF DIRECTORS. 10.11% RETURN ON INVESTMENT. Unit was just vacant by tenant, can be rented for $950-$1000
-
2018-02-16status Pending 425-char remark
Show marketing remark (425 chars)
ATTENTION INVESTORS! Charming one bedroom apartment in North Miami. HOA fees are $158 monthly, which is being used to completely fix the whole condominium. Light debts were just paid, elevators are being fixed, the pool is receiving a new motor, and the whole building interior is being cemented and re-painted. NEW BOARD OF DIRECTORS. 10.11% RETURN ON INVESTMENT. Unit was just vacant by tenant, can be rented for $950-$1000
-
2018-01-04$75,000 Active 425-char remark
Show marketing remark (425 chars)
ATTENTION INVESTORS! Charming one bedroom apartment in North Miami. HOA fees are $158 monthly, which is being used to completely fix the whole condominium. Light debts were just paid, elevators are being fixed, the pool is receiving a new motor, and the whole building interior is being cemented and re-painted. NEW BOARD OF DIRECTORS. 10.11% RETURN ON INVESTMENT. Unit was just vacant by tenant, can be rented for $950-$1000
-
2017-12-31historical
-
2017-09-29price $75,000
-
2017-03-28$79,000 Active
-
2017-03-07soldstatus $55,000
-
2015-09-06soldstatus $49,000 Sold
-
2015-08-25soldstatus $49,000
-
2015-07-21status Active
-
2015-07-17status Pending
-
2015-04-02$54,000 Active
-
2014-07-07soldstatus $32,000 Sold
-
2014-06-06status Pending
-
2014-04-01$39,900 Active
-
2014-01-10historical
-
2014-01-07$20,000 Active
ⓘ Source: listings_history table (triggers on properties + properties_extension) + one-shot
backfill from property_details.listing_events for pre-trigger history.
Tax reassessment forecast FL · Resets to sale price
- Current annual tax
- $2,088 · $174/mo
- Projected year-2 tax
- $2,088 · $174/mo
- Expected delta
- $0/yr ($0/mo · 0.0%)
ⓘ Screening estimate from a state-policy table — verify with the county assessor before closing.
Climate risk First Street
- Flood 4/10 Moderate FEMA zone X (unshaded) · 22% chance over 30 yrs
- Wildfire 1/10 Low
- Heat 10/10 Extreme 7 d/yr ≥104°F today · 29 d/yr by 30 yrs out
- Wind 10/10 Extreme 99% chance of damaging wind over 30 yrs
- Air quality 2/10 Low 1 unhealthy d/yr today · 2 by 30 yrs out
Nearby sold comps map
Loading sold comps map…
Walkable amenities ~0.75 mi
Loading nearby amenities…
Taxation est. · year 1
- Rental income
- $41,241
- − Mortgage interest
- −$8,542
- − Property taxes
- −$2,088
- − Insurance
- −$762
- − Repairs & maintenance
- −$3,299
- − Management
- −$3,299
- − HOA
- −$4,644
- − Depreciation
- −$4,436
- Taxable income
- $14,169
- Est. tax owed @ 24.0%
- −$3,400
- After-tax cash flow
- $12,088/yr
For passive investors: Depreciation is non-cash, so a rental often shows a tax loss while cash-flowing — sheltering income. Rental losses are passive: they offset passive income freely, and up to $25,000/yr can offset ordinary (W-2) income if you actively participate and your MAGI is under $100k (phasing out to $0 by $150k); unused losses carry forward. On sale, claimed depreciation is recaptured at up to 25%, and gains may owe capital-gains tax (a 1031 exchange can defer both). Figures are a year-1 estimate at your 24.0% rate — not tax advice; consult a CPA.
Schools (NCES district)
- District
- Miami-Dade
- NCES district ID
- 1200390
- Math proficiency
- 45% ▼ -16.00%
- Reading proficiency
- 54% ▼ -5.00%
- Median HH income
- $43,928
- Composite
- 41.76/100
- National rank
- #3397
- State rank
- #40 of 73 in FL
Livability — North Miami
- Score
- 83/100
- State rank
- #51
- US rank
- #914
Category grades
Schools grade is shown separately in the Schools card above.
Census & demographics
- Census place
- North Miami, FL
- County
- Miami-Dade County · 2,697,751 people
- Metro
- Miami-Fort Lauderdale-Pompano Beach, FL
- Population (ZIP)
- 54,814
- Household income
- $58,325
- Rent vs Own
- Severe rent burden
- 3226.0
Population outlook (Miami-Dade County) Hauer SSP2
- Today (2025)
- 3,126,439 people
- By 2030
- 3,325,765 · +6.4%
- By 2040
- 3,697,561 · +18.3%
- By 2050
- 4,012,134 · +28.3%
- By 2075
- 4,605,612 · +47.3%
- By 2100
- 4,866,598 · +55.7%
Race, ethnicity, and origin ACS 2023
- Neighborhood character
- Diverse neighborhood (Simpson 0.58)
- Race & ethnicity
- Black 56% Hispanic / Latino 31% Two or more races 18% White 8% Asian 2%
- Hispanic origin (detail)
- Puerto Rican 4% Cuban 7% Dominican 4% Salvadoran 1%
- Common ancestry
- Hispanic 35% Estonian 1% Lithuanian 1%
- Foreign-born
- 51% · Canada, Jamaica, Dominican Republic
- Languages at home
- 25% English-only · French/Haitian/Cajun 41% Spanish 30% Other Indo-European 2%
Political lean MEDSL · Miami-Dade
- 2024 margin
- R (+11.4) · D 43.9% · R 55.4%
- 2008→2024 swing
- -27.6pp toward R · 2008: 16.1pp · 2024: -11.4pp
- All cycles
- 2024: R+11.4 2020: D+7.3 2016: D+29.6 2012: D+23.7 2008: D+16.1
Not yet ingested
- Civics
- —
Market trends
- HPI YoY
- ▼ -492.86%
- Current HPI
- 630.6932
- Rent YoY
- ▼ -0.73%
- Metro
- Miami-Fort Lauderdale-Pompano Beach, FL
- State GDP YoY
- ▲ 3.28%
- F500 in state
- 36
Industry mix (Fortune 500 HQ in FL)
| Industry | F500 HQs | Revenue |
|---|---|---|
| Industrial Technology | 2 | $29B |
|
||
| Insurance | 2 | $17B |
|
||
| Retail | 1 | $60B |
|
||
| Technology Distribution | 1 | $58B |
|
||
| Homebuilding | 1 | $35B |
|
||
| Technology Manufacturing | 1 | $35B |
|
||
Price history
+662.5% since first listed19 events — show timeline
- 2026-03-17 Listed $152,500 MARMLS
- 2018-03-14 Sold (Public Records) $70,000 Public Records
- 2018-03-05 Sold (MLS) $70,000 MARMLS
- 2018-02-16 Pending — MARMLS
- 2018-01-04 Listed $75,000 MARMLS
- 2017-12-31 Listing Removed — MARMLS
- 2017-09-29 Price Changed $75,000 MARMLS
- 2017-03-28 Listed $79,000 MARMLS
- 2017-03-07 Sold (Public Records) $55,000 Public Records
- 2015-09-06 Sold (MLS) $49,000 MARMLS
- 2015-08-25 Sold (Public Records) $49,000 Public Records
- 2015-07-21 Relisted — MARMLS
- 2015-07-17 Pending — MARMLS
- 2015-04-02 Listed $54,000 MARMLS
- 2014-07-07 Sold (MLS) $32,000 MARMLS
- 2014-06-06 Pending — MARMLS
- 2014-04-01 Listed $39,900 MARMLS
- 2014-01-10 Listing Removed — MARMLS
- 2014-01-07 Listed $20,000 MARMLS
Property tax history
+20.2%/yrLatest (2025): $2,088 · +3.8% YoY. Source: county tax records.
Cash-flow waterfall
monthlySold comps — $/sqft
last 12 mo · ≤1 miLoading sold comps…