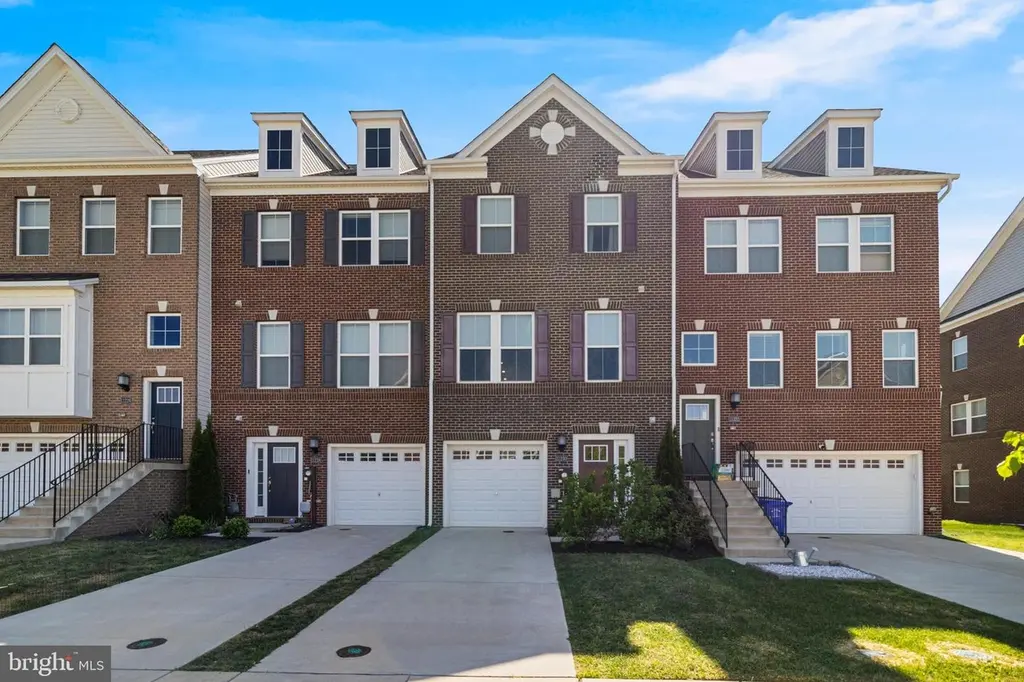
11230 Beatrix Potter Pl · Waldorf, MD
Flood risk 1/10 · Minimal
- FEMA flood zone
- X (unshaded)
- Chance of flooding over 30 yrs
- 0.0%
- Est. flood insurance / yr
- $507 – $1,088
Fire risk 4/10 · Minor
- Est. fire insurance / yr
- $755 – $1,403
Heat risk 8/10 · Major
- Hot days now (above 103°F)
- 7 days/yr
- Hot days in 30 yrs
- 16 days/yr
Wind risk 5/10 · Moderate
- Chance of severe wind over 30 yrs
- 25.0%
Air-quality risk 2/10 · Minimal
- Unhealthy air days now
- 1 days/yr
- Unhealthy air days in 30 yrs
- 2 days/yr
Risk factors via First Street. Map © Google.
Why this score? — see what drove the D grade
The composite is a weighted blend of 9 inputs, each scored 0–100. Each bar is that input's sub-score; the figure is the points it added to the 100-point composite (weight × sub-score).
- ARV discount +13.8/15.0
- Cash flow +9.1/30.0
- Condition / age +4.0/5.0
- Livability +3.6/5.0
- 1% rule +3.2/10.0
- DSCR +2.5/10.0
- Rent growth +2.5/5.0
- Schools +2.3/10.0
- Appreciation +0.0/10.0
$410,000
🖨 Deal sheet 📄 Offer letter ✓ Due diligence
Listing remarks
Tucked away in the charming Stonehaven subdivision is your dream come true. This property provides tremendous value with a front entry garage and a lovely back yard with a large deck to spend your weekends in the summer time (if you're not poolside at the luxury community pool!) Inside you'll find high end finishes with stainless steel appliances, a huge kitchen island, and an open layout. A rare find with a half bath also on the 1st level. Stonehaven is located just seconds away from Laurel Springs Park, shopping in La Plata, or a convenient commute to Washington DC or Pax. Don't miss this beautiful basically new townhome before it's gone!
Key facts
- 1,786 sq ft lot
- Garage
- Community pool
Property features AI
Finance
- HOA & community: HOA fee $1,050 annually
Exterior
- Parking: Attached front-entry garage (1 space)
- Utilities: Public water; Public sewer; Electric power
- Home design: Detached property; Exterior made of brick; Slab foundation; Finished area above grade reported by assessor
- Construction: Brick construction; Slab foundation; Detached structure
- Exterior features: Community pool; Lot dimensions reported by assessor
Interior
- Bedrooms: Three bedrooms on the upper level
- Bathrooms: Two full bathrooms (all upper levels); Two half bathrooms total (one on main level, one on upper level)
- Heating & cooling: Heat pump(s); Natural gas heating; Electric hot water; Electric cooling
- Interior features: No basement; Living area reported by assessor
Neighborhood map
What this means for you Summary
Snapshot
- This is a 3-bed/3.0-bath townhouse listed at $410k. Condition is rated good.
Deal economics
- At list price, monthly cash flow is $-314 ($-4k/yr) — negative.
- To cash-flow at today's rent, offer at most $355k (13.5% below list).
- To meet the 1% rule (rent ≥ 1% of price), the offer needs to be $338k (17.5% below list).
- Recommended offer: $338k (17.5% below list) — sets the bar for 1% rule.
Location & tenants
- Location reads 72/100 on livability (#141 in MD) — a middle-class / working-renter tenant base. Strengths: commute A+, employment A+, housing A+; Watch: crime D-, amenities F, cost of living F.
- Charles County Public Schools (suburban): math 13% / reading 29% proficiency, ranked #14 of 24 in MD (top 58%) — low school quality limits family demand, transient renter base, plan for 1-2y turnover.
- Zoned schools: Mary B. Neal Elementary School (math 9% / reading 17%, grade F, #526 of 860 statewide, top 62%, 627 students, 45% FRL); Milton M. Somers Middle School (math 15% / reading 36%, grade F, #97 of 225 statewide, top 46%, 666 students, 39% FRL); St. Charles High School (math 26% / reading 41%, grade F, #148 of 222 statewide, top 67%, 1,569 students, 48% FRL) — zoned schools average 44% FRL vs 28% district-wide (16 pts higher); higher-poverty schools than district average — tighter screening recommended.
- Market conditions: 245 active listings in the ZIP; 15 comparable units currently listed for rent nearby; rentals at typical pace (median 22d on market — plan ~3-4 weeks tenant-placement turnaround); high-income renter base; 1,542 units permitted in Charles County in 2024 (516 in 5+ unit buildings).
Forward outlook
- Local home prices are declining (-3.0%/yr); year-one equity from $3k of loan paydown is wiped out by about $12k of value loss. Plan a longer hold.
- Charles County population projected at +27% by 2050 — long-run rental-demand tailwind backs the buy-and-hold thesis.
Negotiation context
- Only 4 days on market — expect competitive offers; lowballing is unlikely to land.
Risks & watch-outs
- Climate carrying-cost: moderate wind risk, 25% chance of damaging wind over 30y; extreme-heat days projected 7→16/yr by 2055 (HVAC capex compounding) — expect insurance premiums to compound above CPI over the hold.
Questions for the listing agent
- What do current leases actually rent for vs. the listed asking? Can we see a recent rent roll and the last 12 months of T-12 income?
- What does the HOA fee cover, when was the last increase, and are there any pending special assessments or reserve-fund shortfalls?
- Is there a deadline driving the sale (1031 exchange, divorce, estate, relocation)? That informs how much negotiation room exists.
- Schools are D-rated, which usually means shorter tenancies and higher turnover. Who's the typical renter profile here, and what's been the actual vacancy rate?
- Crime grade is D in this area — have there been break-ins, vandalism, or insurance claims at this property in the last 3 years? What carrier currently insures it and at what premium?
- The area grade is low — what's the realistic commute time and amenity access for the typical tenant pool here? Any planned neighborhood developments (good or bad) we should know about?
- What's the average days-on-market for RENTAL listings here right now (not sales)? A rising rental-DOM trend means longer vacancies and softer asking-rent achievability than the comps imply.
- What's the recent tenant-quality profile in this submarket — average credit score on applications, eviction rate, late-payment / NSF rate, and stable-employment percentage? A property-management company in the area should have these aggregated.
- How much new for-sale + rental construction is in the pipeline within 1–3 miles? Heavy new supply typically softens prices + rents 12–24 months out; constrained supply supports both.
Investment metrics
- 1% rule
- 0.82% ✗
- Cap rate
- 5.37%
- Cash-on-cash
- -3.28%
- DSCR
- 0.85
- GRM
- 10.1
CMA / ARV
- ARV (median comp)
- $477,192
- List price
- $410,000
- Delta
- -14.08%
- Verdict
- UNDERPRICED
- Comps
- 20 within 1.0 mi
Show comp detail 12 sales within ~0.75 mi
| Address | Dist | Beds/Ba | Sqft | Sold | Price | $/sf | Match |
|---|---|---|---|---|---|---|---|
| 5638 Ludlow Pl | 0.63mi | 3/3.5 | 1,886 (-2%) | 1mo | $376,990 | $200 | 65 |
| 5639 Ludlow Pl | 0.63mi | 3/3.5 | 1,886 (-2%) | 1mo | $379,990 | $201 | 65 |
| 5558 Marksburg Pl | 0.66mi | 3/3.5 | 1,871 (-3%) | 1mo | $379,990 | $203 | 62 |
| 5616 Ludlow Pl | 0.66mi | 3/3.5 | 1,871 (-3%) | 1mo | $379,990 | $203 | 62 |
| 5640 Ludlow Pl | 0.62mi | 2/3.5 (-1) | 1,871 (-3%) | 1mo | $379,990 | $203 | 59 |
| 5907 Kate Chopin Pl | 0.55mi | 3/3.5 | 2,093 (+9%) | 1mo | $405,000 | $194 | 57 |
| 5580 Ludlow Pl | 0.74mi | 2/3.5 (-1) | 1,886 (-2%) | 1mo | $377,990 | $200 | 55 |
| 5627 Ludlow Pl | 0.65mi | 2/3.5 (-1) | 1,829 (-5%) | 1mo | $379,990 | $208 | 54 |
| 5556 Marksburg Pl | 0.67mi | 2/3.5 (-1) | 1,829 (-5%) | 1mo | $372,990 | $204 | 54 |
| 10971 Barnard Pl | 0.61mi | 3/2.5 | 2,117 (+10%) | 1mo | $417,990 | $197 | 52 |
| 10963 Barnard Pl | 0.62mi | 3/3.5 | 2,160 (+12%) | 1mo | $407,990 | $189 | 48 |
| 10977 Barnard Pl | 0.60mi | 3/2.5 | 2,192 (+14%) | 1mo | $417,990 | $191 | 46 |
Match score weights: distance 35% · size 25% · config 20% · recency 20%. Top-matched comps best support the ARV.
Projected returns pro-forma
-3.0% appreciation · 3.0% rent growth · sell at horizon
- IRR
- -21.7%
- Equity multiple
- 0.25×
- Total profit
- $-86,299
- Equity at exit
- $61,132
- IRR
- -15.4%
- Equity multiple
- 0.13×
- Total profit
- $-100,322
- Equity at exit
- $35,449
Cash invested: $114,800 (down + closing). Projections, not guarantees.
Landlord ↔ Tenant lean methodology
- Overall (STATE)
- 27 Tenant-Leaning
- State Maryland
- 27 Tenant-Leaning · D+14
- County
- — inherits STATE
- City
- — inherits STATE
ZIP-level market 20695
- Home prices YoY
- -5.3%
- Active inventory
- 245
- Price-to-rent
- 10.1×
Monthly cashflow live
- Estimated rent
- $3,381 high interval (Pro) →
- Mortgage (P&I)
- −$2,150
- Tax from tax record
- −$576 /mo · $6,912/yr
- Insurance
- −$171
- HOA
- −$88
- Vacancy / Maint / Mgmt
- −$710
- Net cashflow
- $-314
Break-even live
UW: 25.0% down · 7.5% · 30yr · 1.5% tax · 5.0% vac · 8.0% maint · 8.0% mgmt
Financing live
Cash to close
- Down payment
- $102,500
- Closing costs
- $12,300
- Reserves months
- —
- Total cash needed
- —
Loan-product check · same deal, 3 products live
Conventional
25% down · 7.5% · 30yr
- Down + closing
- —
- Monthly P&I
- —
- Monthly cashflow
- —
- DSCR
- —
- Eligible?
- —
Personal DTI + credit; lowest rate.
DSCR
20% down · 8.5% · 30yr
- Down + closing
- —
- Monthly P&I
- —
- Monthly cashflow
- —
- DSCR
- —
- Eligible?
- —
No personal income docs; deal must DSCR.
Hard money
10% down · 12.0% · 12mo
- Down + closing
- —
- Monthly P&I
- —
- Monthly cashflow
- —
- DSCR
- —
- Eligible?
- —
Short-term bridge; refi at stabilization.
Rent comps 15 comps
| Address | Beds | Baths | Sqft | Rent | $/sqft | DOM | Units | Dist |
|---|---|---|---|---|---|---|---|---|
| 4165 Brodie Pl White Plains, MD | 3.0 | 3.5 | 2544 | $3,000 | $1.18 | 17d | 1 | 0.25mi |
| 11180 Conway Pl White Plains, MD | 3.0 | 2.5 | 1765 | $3,258 | $1.85 | 5d | 7 | 0.27mi |
| 5754 Frederick Douglas Pl White Plains, MD | 3.0 | 3.5 | 2220 | $3,500 | $1.58 | 43d | 1 | 0.38mi |
| 11472 Stockport Pl White Plains, MD | 4.0 | 3.5 | 2418 | $3,500 | $1.45 | 43d | 1 | 0.41mi |
| 5692 Glencoe Pl White Plains, MD | 3.0 | 2.5 | 1942 | $3,332 | $1.72 | 2d | 2 | 0.46mi |
| 10939 Drummond Pl White Plains, MD | 3.0 | 2.5 | 2192 | $3,500 | $1.60 | 24d | 1 | 0.67mi |
| 10933 Drummond Pl Unit 10933 White Plains, MD | 3.0 | 3.0 | 2300 | $3,500 | $1.52 | 5d | 1 | 0.68mi |
| 10893 Drummond Pl White Plains, MD | 3.0 | 2.5 | 2192 | $3,250 | $1.48 | 22d | 1 | 0.71mi |
| 3908 Glacier Bay Pl White Plains, MD | 3.0 | 2.5 | 2388 | $3,200 | $1.34 | 24d | 1 | 0.75mi |
| 5527 Aberdeen Pl White Plains, MD | 3.0 | 4.0 | 1880 | $3,000 | $1.60 | 12d | 1 | 0.80mi |
| 5525 Peanuts Ln Waldorf, MD | 3.0 | 4.0 | 2160 | $3,400 | $1.57 | 43d | 1 | 0.81mi |
| 11761 Nationals Ln Unit 11761 Waldorf, MD | 3.0 | 2.5 | 2160 | $3,200 | $1.48 | 24d | 1 | 0.96mi |
| 11761 Nationals Ln Unit 11761 Waldorf, MD | 3.0 | 2.5 | 2160 | $3,200 | $1.48 | 12d | 1 | 0.96mi |
| 5423 Saint Rita Dr Waldorf, MD | 3.0 | 2.5 | 2268 | $3,000 | $1.32 | 43d | 1 | 1.03mi |
| 11696 Palm Desert Pl Waldorf, MD | 3.0 | 2.5 | 1720 | $2,900 | $1.69 | 17d | 1 | 1.45mi |
HOA detail
- Monthly dues
- $88 · $1,056/yr
- Likely covers
- pool
Listing history 3 events
-
2026-05-03historical Active Under Contract 649-char remark
-
2026-04-30$410,000 Active 649-char remark
-
2026-04-23historical $410,000 649-char remark
ⓘ Source: listings_history table (triggers on properties + properties_extension) + one-shot
backfill from property_details.listing_events for pre-trigger history.
Tax reassessment forecast MD · Partial reset (capped growth)
- Current annual tax
- $6,912 · $576/mo
- Projected year-2 tax
- $6,912 · $576/mo
- Expected delta
- $0/yr ($0/mo · 0.0%)
ⓘ Screening estimate from a state-policy table — verify with the county assessor before closing.
Climate risk First Street
- Flood 1/10 Low FEMA zone X (unshaded) · 0% chance over 30 yrs
- Wildfire 4/10 Moderate
- Heat 8/10 Severe 7 d/yr ≥103°F today · 16 d/yr by 30 yrs out
- Wind 5/10 Major 25% chance of damaging wind over 30 yrs
- Air quality 2/10 Low 1 unhealthy d/yr today · 2 by 30 yrs out
Nearby sold comps map
Loading sold comps map…
Walkable amenities ~0.75 mi
Loading nearby amenities…
Taxation est. · year 1
- Rental income
- $40,569
- − Mortgage interest
- −$22,966
- − Property taxes
- −$6,912
- − Insurance
- −$2,050
- − Repairs & maintenance
- −$3,246
- − Management
- −$3,246
- − HOA
- −$1,056
- − Depreciation
- −$11,927
- Taxable loss
- −$10,833
- Est. tax savings @ 24.0%
- +$2,600
- After-tax cash flow
- $-1,169/yr
For passive investors: Depreciation is non-cash, so a rental often shows a tax loss while cash-flowing — sheltering income. Rental losses are passive: they offset passive income freely, and up to $25,000/yr can offset ordinary (W-2) income if you actively participate and your MAGI is under $100k (phasing out to $0 by $150k); unused losses carry forward. On sale, claimed depreciation is recaptured at up to 25%, and gains may owe capital-gains tax (a 1031 exchange can defer both). Figures are a year-1 estimate at your 24.0% rate — not tax advice; consult a CPA.
Condition & rehab AI · 1 photo
This well-maintained townhome in Stonehaven subdivision is in good condition with minimal repairs needed. It offers a good return on investment with updates that can significantly increase its value.
Value-add opportunities
- Both Painting exterior and interior — Fresh paint enhances curb appeal and interior aesthetics
- Both Landscaping improvements — Enhances curb appeal and adds value
- Both New flooring in bathrooms — Freshens up the bathrooms and adds value
- Both New kitchen appliances — Freshens up the kitchen and adds value
Renovation cost estimate screening
Value-add ROI direction
- Both Painting exterior and interior — Fresh paint enhances curb appeal and interior aesthetics ↑
- Both Landscaping improvements — Enhances curb appeal and adds value ↑
- Both New flooring in bathrooms — Freshens up the bathrooms and adds value ↑
- Both New kitchen appliances — Freshens up the kitchen and adds value ↑
ⓘ Cost ranges are severity-bucket heuristics (US national rule-of-thumb). Get contractor quotes + a written scope before underwriting a rehab budget.
Schools (NCES district)
- District
- Charles County Public Schools
- NCES district ID
- 2400270
- Math proficiency
- 13% ▼ -19.00%
- Reading proficiency
- 29% ▼ -13.00%
- Median HH income
- $90,389
- Composite
- 22.54/100
- National rank
- #8087
- State rank
- #14 of 24 in MD
Livability — Waldorf
- Score
- 72/100
- State rank
- #141
- US rank
- #6083
Category grades
Schools grade is shown separately in the Schools card above.
Census & demographics
- Census place
- Waldorf, MD
- County
- Charles County · 103,527 people
- City population
- 103,527
- Metro
- Washington-Arlington-Alexandria, DC-VA-MD-WV
- Population (ZIP)
- 16,407
- Household income
- $141,959
- Rent vs Own
- Severe rent burden
- 311.0
Population outlook (Charles County) Hauer SSP2
- Today (2025)
- 176,616 people
- By 2030
- 186,471 · +5.6%
- By 2040
- 206,472 · +16.9%
- By 2050
- 224,883 · +27.3%
- By 2075
- 272,101 · +54.1%
- By 2100
- 303,564 · +71.9%
Race, ethnicity, and origin ACS 2023
- Neighborhood character
- Diverse neighborhood (Simpson 0.58)
- Race & ethnicity
- Black 61% White 23% Two or more races 9% Hispanic / Latino 4% Asian 2%
- Common ancestry
- Slovak 1% Italian 1% Lithuanian 1%
- Foreign-born
- 9% · Canada, South Korea
- Languages at home
- 91% English-only · Spanish 4% Tagalog/Filipino 1% French/Haitian/Cajun 1%
Political lean MEDSL · Charles
- 2024 margin
- Solid D (+40.7) · D 69.2% · R 28.5% · Other 2.2%
- 2008→2024 swing
- +15.2pp toward D · 2008: 25.5pp · 2024: 40.7pp
- All cycles
- 2024: D+40.7 2020: D+40.9 2016: D+30.2 2012: D+31.3 2008: D+25.5
Not yet ingested
- Civics
- —
Market trends
- HPI YoY
- ▼ -12.63%
- Current HPI
- 226.972
- Rent YoY
- —
- Metro
- Washington-Arlington-Alexandria, DC-VA-MD-WV
- State GDP YoY
- ▲ 2.97%
- F500 in state
- 12
Industry mix (Fortune 500 HQ in MD)
| Industry | F500 HQs | Revenue |
|---|---|---|
| Aerospace / Defense | 1 | $71B |
|
||
| Utilities | 1 | $25B |
|
||
| Hotels | 1 | $24B |
|
||
| Consumer Goods | 1 | $7B |
|
||
| Real Estate | 1 | $6B |
|
||
| Chemicals | 1 | $2B |
|
||
Price history
+0.0% since first listed5 events — show timeline
- 2026-06-05 Sold (MLS) $410,000 BRIGHT MLS
- 2026-05-28 Pending — BRIGHT MLS
- 2026-05-03 Contingent — BRIGHT MLS
- 2026-04-30 Listed $410,000 BRIGHT MLS
- 2026-04-23 Coming Soon $410,000 BRIGHT MLS
Property tax history
+3.7%/yrLatest (2025): $6,912 · +4.9% YoY. Source: county tax records.
Cash-flow waterfall
monthlySold comps — $/sqft
last 12 mo · ≤1 miLoading sold comps…